[Preprint]. 2025 Jun 18:2025.06.17.660204.
doi: 10.1101/2025.06.17.660204.

The Luminal Ring Protein C2CD3 Acts as a Radial In-to-Out Organizer of the Distal Centriole and Appendages

Affiliations

The Luminal Ring Protein C2CD3 Acts as a Radial In-to-Out Organizer of the Distal Centriole and Appendages

Eloïse Bertiaux et al. bioRxiv. .

Abstract

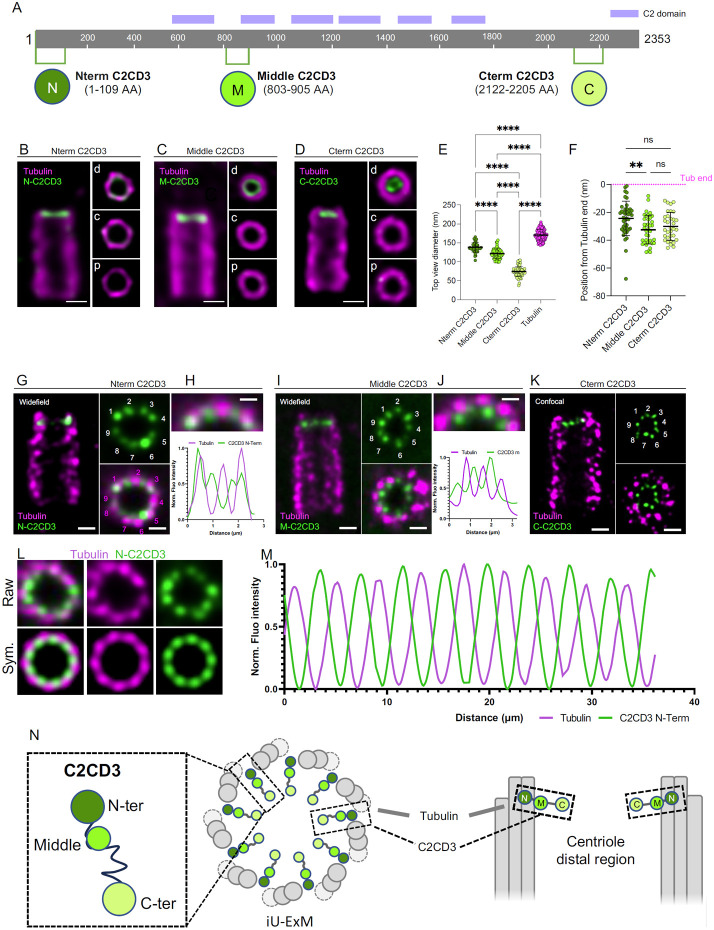
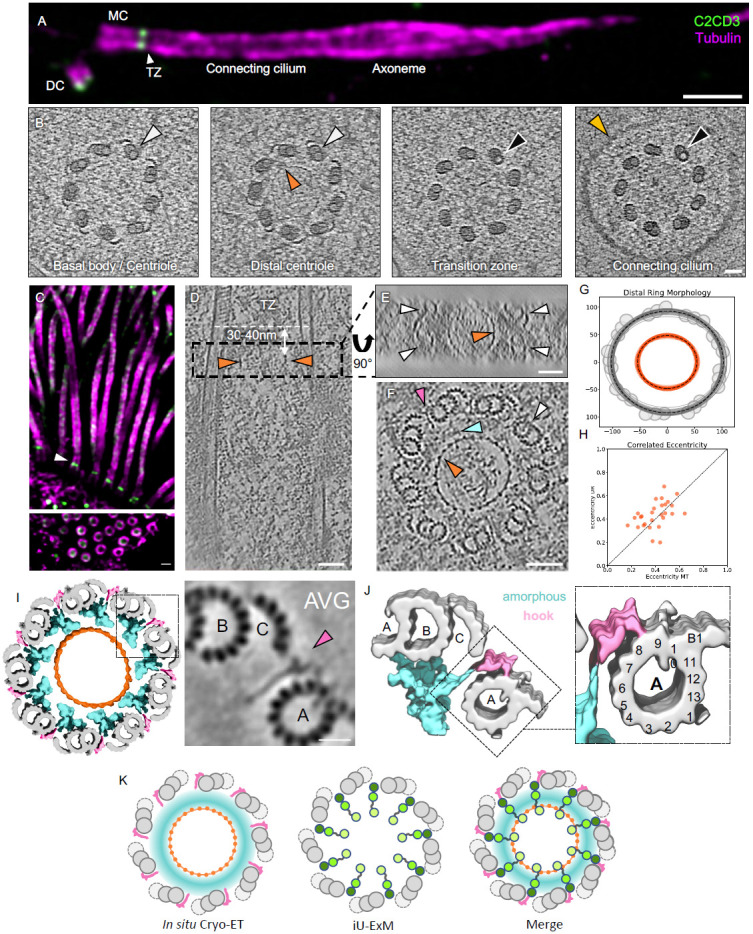
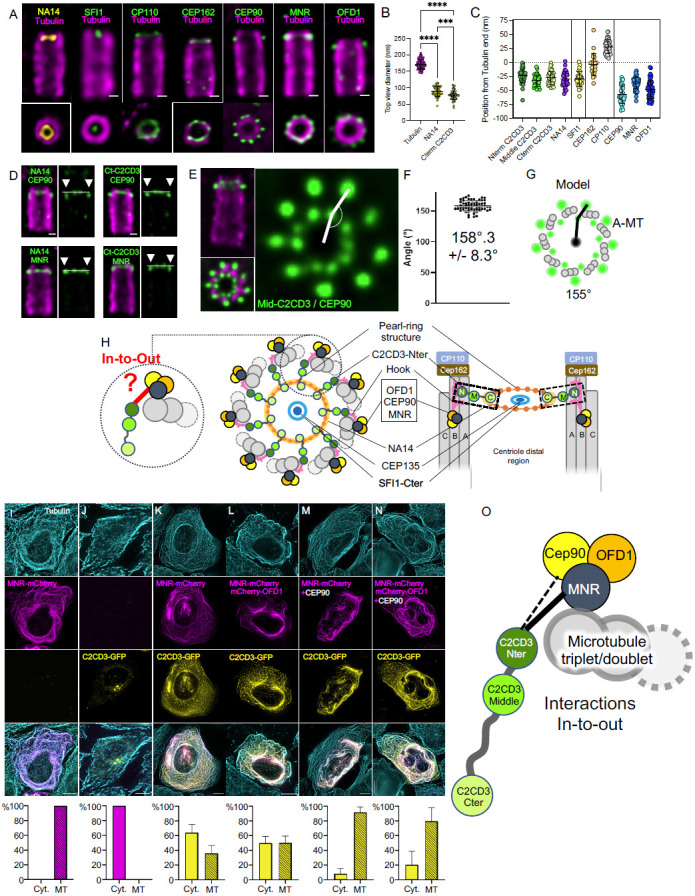
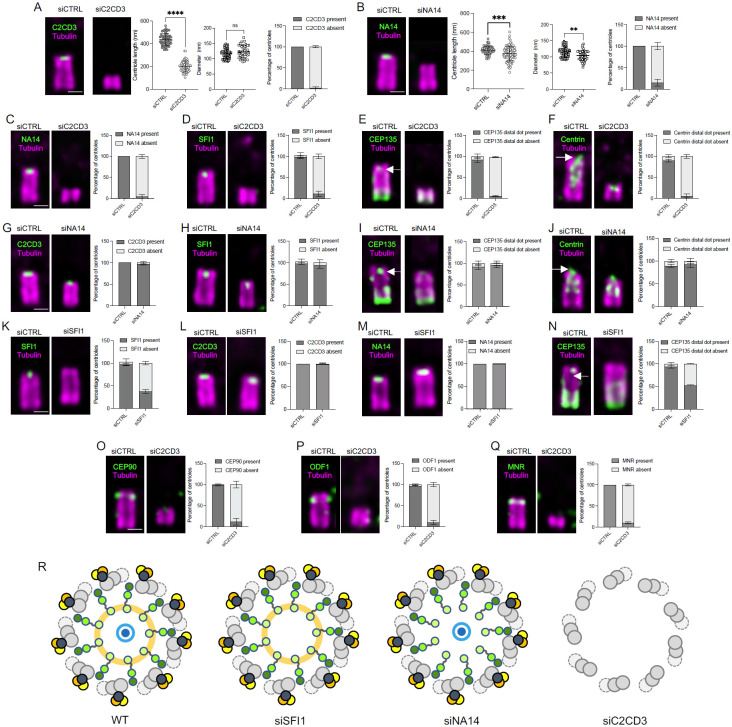
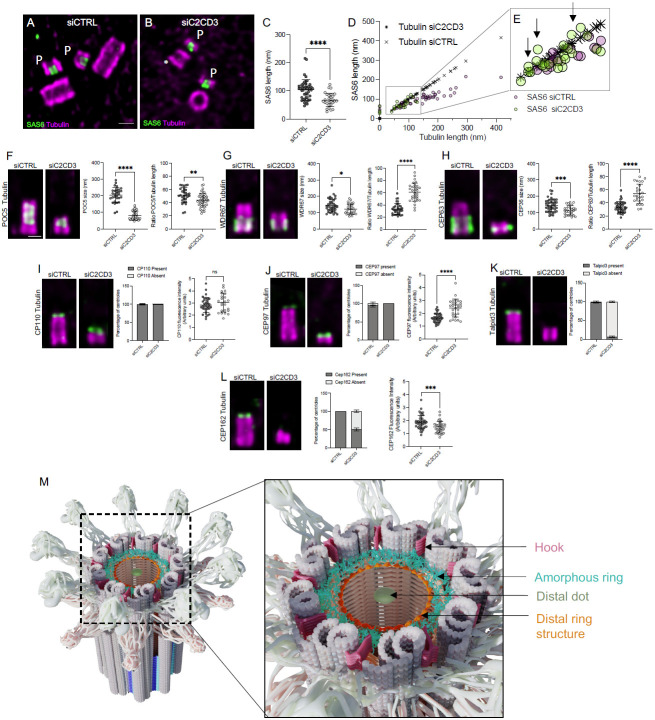
Centrioles are polarized microtubule-based structures with appendages at their distal end that are essential for cilia formation and function. The protein C2CD3 is critical for distal appendage assembly, with mutations linked to orofaciodigital syndrome and other ciliopathies. However, its precise molecular role in appendage recruitment remains unclear. Using Ultrastructure Expansion Microscopy (U-ExM), iterative U-ExM, and in situ cryo-electron tomography (cryo-ET), we reveal that C2CD3 adopts a radially symmetric 9-fold organization within the centriole's distal lumen. We show that the C-terminal region of C2CD3 localizes close to a ~100 nm luminal ring structure consisting of ~27 nodes, while its N-terminal region localizes close to a hook-like structure that attaches to the A-microtubule as it extends from the centriole interior to exterior. This hook structure is adjacent to the DISCO complex (MNR/CEP90/OFD1), which marks future appendage sites. C2CD3 depletion disrupts not only the recruitment of the DISCO complex via direct interaction with MNR but also destabilizes the luminal ring network composed of C2CD3/SFI1/centrin-2/CEP135/NA14, as well as the distal microtubule tip protein CEP162. This reveals an intricate "in-to-out" molecular hub connecting the centriolar lumen, distal microtubule cap, and appendages. Although C2CD3 loss results in shorter centrioles and appendage defects, key structural elements remain intact, permitting continued centriole duplication. We propose that C2CD3 forms the luminal ring structure and extends radially to the space between triplet microtubules, functioning as an architectural hub that scaffolds the distal end of the centriole, orchestrating its assembly and directing appendage formation.

Keywords: C2CD3; appendages; centriole; expansion microscopy; in situ cryo-ET; luminal distal ring.


Conflict of interest statement

Conflict of interest The authors declare no competing interests.

Figures

Figure 1.
Figure 1.. C2CD3 exhibits nine-fold radial symmetry and distal localization in centrioles.
(A) Schematic of the C2CD3 protein showing its domain architecture and the epitopes recognized by three antibodies targeting the N-terminal, middle, and C-terminal regions. (B–D) Confocal images of expanded U2OS centrioles stained for α/β-tubulin (magenta) and C2CD3 (green) using antibodies against the N-terminal (B), middle (C), and C-terminal (D) epitopes. Right panels: top-down views along the centriole axis, showing C2CD3 localization within the distal region (d, distal; c, core; p, proximal). Scale bars: 100 nm. (E) Quantification of the axial positioning of C2CD3 relative to the distal tubulin signal (dotted magenta line). Mean ± SD: N-terminal, −24 ± 12 nm (n = 42); middle, −33 ± 10 nm (n = 37); C-terminal, −30 ± 10 nm (n = 33). Data from three independent experiments. Statistical analysis: two-way ANOVA (N-term vs. middle, P = 0.0082; N-term vs. C-term, ns P = 0.1376; middle vs. C-term, ns P = 0.5671). (F) Normalized diameters of C2CD3 signals relative to tubulin. Mean ± SD: tubulin, 165 ± 13 nm (n = 45); N-terminal, 138 ± 13 nm (n = 11); middle, 122 ± 13 nm (n = 17); C-terminal, 74 ± 14 nm (n = 17). Two-way ANOVA: ***P < 0.0001 for all pairwise comparisons (N-term vs. middle, N-term vs. C-term, middle vs. C-term). Data from three independent experiments. (G, I, K) Widefield (G, I) and confocal (K) images of iteratively expanded human centrioles stained for tubulin (magenta) and C2CD3 (green), using N-terminal (G), middle (I), or C-terminal (K) antibodies. Side and top views are shown. Scale bars: 50 nm. (H, J, K) Top panels: cropped top-view images from (G) and (I). Bottom panels: line profiles of tubulin and C2CD3 intensity (N-terminal in H; middle in J), showing C2CD3 localization between microtubule triplets. (L) Symmetrized top view of N-terminal C2CD3 distribution in iU-ExM. (M) Intensity profile of tubulin and N-terminal C2CD3 after symmetrization. (O) Model illustrating the spatial organization of C2CD3 within the distal lumen of the centriole.
Figure 2.
Figure 2.. C2CD3 localizes to a ring structure observed in the lumen of the distal centriole by in situ cryo-electron tomography.
(A) Confocal image of an expanded mouse photoreceptor cell immunolabeled for tubulin (magenta) and C2CD3 (green). DC, daughter centriole; BB, basal body; TZ, transition zone; CC, connecting cilium. Scale bar: 500 nm. (B) In situ cryo-tomogram slices taken along the longitudinal axis of the centriole and connecting cilium. White arrowheads indicate microtubule triplets, black arrowheads indicate microtubule doublets, orange arrowheads mark the luminal ring structure, and yellow highlights the membrane. Scale bar: 50 nm. (C) Confocal image of an expanded mouse tracheal epithelial cell (MTEC) labeled for tubulin (magenta) and C2CD3 (middle epitope, green). Scale bar: 200 nm. (D) Longitudinal cryo-tomogram slice of a basal body from a mouse tracheal cell. Orange arrowheads mark the edges of the luminal ring structure, seen in cross-section. Scale bar: 50 nm. (E) 90° rotated top view of the boxed region in (D), showing the ring structure (orange arrowhead) encircled by the microtubule triplets (white arrowheads). Scale bar: 50 nm. (F) Top-view cryo-tomogram slice of the distal end of a basal body, highlighting the microtubule triplets (white arrowhead), ring structure (orange arrowhead), amorphous density between the ring and microtubules (blue arrowhead), and a distinct hook-like structure between the microtubule blades (pink arrowhead). Scale bar: 50 nm. (G) Cross-section analysis of the centriole and ring diameter. Individual ring structures are plotted in orange, microtubule walls are plotted in grey. Average diameters are plotted in dashed black lines. (H) Eccentricity of the distal ring (DR) structure is correlated with eccentricity of the surrounding microtubule (MT) wall. (I) 3D reconstruction of the distal centriole using subtomogram averaging of the hook-like structure region (Figure S3D) and the ring structure region (Figure S3E). Hook structure is shown in pink; microtubule triplets in grey; surrounding amorphous density in cyan. (J) 3D surface rendering of the subtomogram average from (I), showing the hook interacting between protofilaments A8 and A9 of the A-microtubule. (K) Proposed model integrating in situ cryo-ET and iU-ExM data, suggesting that C2CD3 is a structural component of the distal ring and radially extending to hook-like densities.
Figure 3.
Figure 3.. C2CD3 forms a distal in-to-out connection that bridges the centriole lumen to the DISCO complex.
(A) Confocal images of expanded U2OS centrioles immunolabeled for tubulin (magenta), NA14 (yellow), and one of the following proteins (green): SFI1, CP110, CEP162, CEP90, MNR, or OFD1. Bottom panels show corresponding top views. Scale bar: 100 nm. (B) Quantification of top-view diameters for distal centriolar components: tubulin (n = 15, 180 ± 18 nm), NA14 (n = 12, 88 ± 15 nm), and C-terminal C2CD3 (n = 18, 76 ± 14 nm). Data from three independent experiments. (C) Axial positions of centriolar proteins relative to the distal tubulin signal: N-term C2CD3: n=42, −24 ± 12 nm; Middle C2CD3:n= 37 −32 ± 10 nm; C-term C2CD3: n=33, −30 ± 10 nm; NA14: n=36, −30 ± 13 nm; SFI1: n=32, −30 ± 13 nm; CEP162: n=24, −4 ± 19 nm; CP110: n=46, 28 ± 12 nm; CEP90: n=36, −56 ± 17 nm; MNR: n=54, −37 ± 11 nm; OFD1: n=46, −48 ± 16 nm. Data from three independent experiments. (D) Confocal images of expanded U2OS centrioles co-stained for tubulin (magenta) and dual-labeled (green) for CEP90–NA14, C-terminal C2CD3–CEP90, NA14–MNR, or C-terminal C2CD3–MNR. Right panels highlight the relatively proximal localization of CEP90 (white arrows). Scale bar: 100 nm. (E) iU-ExM image of centrioles stained for tubulin (magenta), middle C2CD3, and CEP90 (green), used for angle measurement (white lines). Scale bar: 100 nm. (F) Measured angles from (E). From 111 angles and 3 independent experiments. Average: 158°3 +/− 8.3. (G) Schematic depicting CEP90 localization on the A-microtubule, consistent with observed angles. (H) Integrative model of distal centriole architecture: C2CD3 (green), NA14 (mustard), DISCO complex (black/yellow/orange), SFI1-C (orange), and Cep135 (dark blue), highlighting the proximity between C2CD3 and the DISCO complex. ( (I-N) Microtubule displacement assay with percentage of GFP/mCherry positive cells with proteins localized to cytosol (Cyt.) or microtubules (MT) for each condition. U2OS cells were transfected with (I) MNR-mCherry (Cyt.: 0; MT: 100), (J) C2CD3-GFP (Cyt.: 100; MT: 0), (K) C2CD3-GFP and MNR-mCherry (Cyt.: 64.23 ± 11.02), (L) C2CD3-GFP, MNR-mCherry and mCherry-OFD1 (Cyt.: 49.83 ± 9.33; MT: 50.17 ± 9.33), (M) C2CD3-GFP, MNR-mCherry and CEP90 (Cyt.: 8.254 ± 7.211; MT: 91.75 ± 7.211), N) C2CD3-GFP, MNR-mCherry, mCherry-OFD1 and CEP90 (Cyt.: 20.40 ± 18.32; MT: 79.60 ± 18.32). Note that C2CD3 co-transfection with MNR alone or in combination with OFD1 is not sufficient to completely drive its relocalization on MTs. C2CD3 is relocalized on MNR decorated microtubules most efficiently in combination with CEP90 and/or CEP90 and OFD1. Scale bar: 10 μm. From three independent experiments performed for each condition. (O) Model illustrating how C2CD3 extends between the microtubule triplets to connect with the DISCO complex.
Figure 4.
Figure 4.. C2CD3 is crucial for the localization of the LDR and DISCO complexes.
(A) Expanded centrioles from control (siCTRL) and C2CD3-depleted (siC2CD3) cells stained for C2CD3 (green) and tubulin (magenta). Centriole length is significantly reduced in siC2CD3 (n=61, 200 ± 48 nm) compared to siCTRL (n=63, 437 ± 52 nm); ****P<0.0001, unpaired t-test, 4 experiments. Centriole diameter was not significantly altered (siCTRL: n=43, 115 ± 16 nm; siC2CD3: n=61, 123 ± 20 nm; P=0.0564). C2CD3 depletion efficiency: C2CD3-positive centrioles: siCTRL = 99.5% ± 1; siC2CD3 = 2.24% ± 2.66 (n=4 experiments, 30 centrioles/experiment). (B) Expanded centrioles from siCTRL and NA14-depleted (siNA14) cells stained for NA14 (green) and tubulin (magenta). Centriole length is modestly reduced (siNA14: n=96, 373 ± 85 nm; siCTRL: n=57, 413 ± 69 nm; ***P=0.004). Diameter is also decreased (siNA14: n=36, 101 ± 17 nm; siCTRL: n=44, 113 ± 16 nm; **P=0.0041). NA14-positive centrioles: siCTRL = 100% ± 0; siNA14 = 15.38% ± 7.94 (n=4 experiments). (C-F) Quantification of NA14, SFI1, CEP135 distal dot, and Centrin distal dot signals at centrioles in siCTRL and siC2CD3 cells. Percentage of NA14-positive and NA14-negative centriole. For NA14-positive centrioles: siCTRL = 100% ± 0, siC2CD3 =4.03% ± 4.98. N = 4 independent experiment (30 centrioles per experiment). Percentage of SFI1-positive and SFI1-negative centriole. For SFI1-positive centrioles: siCTRL = 97.91% ± 2.50, siC2CD3 =11.48% ± 5.77. N = 3 independent experiment (30 centrioles per experiment). Percentage of CEP135 distal dot-positive and CEP135 distal dot-negative centriole. For CEP135 distal dot positive centrioles: siCTRL = 91.31% ± 5.20, siC2CD3 =5.91% ± 1.43. N = 3 independent experiment (30 centrioles per experiment). Percentage of Centrin distal dot-positive and Centrin distal dot-negative centriole. For Centrin distal dot positive centrioles: siCTRL = 89.48% ± 3.35, siC2CD3 =3.35% ± 4.57. N = 4 independent experiment (30 centrioles per experiment). (G-J) Quantification of C2CD3, SFI1, CEP135 distal dot, and Centrin distal dot signals in siCTRL and siNA14 cells. Percentage of C2CD3-positive and C2CD3-negative centriole. For C2CD3-positive centrioles: siCTRL = 100% ± 0, siNA14 =97% ± 2.64. N = 3 independent experiment (30 centrioles per experiment). Percentage of SFI1-positive and SFI1-negative centriole. For SFI1-positive centrioles: siCTRL = 97.91% ± 2.50, siNA14 =93.6% ± 6.25. N = 3 independent experiment (30 centrioles per experiment). Percentage of CEP135 distal dot-positive and CEP135 distal dot-negative centriole. For CEP135 distal dot positive centrioles: siCTRL = 91.31% ± 5.20, siNA14 =95% ± 5.57. N = 3 independent experiment (30 centrioles per experiment). Percentage of Centrin distal dot-positive and Centrin distal dot-negative centriole. For Centrin distal dot positive centrioles: siCTRL = 89.48% ± 3.35, siNA14 =92.15% ± 6.08. N = 3 independent experiment (30 centrioles per experiment) (K-N) Quantification of SFI1, C2CD3, NA14, and CEP135 signals in siCTRL and siSFI1 cells. Percentage of SFI1-positive and SFI1-negative centriole. For SFI1-positive centrioles: siCTRL = 97.22% ± 2.54, siSFI1 =37.33% ± 4,07. N = 3 independent experiment (30 centrioles per experiment). Percentage of C2CD3-positive and C2CD3-negative centriole. For C2CD3-positive centrioles: siCTRL = 100% ± 0, siSFI1 =98.83% ± 2.02. N = 3 independent experiment (30 centrioles per experiment). Percentage of NA14-positive and NA14-negative centriole. For NA14-positive centrioles: siCTRL = 100% ± 0, siSFI1 =99.67% ± 0.57. N = 3 independent experiment (30 centrioles per experiment). Percentage of CEP135 distal dot-positive and CEP135 distal dot-negative centriole. For CEP135 distal dot positive centrioles: siCTRL = 93.65% ± 2.78, siSFI1 =52.42% ± 0.76. N = 3 independent experiment (30 centrioles per experiment). (O-Q) Quantification of CEP90, OFD1, and MNR signals at centrioles in siCTRL and siC2CD3 cells. Percentage of CEP90-positive and CEP90-negative centriole. For CEP90-positive centrioles: siCTRL = 98.47% ± 1.36, siC2CD3 =11.8% ± 8.07. N = 3 independent experiment (30 centrioles per experiment). Percentage of OFD1-positive and OFD1-negative centriole. For OFD1-positive centrioles: siCTRL = 96.73% ± 1.20, siC2CD3 =10.32% ± 4.94. N = 3 independent experiment (30 centrioles per experiment). Percentage of MNR-positive and MNR-negative centriole. For MNR-positive centrioles: siCTRL = 100% ± 0, siC2CD3 =10% ± 2.19. N = 3 independent experiment (30 centrioles per experiment). (R) Schematic model summarizing the dependency of distal centriolar components on C2CD3. All centrioles are stained for tubulin (magenta) and the indicated protein (green). Scale bars: 100 nm.
Figure 5.
Figure 5.. C2CD3 regulates spatial organization of centriole architecture.
(A–B) Expanded U2OS centrioles treated with siCTRL or siC2CD3, stained for α/β-tubulin (magenta) and Hs-SAS6 (green); P = procentrioles, * = C2CD3-depleted. Scale bars: 100 nm. (C) SAS6 length is significantly reduced in siC2CD3 (n=28, 68 ± 25 nm) vs. siCTRL (n=45, 104 ± 36 nm), ****P<0.0001. (D–E) Correlation of SAS6 and tubulin lengths. In SiC2CD3 the cartwheel length often exceeds tubulin length (back arrows). (F) Expanded centrioles stained for α/β-tubulin and the inner scaffold protein POC5. POC5 length: siC2CD3 (n=43, 80 ± 26 nm) vs. siCTRL (n=30, 204 ± 46 nm), ****P<0.0001. POC5-Tubulin length ratio of expanded centrioles in siCTRL (dark grey, n=30 centrioles; 51 +/− 11 nm) and siC2CD3 (light grey, n=42, 43 +/− 10 nm). Unpaired t-test ** P value =0.0030. (G) WDR67 localization in expanded centrioles. WDR67 length: siC2CD3 (n=31, 122 ± 31 nm) vs. siCTRL (n=35, 145 ± 40 nm), *P=0.0128. WDR67-Tubulin length ratio of expanded centrioles in siCTRL (dark grey, n=35, 53 +/− 9 nm) and siC2CD3 (light grey, n=31, 61 +/− 15 nm.). Unpaired t-test **** P value <0.0001. (H) CEP63 localization in expanded centrioles. CEP63 length: reduced in siC2CD3 (n=30, 114 ±29 nm) vs. siCTRL (n=41, 144 ± 39nm), ***P=0.0008. CEP63-Tubulin length ratio of expanded centrioles in siCTRL (dark grey, n=41, 32 +/− 8 nm) and siC2CD3 (light grey, n=30, 54 +/− 15 nm). Unpaired t-test **** P value <0.0001). (I) CP110 localization in expanded centrioles and quantification. Percentage of CP110-positive and CP110-negative centriole. For CP110-positive centrioles: siCTRL = 99.33% ± 1.15, siC2CD3 =99.67% ± 0.58. CP110 intensity doesn’t increase in siC2CD3 (n=25, 3.02±0.77 AU) vs. siCTRL (n=35, 2.84 ± 0.62 AU), **P=0.0025. (J) CEP97 localization in expanded centrioles and quantification. For CEP97-positive centrioles: siCTRL = 95.47% ± 4.55, siC2CD3 =100% ± 0. CEP97 fluorescence increased in siC2CD3 (n=25, 2.42 ± 0.68AU) vs. siCTRL (n=38, 1.68 ± 0.35 AU), ****P<0.0001. (K) TALPID3 localization in expanded centrioles and quantification. For TALPID3-positive centrioles: siCTRL = 98.3% ± 1.57, siC2CD3 =6.95% ± 2.09. TALPID3 is lost in siC2CD3 vs. siCTRL. (L) CEP162 localization in expanded centrioles and quantification. Half of the centrioles lacked detectable CEP162. For CEP162-positive centrioles: siCTRL = 100% ± 0, siC2CD3 =50.83% ± 4.31. Overall CEP162 fluorescence decreased in siC2CD3 (n=45, 1.40 +/− 0.36 AU.) vs. siCTRL (n=35, 1.89+/− 0.47 AU), unpaired t-test *** P value =0.0008. (M) Model of the architecture of the distal region of the human centriole. All data are from three independent experiments unless stated otherwise.

Similar articles

  • Short-Term Memory Impairment.
    Cascella M, Al Khalili Y. Cascella M, et al. 2024 Jun 8. In: StatPearls [Internet]. Treasure Island (FL): StatPearls Publishing; 2025 Jan–. 2024 Jun 8. In: StatPearls [Internet]. Treasure Island (FL): StatPearls Publishing; 2025 Jan–. PMID: 31424720 Free Books & Documents.
  • Systemic Inflammatory Response Syndrome.
    Baddam S, Burns B. Baddam S, et al. 2025 Jun 20. In: StatPearls [Internet]. Treasure Island (FL): StatPearls Publishing; 2025 Jan–. 2025 Jun 20. In: StatPearls [Internet]. Treasure Island (FL): StatPearls Publishing; 2025 Jan–. PMID: 31613449 Free Books & Documents.
  • Coordinated roles of the CEP164 homodimer and TTBK2 are required for recruitment of the IFT machinery to the mother centriole for ciliogenesis.
    Mori K, Yamazaki S, Yoshida K, Shirota R, Chiba S, Shin HW, Katoh Y, Nakayama K. Mori K, et al. Mol Biol Cell. 2025 Jul 1;36(7):ar79. doi: 10.1091/mbc.E24-12-0536. Epub 2025 Apr 30. Mol Biol Cell. 2025. PMID: 40305080
  • Management of urinary stones by experts in stone disease (ESD 2025).
    Papatsoris A, Geavlete B, Radavoi GD, Alameedee M, Almusafer M, Ather MH, Budia A, Cumpanas AA, Kiremi MC, Dellis A, Elhowairis M, Galán-Llopis JA, Geavlete P, Guimerà Garcia J, Isern B, Jinga V, Lopez JM, Mainez JA, Mitsogiannis I, Mora Christian J, Moussa M, Multescu R, Oguz Acar Y, Petkova K, Piñero A, Popov E, Ramos Cebrian M, Rascu S, Siener R, Sountoulides P, Stamatelou K, Syed J, Trinchieri A. Papatsoris A, et al. Arch Ital Urol Androl. 2025 Jun 30;97(2):14085. doi: 10.4081/aiua.2025.14085. Epub 2025 Jun 30. Arch Ital Urol Androl. 2025. PMID: 40583613 Review.
  • The Black Book of Psychotropic Dosing and Monitoring.
    DeBattista C, Schatzberg AF. DeBattista C, et al. Psychopharmacol Bull. 2024 Jul 8;54(3):8-59. Psychopharmacol Bull. 2024. PMID: 38993656 Free PMC article. Review.

References

    1. Yoshiba S, Tsuchiya Y, Ohta M, Gupta A, Shiratsuchi G, Nozaki Y, et al. HsSAS-6-dependent cartwheel assembly ensures stabilization of centriole intermediates. J Cell Sci. 2019;132. doi: 10.1242/jcs.217521 - DOI - PubMed
    1. Strnad P, Leidel S, Vinogradova T, Euteneuer U, Khodjakov A, Gönczy P. Regulated HsSAS-6 levels ensure formation of a single procentriole per centriole during the centrosome duplication cycle. Dev Cell. 2007;13: 203–213. - PMC - PubMed
    1. Leidel S, Delattre M, Cerutti L, Baumer K, Gönczy P. SAS-6 defines a protein family required for centrosome duplication in C. elegans and in human cells. Nat Cell Biol. 2005;7: 115–25. doi: 10.1038/ncb1220 - DOI - PubMed
    1. Kitagawa D, Vakonakis I, Olieric N, Hilbert M, Keller D, Olieric V, et al. Structural Basis of the 9-Fold Symmetry of Centrioles. Cell. 2011;144: 1–12. doi: 10.1016/j.cell.2011.01.008 - DOI - PMC - PubMed
    1. van Breugel M, Hirono M, Andreeva A, Yanagisawa H-A, Yamaguchi S, Nakazawa Y, et al. Structures of SAS-6 suggest its organization in centrioles. Science. 2011;331: 1196–9. doi: 10.1126/science.1199325 - DOI - PubMed

Publication types

LinkOut - more resources