[Preprint]. 2025 Jun 17:2025.06.11.659129.
doi: 10.1101/2025.06.11.659129.

Klotho deficiency promotes skeletal muscle weakness and is associated with impaired motor unit connectivity

Affiliations

Klotho deficiency promotes skeletal muscle weakness and is associated with impaired motor unit connectivity

Linda A Bean et al. bioRxiv. .

Update in

Abstract

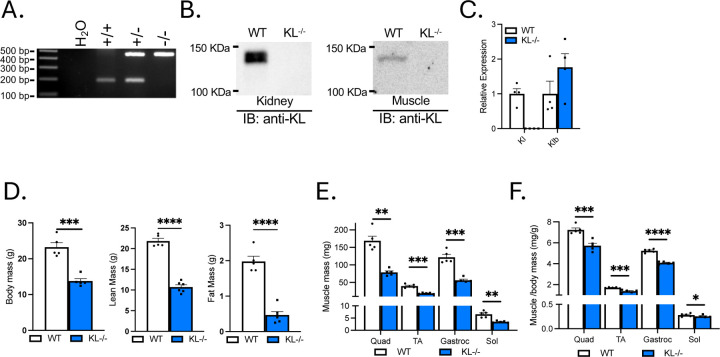
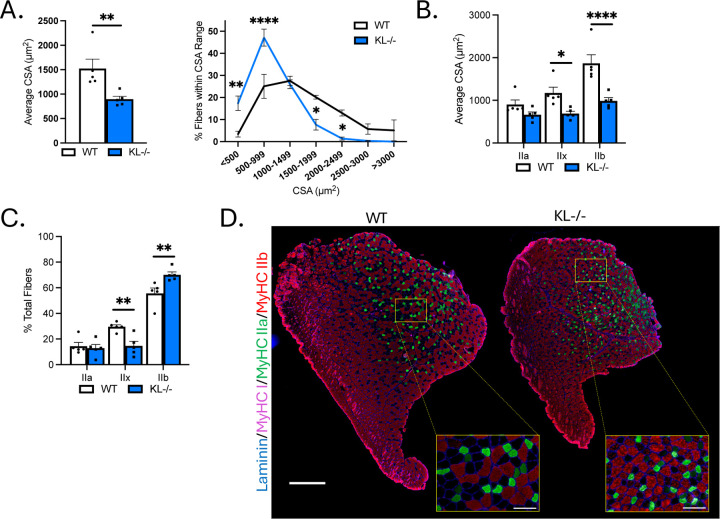
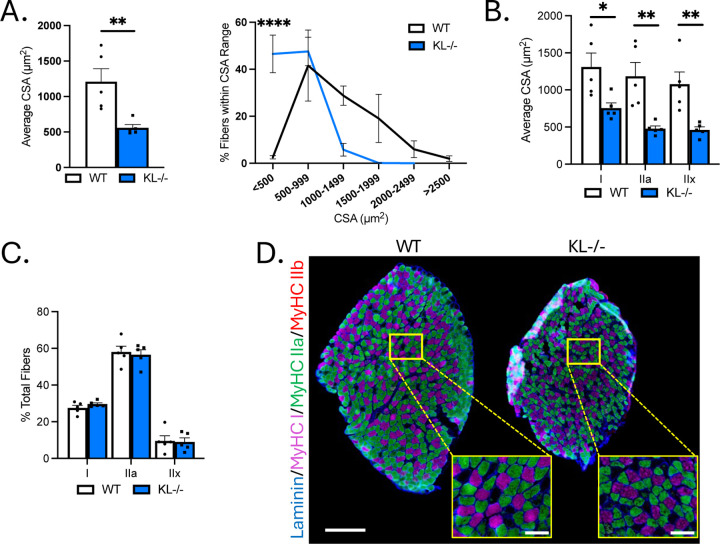
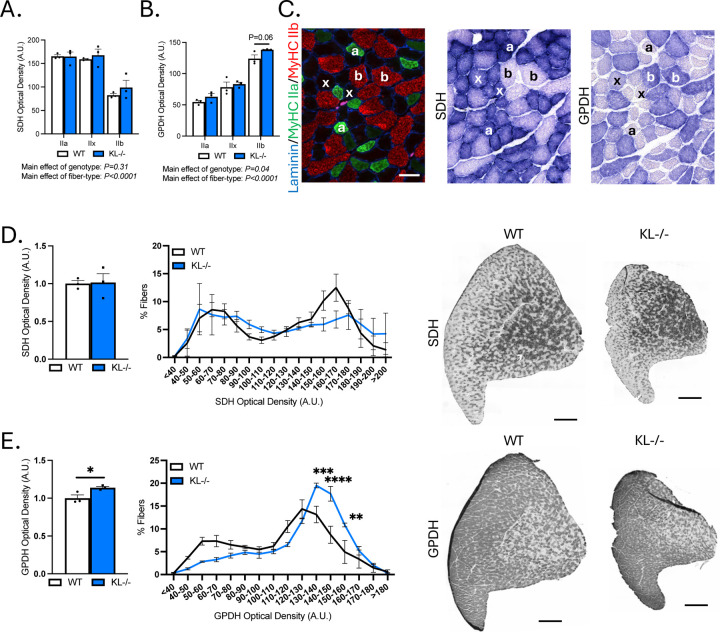
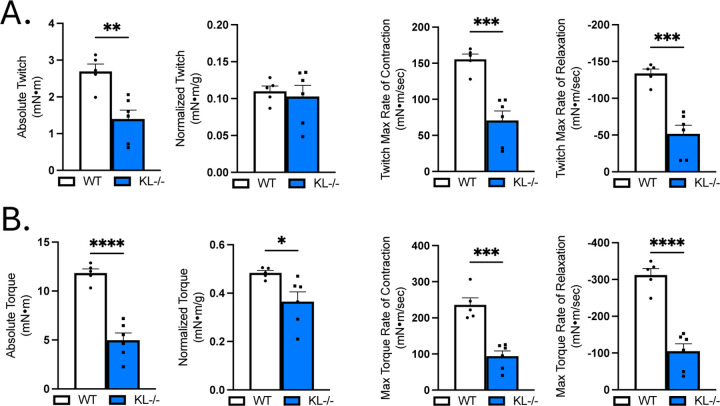
Muscle wasting and weakness are important clinical problems that impact quality of life and health span by restricting mobility and independence, and by increasing the risk for physical disability. The molecular basis for this has not been fully determined. Klotho expression is downregulated in conditions associated with muscle wasting, including aging, chronic kidney disease, and myopathy. The objective of this study was to investigate a mechanistic role for Klotho in regulating muscle wasting and weakness. Body weight, lean mass, muscle mass, and myofiber caliber were reduced in Klotho-deficient mice. In the tibialis anterior muscle of Klotho null mice, type IIa myofibers were resistant to changes in size, and muscle composition differed with a higher concentration of type IIb fibers to the detriment of type IIx fibers. Glycolytic enzymatic activity also increased. The composition of the soleus muscle was unaffected and myofiber caliber was reduced comparably in type I, IIa, and IIx fibers. Muscle contractile function declined in Klotho-deficient mice, as evidenced by reduced absolute twitch and torque, and decreased rates of contraction and relaxation. RNA-sequencing analysis identified increased transcriptional expression of synaptic and fetal sarcomeric genes, which prompted us to test effects on muscle innervation. Klotho-deficiency induced morphological remodeling of the neuromuscular junction, myofiber denervation, and a functional loss of motor units. Loss of motor units correlated with absolute torque. Collectively, our findings have uncovered a novel mechanism through which Klotho-deficiency leads to alterations to the muscle synapse affecting motor unit connectivity that likely influences muscle wasting and weakness.

Keywords: Klotho; Muscle wasting; motor unit; skeletal muscle; wasting.


Conflict of interest statement

Disclosures The authors have declared that no conflict of interest exists.

Figures

Figure 1:
Figure 1:
Klotho-deficient mice have reduced body mass, lean mass, fat mass, and muscle mass. (A) Representative image of wild-type (186 bp) and mutant (426 bp) PCR products from wild-type, heterozygous, and homozygous mice distinguish genotype. (B) Immunoblot confirms no detectable Klotho expression in kidney or muscle lysates of KL−/− mice. (C) qRT-PCR assays show Kl mRNA expression is not detectable and Klb mRNA expression was normal in KL−/− muscle lysates. N = 4 per group. (D) Body mass and body composition was assessed by Echo-MRI showing decreased lean mass and fat mass in KL−/− mice. Muscle mass (E) and muscle mass normalized to body mass (F) of quadriceps (quad), tibialis anterior (TA), gastrocnemius (gastroc), and soleus (sol) in wild-type and KL−/− mice. N = 5–6 per group. Data are presented as mean ± SEM. All P values are based on two-tailed t test. *P<0.05, **P<0.01, ***P<0.001, ****P<0.0001 versus wild-type.
Figure 2:
Figure 2:
Genetic Klotho deficiency reduces muscle fiber size and affects fiber-type composition in TA muscles. (A) Left: Mean muscle fiber cross-sectional area (CSA). P value based on two-tailed t test. Right: frequency distribution of muscle fiber size by CSA. (B) Quantification of muscle fiber CSA by fiber-type in TA muscles from wild-type and KL−/− mice. (C) Quantification of TA muscle composition by fiber-type. (D) Representative montages of whole TA cross-section from wild-type (left) and KL−/− (right) mice immunolabeled with antibodies to laminin (blue), myosin heavy chain type (MyHC) I (magenta), MyHC IIa (green), MyHC IIb (red), and MyHC IIx unlabeled (black). Montage bar = 500 μm. Inset bar = 100 μm. N = 5 per group. Unless otherwise indicated, P values are based on two-way ANOVA with Sidak multiple comparison test (B-D, G-I). *P<0.05, **P<0.01, ****P<0.00001 versus wild-type.
Figure 3:
Figure 3:
Genetic Klotho deficiency reduces muscle fiber size in soleus muscles. (A) Left: Mean muscle fiber cross-sectional area (CSA). P value based on two-tailed t test. Right: frequency distribution of muscle fiber size by CSA. (B) Quantification of muscle fiber CSA by fiber-type in soleus muscles from wild-type and KL−/− mice. (C) Quantification of soleus muscle composition by fiber-type. (D) Representative montages of whole soleus muscle cross-section from wild-type (left) and KL−/− (right) mice immunolabeled with antibodies to laminin (blue), myosin heavy chain type (MyHC) I (magenta), MyHC IIa (green), MyHC IIb (red), and MyHC IIx unlabeled (black). Montage bar = 250 μm. Inset bar = 50 μm. N = 5 per group. Unless otherwise indicated, P values are based on two-way ANOVA with Sidak multiple comparison test (B-D, G-I). *P<0.05, **P<0.01, ****P<0.00001 versus wild-type.
Figure 4:
Figure 4:
Genetic ablation of Klotho increases glycolytic GPDH enzymatic activity in TA muscles. (A-C) Serial cryosections of TA muscles immunolabeled for MyHC isoforms or succinate dehydrogenase (SDH) or glycerol-3-phosphate-dehydrogenase (GPDH) enzyme histochemistry. Quantification of SDH (A) and GPDH (B) optical density by fiber-type. P values based on two-way ANOVA with Tukey’s multiple comparison test. (C) Representative images of the same region of TA cross-sections. Left: Cross-sections immunolabeled for laminin (blue), MyHC1 (magenta), MyHC2a (green), MyHC2b (red), and MyHC2x unlabeled (black). Middle: SDH enzyme histochemistry. Right: GPDH enzyme histochemistry. Symbols indicate: a = type IIa, x = type IIx, and b = type IIb fiber-types across images. Bar = 50 μm (D) Left: Mean SDH enzyme activity. P value based on two-tailed t test. Middle: Frequency distribution SDH activity independent of fiber-type. Right: Representative images of SDH activity in whole TA montages from wild-type and KL−/− mice in gray-scale. Montage bar = 500 μm. (E) Left: Mean GPDH enzyme activity. P value based on two-tailed t test. Middle: Frequency distribution GPDH activity independent of fiber-type. P values based on two-way ANOVA with Sidak multiple comparison test. Right: Representative images of GPDH enzyme histochemistry of whole TA cross-section montages from wild-type and KL−/− mice in gray-scale. Montage bar = 500 μm. N = 3 per group. *P<0.05, **P<0.01, ***P<0.001, ****P<0.00001 versus wild-type.
Figure 5:
Figure 5:
RNA-sequencing analysis shows distinct gene expression profiles in skeletal muscles from Klotho-deficient mice. (A) Multi-dimensional scaling plot comparing TA muscles from wild-type and KL−/− mice. (B) A volcano plot highlighting selected differentially expressed genes (DEGs). Increased expression (red) and decreased expression (blue) in KL−/− muscles. Colored dots = abs(log20.5) fold change with FDR<0.05. (C) A heatmap of samples showing select DEGs in WT and KL−/− muscles. Positive (red) and negative (blue) Z-score. (D) qRT-PCR assays validating differential expression of selected sarcomeric (top), inflammatory and pro-fibrotic (bottom left), and acetylcholine receptor and neurotrophic genes (bottom right). (E) Dot plot depicting activated (left) and suppressed (right) GO of Biological Process terms in KL−/− muscles. (F) Ridgeline plot, grouped by gene set, representing activated and suppressed KEGG pathways in KL−/− muscles. N = 4 per group.
Figure 6:
Figure 6:
Muscle contractile function is impaired in Klotho-deficient mice. In vivo plantar flexion force assessment of the triceps surae muscle group in WT and KL−/− mice reported as: (A) absolute twitch (mN·m), twitch normalized to body weight (mN·m per g body weight), twitch max rate of contraction and relaxation; (B) absolute torque (mN·m), tetanic torque normalized to body weight (mN·m per g body weight), max torque rate of contraction and relaxation. N = 5–6 per group. All P values are based on two-tailed t test. *P<0.05, **P<0.01, ***P<0.001, ****P<0.0001
Figure 7:
Figure 7:
Genetic Klotho-deficiency alters single motor unit potential (SMUP) and motor unit number estimation (MUNE). (A) Compound muscle action potential (CMAP; millivolts (mV)). (B) SMUP (microvolts (μV)). (C) MUNE (number of motor units (#). (D) In vivo plantar flexion absolute torque correlated with MUNE. N = 5–6 per group. All P values are based on two-tailed t test (A-C) or correlation analysis for Pearson r value. **P<0.01.
Figure 8:
Figure 8:
Genetic ablation of Klotho increases concentration of denervated muscle fibers, reduced synaptic contact, and alters NMJ morphology. (A) Myonuclei number per muscle fiber. N=5/group. Representative image of muscle cross-section immunolabeled with dystrophin and stained with DAPI to visualize nuclei for quantification of myonuclei. Arrow = myonuclei. Arrowhead = interstitial nuclei. Bar = 20 μm. (B) Serum creatine kinase (CK) levels. N=5/group. (C) Quantification of the percentage of muscle fibers with centrally located nuclei to total muscle fibers. N=5/group. Representative image of muscle cross-section immunolabeled with dystrophin and stained with DAPI to quantify centrally nucleated fibers. Arrow = centrally nucleated myofiber. Bar = 50 μm. (D) Quantification of the proportion of denervated muscle fibers expressing NCAM. N=5/group. Representative images of muscle sections immunolabeled with dystrophin (red) and NCAM (green) from wild-type (left) and KL−/− mice (right). Arrowhead = NMJ with high expression of NCAM. Arrow = small angulated denervated fiber with high cytosolic expression of NCAM. Bar = 50 μm. (E) Quantification of NMJ morphological properties of longitudinal sections of TA muscles from wild-type and and KL−/− mice. Percent co-localization of synaptic vesicles and AChRs; post-synaptic NMJ morphology endplate area, AChR area, compactness (AChR area/endplate area), and number of AChR fragments; and pre-synaptic NMJ morphology axon diameter, nerve terminal area, number of terminal branches, and branch points. In dispersion plots, each point represents a single NMJ from n=5 wild-type and n=6 KL−/− biological replicates, n=6–15 en-face NMJs quantified per biological replicate. F) Representative images of longitudinally cut TA muscle sections from wild-type (top) and KL−/− mice (bottom) stained with bungarotoxin (red) and immunolabeled with SV2 and neurofilament (green). Bar = 20 μm. All P values are based on two-tailed t test. *P<0.05, **P<0.01, ***P<0.001, ****P<0.0001.

References

    1. Ahrens HE, Huettemeister J, Schmidt M, Kaether C & von Maltzahn J. (2018). Klotho expression is a prerequisite for proper muscle stem cell function and regeneration of skeletal muscle. Skelet Muscle 8, 20. - PMC - PubMed
    1. Ang SJ, Crombie EM, Dong H, Tan KT, Hernando A, Yu D, Adamson S, Kim S, Withers DJ, Huang H & Tsai SY. (2022). Muscle 4EBP1 activation modifies the structure and function of the neuromuscular junction in mice. Nat Commun 13, 7792. - PMC - PubMed
    1. Bachman JF, Klose A, Liu W, Paris ND, Blanc RS, Schmalz M, Knapp E & Chakkalakal JV. (2018). Prepubertal skeletal muscle growth requires Pax7-expressing satellite cell-derived myonuclear contribution. Development 145. - PMC - PubMed
    1. Baskin KK, Winders BR & Olson EN. (2015). Muscle as a “mediator” of systemic metabolism. Cell Metab 21, 237–248. - PMC - PubMed
    1. Blanco CE, Sieck GC & Edgerton VR. (1988). Quantitative histochemical determination of succinic dehydrogenase activity in skeletal muscle fibres. Histochem J 20, 230–243. - PubMed

Publication types

LinkOut - more resources