[Preprint]. 2025 Jun 24:2022.10.02.508492.
doi: 10.1101/2022.10.02.508492.

Spatially defined multicellular functional units in colorectal cancer revealed from single cell and spatial transcriptomics

Affiliations

Spatially defined multicellular functional units in colorectal cancer revealed from single cell and spatial transcriptomics

Inbal Avraham-Davidi et al. bioRxiv. .

Abstract

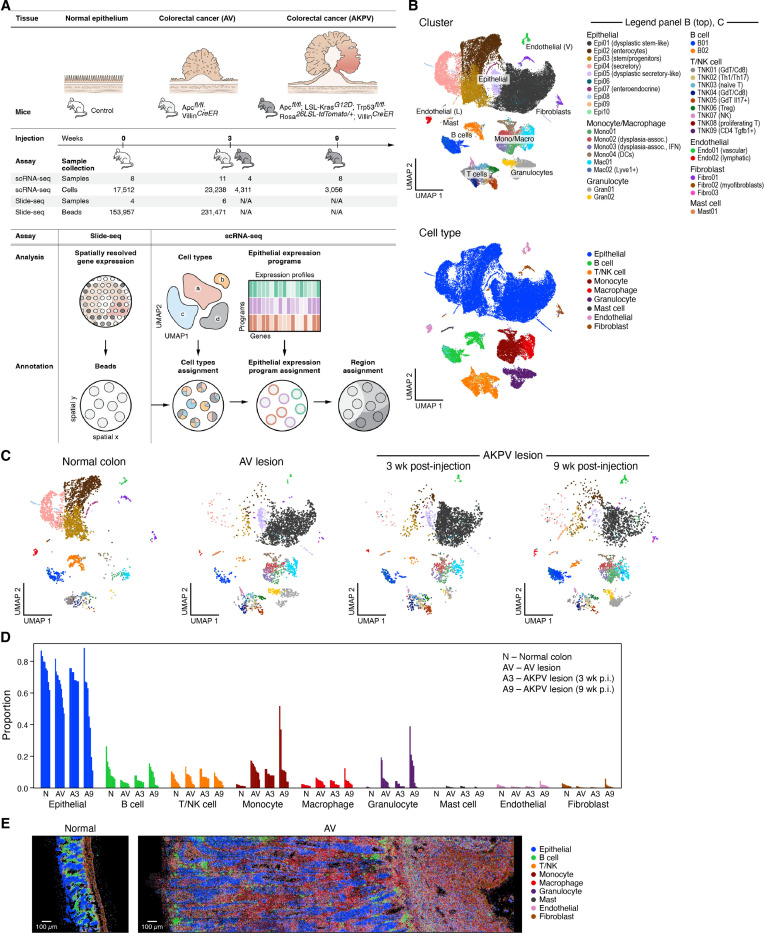
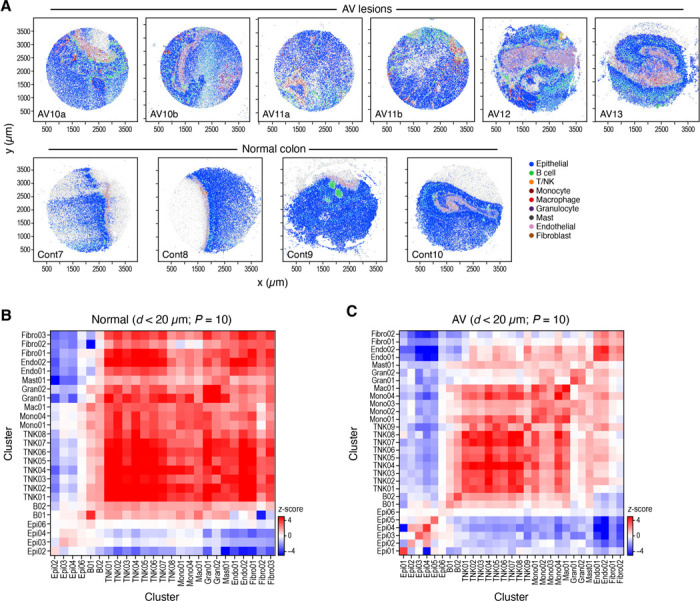
While advances in single cell genomics have helped to chart the cellular components of tumor ecosystems, it has been more challenging to characterize their specific spatial organization and functional interactions. Here, we combine single cell RNA-seq, spatial transcriptomics by Slide-seq, and in situ multiplex RNA analysis, to create a detailed spatial map of healthy and dysplastic colon cellular ecosystems and their association with disease progression. We profiled inducible genetic CRC mouse models that recapitulate key features of human CRC, assigned cell types and epithelial expression programs to spatial tissue locations in tumors, and computationally used them to identify the regional features spanning different cells in the same spatial niche. We find that tumors were organized in cellular neighborhoods, each with a distinct composition of cell subtypes, expression programs, and local cellular interactions. Comparing to scRNA-seq and Slide-seq data from human CRC, we find that both cell composition and layout features were conserved between the species, with mouse neighborhoods correlating with malignancy and clinical outcome in human patient tumors, highlighting the relevance of our findings to human disease. Our work offers a comprehensive framework that is applicable across various tissues, tumors, and disease conditions, with tools for the extrapolation of findings from experimental mouse models to human diseases.


Conflict of interest statement

A.M. has served a consultant/advisory role for Third Rock Ventures, Asher Biotherapeutics, Abata Therapeutics, ManaT Bio, Flare Therapeutics, venBio Partners, BioNTech, Rheos Medicines and Checkmate Pharmaceuticals, is currently a part-time Entrepreneur in Residence at Third Rock Ventures, is an equity holder in ManaT Bio, Asher Biotherapeutics and Abata Therapeutics, and has received research funding support from Bristol-Myers Squibb. G.M.B. has sponsored research agreements with InterVenn Biosciences, Palleon Pharmaceuticals, Olink Proteomics, and Teiko Bio. G.M.B. is a consultant for Ankyra Therapeutics and InterVenn Bio. G.M.B. has been on scientific advisory boards for Merck, Iovance, Nektar Therapeutics, Instil Bio, and Ankyra Therapeutics. G.M.B. holds equity in Ankyra Therapeutics. J.L. and M.R. hold equity in 10xGenomics. N.H. holds equity in BioNTech and is a founder of Related Sciences/DangerBio. F.C. is a founder and holds equity in Curio Biosciences. O.Y. holds equity and is a SAB member of AVA Lifesciences. A.R. and O.R.-R. are co-inventors on patent applications filed by the Broad Institute for inventions related to single cell genomics. O.R.-R. has given numerous lectures on the subject of single cell genomics to a wide variety of audiences and in some cases, has received remuneration to cover time and costs. O.R.-R. is an employee of Genentech since October 19, 2020 and has equity in Roche. A.R. is a co-founder and equity holder of Celsius Therapeutics, an equity holder in Immunitas, and was an SAB member of ThermoFisher Scientific, Syros Pharmaceuticals, Neogene Therapeutics and Asimov until July 31, 2020. From August 1, 2020, A.R. is an employee of Genentech and has equity in Roche.

Figures

Figure 1.
Figure 1.. A single cell atlas of healthy colon and dysplastic lesions in mouse.
A. Study overview. B. Major cell subsets of healthy colon and dysplastic lesions. 2D embedding of 48,115 single cell profiles colored by cluster (top, legend) or annotated cell type (bottom, legend). C,D. Changes in cell composition in dysplastic tissues. C. 2D embedding of single cell profiles, showing only the cells in each condition state, subsampled to equal numbers of cells per condition state, colored by cluster (same legend as in B (top)). D. Proportion of cells (y axis) of each cell type in each sample (x axis). E. multiplex RNA in situ analysis. Representative images of Cartana analysis of normal colon (left) and AV lesions (right) colored by cell type assignment (same as Supplementary item 2A).
Figure 2.
Figure 2.. Composition and cell intrinsic expression program changes in dysplastic epithelial cells.
A-C. Compositional changes in epithelial cells in dysplastic tissue. A. 2D embedding of epithelial cell profiles colored by clusters (legend). Cluster Epi06: potential doublets (Methods). B. Proportion of cells out of all epithelial cells (y axis) of each epithelial cell subset in each sample (x axis). C. Fraction of expressing cells (dot size) and mean expression in expressing cells (dot color) of marker genes (columns) for each cluster (rows). D-E. Use of epithelial cell programs changes in dysplastic tissue. D. Weights (x axis) of each of the 20 top ranked genes (y axis) for each program. E. Proportion of program weights summed over all epithelial cells (y axis) in each sample (x axis). F. Stem cell program 16 is induced in epithelial cells in dysplastic tissue. Scaled log-normalized expression (color bar) of the top 100 genes differentially expressed between cells from normal colon and from dysplastic (AV and AKPV) across the 10,812 cells that accounted for 90% of program 16’s expression across all epithelial cells (columns). Selected program genes are marked.
Figure 3.
Figure 3.. Altered cell type neighborship in CRC.
A. Cell type distributions in situ. Slide-seq pucks of dysplastic (top) and normal (bottom) tissue colored by TACCO assignment of cell labels (legend, light grey: low quality beads) (x and y axis: spatial coordinates in μm). B,C. Cell type neighborships in normal and dysplastic colon tissue. Short-range (up to 20μm) neighborship enrichment (Z score, color bar) vs. a background of spatially random annotation assignments for each pair of cell annotations (rows, columns) in normal (A) and dysplastic (B) tissue.
Figure 4.
Figure 4.. Three cellular neighborhoods associated with tumor progression.
A. Spatial regions. Slide-seq pucks of AV (top) and normal (bottom) mouse colon colored by TACCO regions (legend, light gray: low quality beads) (x and y axis are spatial coordinates in μm). B,C. Enrichment and depletion of cell subsets and epithelial programs across different regions. Significance (FDR, color bar, two-sided Welch’s t-test on CLR-transformed compositions) of enrichment (red) or depletion (blue) of specific cell subsets (rows, B) or epithelial cell programs (rows, C) in the different regions defined by TACCO (columns) as well as all normal (“N (ref.)”, leftmost column) and AV (“AV (ref.)”, leftmost column) samples. D. TACCO defined regions preferentially relate to normal or AV tissue. Significance (FDR, color bar, two-sided Welch’s t-test on CLR-transformed compositions) of enrichment (red) or depletion (blue) of each TACCO defined region (rows) in normal (“N vs. rest”) and AV (“AV vs. N”) samples (columns). E. TACCO reveals normal colon architecture. Left: Slide-seq puck of normal mouse colon colored by TACCO region annotations (legend) (x and y axis: spatial coordinates (μm)). Right: Main epithelial expression programs enriched in each region (FDR<6.3 10−4, two-sided Welch’s t test on CLR-transformed compositions) except region 2 (muscularis), which is characterized by non-epithelial (stromal) cell types. F. Expression signatures of cells in normal regions 3,5,10 and 12. Scaled log-normalized expression of the top 20 differentially expressed genes (rows) for each bead (columns) in the region. G,H. Malignant-like regions. G. Slide-seq pucks of two AV lesions colored by TACCO annotations of malignant-like regions 6, 8 and 11. H. Scaled log-normalized expression of the top 20 differentially expressed genes (rows) of each bead (left, columns) in the region; or epithelial (middle left), immune (middle right) or stromal (right) fractions of beads (columns) in regions 6, 8 and 11 in dysplastic lesions. I,J. Epithelial cell subsets and programs associated with “malignant-like”, “normal-like” and normal tissues. Significance (FDR, color bar, two-sided Welch’s t-test on CLR-transformed compositions) of enrichment (red) or depletion (blue) of epithelial cell programs (I, rows) or epithelial, immune and stromal cell subsets (J, rows) in different tissue types (columns) based on Slide-seq or scRNA-seq (“sc”) samples. K. Inferred interaction pathways. Enrichment (FDR) in AV vs. normal tissue of corresponding “sender” (x axis) and “receiver” (y axis) (aggregated over ligand-receptor pairs) pathways (dots). Red/blue: pathways significantly enriched in AV/normal samples and (light red: only for either sender or receiver). The top 5 enriched pathways (in each direction) are labeled.
Figure 5.
Figure 5.. Mouse tumor regions associated with tumor progression in human colorectal tumors.
A. Expression profiles characterizing mouse regions are recapitulated in human tumors. Significance (FDR, color bar, two-sided Welch’s t-test on CLR-transformed compositions) of enrichment (red) or depletion (blue) of region-associated epithelial, immune or stromal profiles (rows) compared between normal, MMRp, or MMRd samples (columns). B,C. Mouse regions capture malignant features in human tumors. B. Top left: First (PC1, x axis) and second (PC2, y axis) principal components of mouse region scores of mouse and human epithelial pseudo-bulk samples. Top right: PC1 loadings (x axis) of each mouse region score (y axis). Bottom: PC1 values (box plots show mean, quartiles, and whiskers for the full data distribution except for outliers outside 1.5 times the interquartile range (IQR)) for each type of mouse or human sample (x axis). C. Significance (FDR, color bar, two-sided Welch’s t-test) of enrichment (red) or depletion (blue) of region-associated profile scores (rows) in normal and dysplastic samples (columns) in human or mouse. D,E. Expression of malignant like regions 6 and 11 in tumors are associated with PFI (D) and OS (E) in human patients. Kaplan-Meier PFI (e, n = 662) or OS (f, n = 662) analysis of human bulk RNA-seq cohort stratified by malignant-like region profile scores.

References

    1. McAllister S.S., and Weinberg R.A. (2014). The tumour-induced systemic environment as a critical regulator of cancer progression and metastasis. Nat. Cell Biol. 16, 717–727. - PMC - PubMed
    1. Pelka K., Hofree M., Chen J.H., Sarkizova S., Pirl J.D., Jorgji V., Bejnood A., Dionne D., Ge W.H., Xu K.H., et al. (2021). Spatially organized multicellular immune hubs in human colorectal cancer. Cell 184, 4734–4752.e20. - PMC - PubMed
    1. Wagner J., Rapsomaniki M.A., Chevrier S., Anzeneder T., Langwieder C., Dykgers A., Rees M., Ramaswamy A., Muenst S., Soysal S.D., et al. (2019). A Single-Cell Atlas of the Tumor and Immune Ecosystem of Human Breast Cancer. Cell 177, 1330–1345.e18. - PMC - PubMed
    1. Hunter M.V., Moncada R., Weiss J.M., Yanai I., and White R.M. (2021). Spatially resolved transcriptomics reveals the architecture of the tumor-microenvironment interface. Nat. Commun. 12, 1–16. - PMC - PubMed
    1. Keren L., Bosse M., Marquez D., Angoshtari R., Jain S., Varma S., Yang S.-R., Kurian A., Van Valen D., West R., et al. (2018). A Structured Tumor-Immune Microenvironment in Triple Negative Breast Cancer Revealed by Multiplexed Ion Beam Imaging. Cell 174, 1373–1387.e19. - PMC - PubMed

Publication types

LinkOut - more resources