[Preprint]. 2025 Jun 27:2025.06.24.661327.
doi: 10.1101/2025.06.24.661327.

Integrated Spatial Analysis of Ovarian Precancerous Lesions

Affiliations

Integrated Spatial Analysis of Ovarian Precancerous Lesions

Tu-Yung Chang et al. bioRxiv. .

Abstract

Studying precancerous lesions is essential for improving early detection and prevention, particularly in aggressive cancers such as ovarian carcinoma. Here, we conducted integrated and spatial analyses of transcriptomes, aneuploidy, and clinic-pathological features in 166 ovarian precancerous lesions. Four pre-cancerous subtypes were identified transcriptomically: proliferative, immunoreactive, dormant, and mixed. These subtypes varied in their frequency of germline-BRCA1/2 mutations, aneuploidy, CCNE1/MYC amplification, proliferative activity, immune-regulatory gene expression, and histological features. Notably, the immunoreactive subtype upregulated immune-regulatory genes, exhibited chronic inflammation, and was enriched in cases with germline-BRCA1/2 mutations, deletions of chromosomes 17 (harboring TP53 and BRCA1) and 13 (harboring BRCA2), leading to a double "two-hit" involving TP53 and BRCA1/2. Tumor invasion was associated with the activation of interferon response pathways, epithelial-mesenchymal transition, and extracellular matrix remodeling. In summary, our results elucidate the earliest molecular landscape of ovarian precancerous lesions, serving as the foundation for future risk stratification to identify aggressive pre-cancerous lesions.

Keywords: BRCA1; ovarian cancer; precursor lesions.


Conflict of interest statement

Conflict of interest statement: CD is a consultant and the founder of Belay Diagnostics. He also consults for Exact Sciences. Both companies have licensed technologies from JHU. JHU and CD may be entitled to royalties as part of this arrangement. JHU is aware of the conflict and manages these relationships according to its policy. HC and IS have served as consultants for Roche Diagnostics, Inc.

Figures
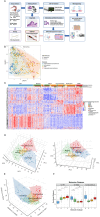
Figure 1.
Figure 1.. Spatial transcriptomic analysis identifies molecular heterogeneity of tubal pre-cancerous lesions.
(A) A schematic illustration of the study design. (B) UMAP visualization of transcriptomics from epithelial and stromal samples of different diagnostic groups. (C) The heatmap displays hierarchical clustering of the top 50 differentially expressed genes in tubal pre-cancerous (STIC) lesions and cancerous lesions. Four STIC molecular subtypes are identified. (D) 3D PCA analysis demonstrate the separation of STIC subtypes (or pre-cancerous lesions of Fallopian tube). Plots are generated based on the leading principal components. (E) 3D plots illustrate the molecular distances of STIC subtypes and the referenced normal fallopian tube epithelium (NFT), high-grade serous carcinoma (HGSC), and ovarian mesothelium. (F) Boxplots present the molecular (Euclidean) distances between individual STIC subtype and the referenced NFT (left), HGSC (middle), and ovarian mesothelium (right).
Figure 2.
Figure 2.. Differentially expressed genes across STIC molecular subtypes.
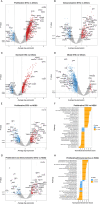
(A) Differential gene expression in the Proliferative subtype. (B) Differential gene expression in the Immunoreactive subtype. (C) Differential gene expression in the Dormant subtype. (D) Differential gene expression in the Mixed subtype. (E) Differential gene expression in the Proliferative STIC subtype versus HGSC. (F) Hallmark gene set enrichment analysis for the comparison shown in (E). (G) Differential gene expression in the Immunoreactive STIC subtype versus HGSC. (H) Hallmark gene set enrichment analysis for the comparison shown in (G).
Figure 3.
Figure 3.. Aneuploidy patterns across molecular subtypes of STICs.
(A) The aneuploidy index across all subtypes. (B) The heatmap displays DNA copy number alterations in different STIC subtypes. Representative cancer-associated genes located in the loci exhibiting copy number gain or loss are indicated. (C) Correlation between DNA copy number gain or loss and the up- or down-regulation of mRNA corresponding to genes situated in their cytobands. (D) A list of genes whose copy number alterations significantly correlate with their mRNA expression levels. CN: copy number; CNV: copy number variations; D: dormant; M: mixed; I: immunoreactive; P: proliferative; HGSC: high-grade serous carcinoma.
Figure 4.
Figure 4.. Enrichment of immune cells in the STICs harboring BRCA1/2 germline mutations.
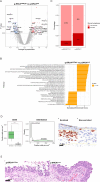
(A) Volcano plot showing differentially expressed genes in germline (g)-BRCA1/2mut mutation STICs, compared to the g-BRCA1/2wildtype STICs. (B) Pathway analysis based on the differentially expressed genes from (A). (C) Percentages of STICs show enriched stromal lymphocytes. (D) CD45 cell density per mm2 in pathologist-defined lymphocyte-enriched versus non-enriched stroma (left); smoothed density plot displaying the distribution of CD45+ cell densities across all regions (middle); representative CD45+ cells with automated segmentation overlays from an enriched region and a non-enriched region (right panels). (E) Representative STIC lesions illustrate stromal lymphocyte density: non-enriched in a g-BRCA1/2wildtype sample (left) versus enriched infiltrate in a g-BRCA1mut sample (right).
Figure 5.
Figure 5.. Correlation of STIC molecular subtypes with clinical and pathological features.
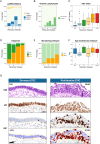
Correlations with (A) germline-BRCA1/2 mutation status, (B) stromal lymphocyte infiltration, (C) proliferative activity based on the Ki67 labeling index, (D) pathology diagnosis, (E) morphological features, and (F) age at presentation. (G) Photomicrographs of H&E-stained, p53-stained, and Ki67-stained slides contain one STIC of the dormant subtype and another of the proliferative subtype. Compared to the dormant STIC, the proliferative STIC shows budding, loosely adherent, and detached (BLAD) tumor cells and has a Ki67 labeling index of 51.9% (4.5% in dormant STIC), quantified by the QuPath program (bottom panels). P: proliferative subtype; I: immunoreactive subtype; M: mixed subtype; D: dormant subtype.
Figure 6.
Figure 6.. Validation of upregulated genes in STICs and HGSCs.
(A) H&E-stained and immunostained images for SOX4, MCM7, KIFC1, and DBN1 in selected STIC and HGSC samples. (B) Quantification of protein expression using the QuPath program. Violin plots display IHC scores for the selected markers across different diagnostic groups and morphologic categories. (C) Schematic illustration of the progression from normal fallopian tube epithelium (NFT) through serous tubal intraepithelial carcinoma (STIC) to high-grade serous carcinoma (HGSC). The possible genes and the pathways in which they are involved are listed.

References

    1. Shih I-M W.Y., Vang R. (2025). Serous tubal intraepithelial carcinoma—looking into the earliest events of ovarian cancer development. Academia Oncology 2. 10.20935/AcadOnco7620. - DOI
    1. Piek J.M., van Diest P.J., Zweemer R.P., Jansen J.W., Poort-Keesom R.J., Menko F.H., Gille J.J., Jongsma A.P., Pals G., Kenemans P., and Verheijen R.H. (2001). Dysplastic changes in prophylactically removed Fallopian tubes of women predisposed to developing ovarian cancer. J Pathol 195, 451–456. - PubMed
    1. Piek J.M., van Diest P.J., Zweemer R.P., Kenemans P., and Verheijen R.H. (2001). Tubal ligation and risk of ovarian cancer. Lancet 358, 844. S0140–6736(01)05992-X [pii] 10.1016/S0140-6736(01)05992-X. - DOI - PubMed
    1. Piek J.M., Verheijen R.H., Kenemans P., Massuger L.F., Bulten H., and van Diest P.J. (2003). BRCA1/2-related ovarian cancers are of tubal origin: a hypothesis. Gynecol Oncol 90, 491. S0090825803003652 [pii]. - PubMed
    1. Gross A.L., Kurman R.J., Vang R., Shih Ie M., and Visvanathan K. (2010). Precursor lesions of high-grade serous ovarian carcinoma: morphological and molecular characteristics. J Oncol, 126295. 10.1155/2010/126295. - DOI - PMC - PubMed

Publication types