[Preprint]. 2025 Jun 25:2025.02.21.639603.
doi: 10.1101/2025.02.21.639603.

The economic strategies of superorganisms

Affiliations

The economic strategies of superorganisms

Lily Leahy et al. bioRxiv. .

Abstract

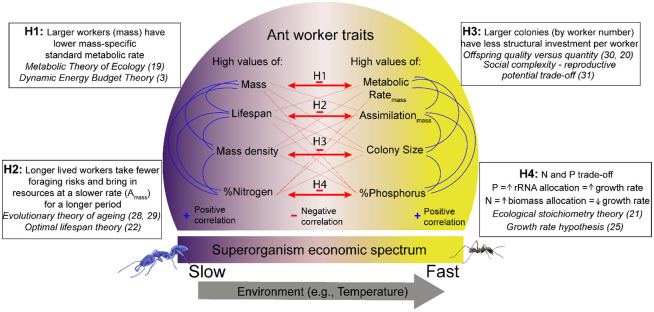
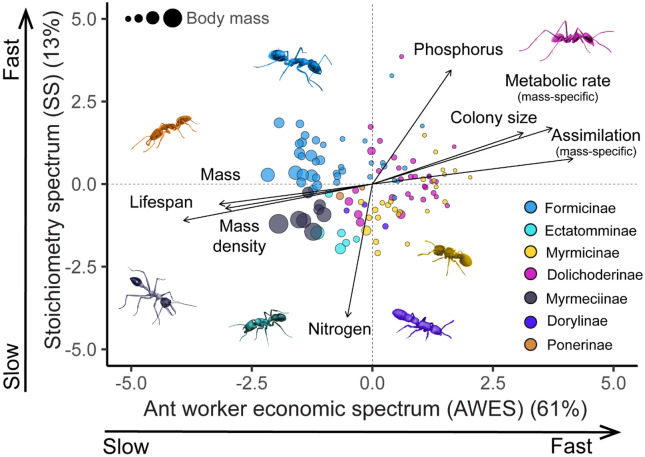
The leaf economics spectrum links strategies of plant investment in resource-acquiring leaves to overall fitness. We test whether an economic spectrum can also explain variation in ecological strategies of ant species across environmental gradients, where colony investment in workers is analogous to plant investment in leaves. A fast return of resource investment was associated with large colonies of smaller, less robust, short-lived workers with low nitrogen:phosphorus ratios. Slow resource payback was associated with small colonies of densely built, energetically conservative and longer-lived workers with high nitrogen:phosphorus ratios. Species representing the entire economic continuum co-occurred in all communities. Phylogenetic analyses suggest genus level conservation of core investment templates. These results unify studies of plants and ants, suggesting common economic principles apply across the tree of life.


Figures

Fig. 1:
Fig. 1:. Conceptual framework of the hypothesised relationships between eight ant worker traits that together place species along a fast-slow economic spectrum.
Predicted positive trait correlations shown by blue, predicted negative trait correlations shown in red. Four key trait trade-offs and their hypothesised relationships are highlighted and explained in text boxes H1, H2, H3, H4 with reference to underlying bodies of theory (see reference list: (3, 20-23, 26, 29-32)). High trait values of body mass, lifespan, mass density, and nitrogen concentration and low trait values for the other four traits are predicted to indicate a slow strategy. High trait values of mass-specific metabolic rate, mass-specific assimilation (resource intake) rate, colony size (worker number), and phosphorus concentration and low trait values for the other four traits are predicted to indicate a fast strategy. Species positions along the superorganism economic spectrum indicate the pace of investment and return of resources into ant workers and back to the colony. Species positions may be modulated by the abiotic and biotic environment, for example, ambient temperature could shift communities towards fast ecological strategies.
Fig. 2:
Fig. 2:. Two sets of correlated traits trade-off to create a fast-slow economic spectrum.
(A) Posterior summaries of phylogenetic correlation coefficients from MR-PMM analysis, showing the posterior mean (point), 50% (heavy wick) and 95% (light wick) credible intervals. (B) Network diagram showing phylogenetic trait correlations significant at 95% (bold) and 70-90% (faded) credible interval. Blue lines = positive relationships, red lines = negative relationships. Line width indicates strength of correlation. Phylogenetic correlations are estimated with greater uncertainty than standard between-species correlations (34), meaning 95% CI are likely to be conservative. Despite some long-tailed posterior distributions, the absolute posterior mean estimates for each correlation coefficients were all >0.4, identifying an integrated trait network that strongly supports a fast-slow economic spectrum. Amass = mass-specific resource assimilation, MRmass = mass-specific metabolic rate.
Fig. 3:
Fig. 3:. Mapping the superorganism economic spectrum onto multidimensional space.
Showing varimax-rotated PCA from gap-filled species-averaged trait data from 305 colonies, with the 123 species as points and coloured as subfamily groups. Percentage variation explained in brackets for axis 1 (ant worker economic spectrum - AWES) and axis 2 (stoichiometry spectrum - SS). Size of points represents dry body mass scaled between 1-10. Ant icons are representative genera from each subfamily, anticlockwise from top left: Formicinae = Camponotus, Ponerinae = Anochetus, Myrmeciinae = Myrmecia, Ectatomminae = Rhytidoponera, Dorylinae = Lioponera, Myrmicinae = Meranoplus, Dolichoderinae = Iridomyrmex.
Fig. 4:
Fig. 4:. Mapping the superorganism economic spectrum onto the ant phylogenetic tree at the genus level.
Showing PCA scores from Fig. 3. For axis 1: Ant Worker Economic Spectrum (AWES) and for axis 2: Stoichiometry Spectrum (SS). Slow values (darker colours) for AWES signify large body mass, long lifespan, high mass density, low mass-specific metabolic and assimilation rates and small colony sizes. Fast values (lighter colours) represent the opposite values for each trait. Slow values (darker colours) for stoichiometry spectrum (SS) represent high nitrogen concentration and low phosphorus concentration, with the opposite ratio for fast ecological strategies (lighter colours). This demonstrates that niche partitioning is occurring along two axes of the ant economic spectrum (see PCA Fig. 3 to see these patterns mapped onto multidimensional space, see fig. S6 for subfamily tree). Note, genus Arnoldius scored very high on the SS spectrum and is removed in this figure to improve visualization of colour gradient, see fig. S7 for figure that includes Arnoldius.

References

    1. Mathot K. J., Frankenhuis W. E., Models of pace-of-life syndromes (POLS): a systematic review. Behavioral Ecology and Sociobiology 72, 41 (2018).
    1. Burger J. R., Hou C., Hall C. A., Brown J. H., Universal rules of life: metabolic rates, biological times and the equal fitness paradigm. Ecology Letters 24, 1262–1281 (2021). - PubMed
    1. Kooijman S. A. L. M., Dynamic energy budget theory for metabolic organisation. (Cambridge university press, 2010). - PubMed
    1. Zhang C., Wright I. J., Nielsen U. N., Geisen S., Liu M., Linking nematodes and ecosystem function: a trait-based framework. Trends in Ecology & Evolution, (2024). - PubMed
    1. Gibb H. et al. , Ecological strategies of (pl)ants: Towards a world-wide worker economic spectrum for ants. Functional Ecology 37, 13–25 (2023). - PMC - PubMed

Publication types

LinkOut - more resources