[Preprint]. 2025 Jun 17:2025.06.12.658904.
doi: 10.1101/2025.06.12.658904.

Ablation of Prdm16 and beige fat causes vascular remodeling and elevated blood pressure

Affiliations

Ablation of Prdm16 and beige fat causes vascular remodeling and elevated blood pressure

Mascha Koenen et al. bioRxiv. .

Abstract

While excess adiposity is a major risk factor for hypertension and cardiovascular disease, brown fat is associated with protection from these pathologies. Whether brown fat has a causal role in this process and the underlying molecular mechanisms remain unknown. Here we investigate the role of murine beige fat, as a model of inducible brown fat in humans, in adipocyte-vascular crosstalk. Using mice with an adipocyte-specific deletion of PRDM16, resulting in a loss of beige adipocyte identity, we discover a dramatic remodeling of perivascular adipose tissue, increased vascular reactivity and elevated blood pressure. We further show that the circulating enzyme Qsox1 is de-repressed in Prdm16-deficient adipocytes, and deletion of Qsox1 in PRDM16cKO mice rescues vascular fibrosis and reactivity. These results demonstrate a key new role for beige adipocytes in blood pressure regulation and identify Qsox1 as an important mediator of adipocyte-vascular crosstalk.


Figures

Fig.1.
Fig.1.. Loss of Prdm16 in adipocytes leads to drastic remodeling of thoracic aortic PVAT.
(A, B) Representative appearance and HE stain of the thoracic perivascular adipose tissue (PVAT) in (A) flox control and (B) PRDM16cKO mice. (C) Representative Western Blots of UCP1 and αTUBULIN of flox control (n=4) and PRDM16cKO (n=5) tPVAT and (D) Representative immunofluorescence images of UCP1 and DAPI staining on flox control (grey) and PRDM16cKO (red) tPVAT. (E, F) Representative Western Blots of UCP1 and VINCULIN of flox control (n=3) and PRDM16cKO (n=3) housed at (E) thermoneutrality (TN, 30°C) or (F) cold (8°C) for 1 week. (G) Volcano plot for DEGs in thoracic PVAT of PRDM16cKO minus flox control (green color = significantly up-/down-regulated genes (padj. <0.05) and ∣log2[fold change] ∣ ≥ 0.5 and grey color display non-significant DEGs). Some significant DEGs related to thermogenesis and most upregulated in PRDM16cKO are highlighted. (H) Representative Western Blots of ALDH3B2, REEP6 and VINCULIN of flox control (n=4) and PRDM16cKO (n=5) tPVAT and (I) Representative immunofluorescence images of ALDH3B2 and DAPI staining on flox control (grey) and PRDM16cKO (red) tPVAT. (J) Representative Western Blots of AGT (Angiotensinogen) of flox control (n=4) and PRDM16cKO (n=5) tPVAT and (K) quantification. (L) qPCR analysis of relative expression of Agt to Rpl in tPVAT and (M) body weight of flox control and PRDM16cKO mice. (N) Mass spectrometry measurements of angiotensinogen levels in serum (n=8 per group) and (O) ANGII levels in plasma (n=8 per group) in flox control and PRDM16cKO mice. Individual data points in (K-N) represent data from a single animal, and bars are means ± SEMs. Significance was calculated using unpaired Student’s t test. Statistical significance was set at *P < 0.05; **P < 0.01; ***P < 0.001; ****P < 0.0001; ns, not significant.
Fig.2.
Fig.2.. Ablation of beige fat results in increased vasoconstriction of mesenteric arteries to ANGII and remodeling of mesenteric PVAT.
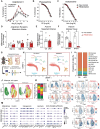
(A-C) Pressure myography of mesenteric arteries after removal of perivascular fat was conducted in flox control and PRDM16cKO mice (n=4-5 per group; 1-2 mesenteric arteries per mouse) treated with (A) ANGII, (B) phenylephrine and (C) acetylcholine. Data are mean+/− SEM. Statistical analysis was performed using two-way analysis of variance (ANOVA). (D-F) Quantitative real-time PCR for (D) Agtr1a, Agtr1b and Agtr2 and (E) Prdm16 on mesenteric arteries and (F) mPVAT (n=4-5 per group). Individual data points represent data from a single animal, and bars are means ± SEMs. (G), Schematic workflow for single nuclei RNA Sequencing of mPVAT. (H) UMAP projection of clusters formed by 13,164 murine mPVAT split by genotype. (I) Proportion of nuclei in each cluster split by genotype. (J) UMAP projection of adipocyte cluster formed by 8783 nuclei from mesenteric adipocytes, split by genotype. (K) Proportion of adipocyte nuclei in each adipocyte cluster split by genotype. (L) FeatureBlot of different genes split by genotype and (M) dot blot of gene expression associated with adipokine secretion, insulin signaling, lipid handling and fibrosis across mesenteric adipocyte subclusters. Statistical significance for all test was set at *P < 0.05; **P < 0.01; ***P < 0.001; ****P < 0.0001; ns, not significant.
Fig.3
Fig.3. Loss of beige adipocytes leads to vascular fibrosis and elevated blood pressure.
(A) Representative images of picrosirius red staining on mesenteric arteries and (B) quantification of % fibrotic arteries/number of arteries per mouse (n=9 per group) and for total single arteries (right). (C) Representative immunofluorescence images for Col1α1 and DAPI nuclei staining on mesenteric arteries. Scale bar 30μm. (D) qPCR for Acta2, Fn1, Col1a1, Col3a1 and Col4a1 on Aorta of flox control (n=10) and PRDM16cKO (n=9) mice (combined 2 independent experiments). (E) ELISA for FN1 (n=3-5) and COL3α1 in Aorta and FN1 (n=8-9 per group) and COL3α1 (n=3-4) in tPVAT of flox control and PRDM16cKO mice. Individual data points in (D, E) represent data from a single animal, and bars are means ± SEMs. Significance was calculated using unpaired Student’s t test. F) Representative immunofluorescence images for Col1α1 and DAPI nuclei staining on the thoracic aorta. Scale bar 100μm (G-I) Measurements of (G) systolic, (H) diastolic and (I) mean arterial blood pressure recorded with implanted radiotelemetry devices in freely moving mice (n=28-29 per group combined from 3 independent experiments). Data are mean+/−SEM. A linear mixed model for repeated measures over time was used to analyze the radiotelemetry data. (J) Recording of body weight after transplantation of radiotelemetry devices. (K) Association of 25 identified missense variants in exon 9 of PRDM16 with cardiovascular and endocrine/metabolic traits in the UK BioBank (UKBB). The direction of the triangles indicates the direction of effect (upward: increased risk or level, downward: decreased risk or level). Red and blue dashed lines represent the false discovery rate-adjusted and nominal significance P value thresholds, respectively. (L-O) Echocardiogram measurements from a cohort of 653 patients with (BAT+) and 1095 patients without (BAT−) thermogenic adipose tissue derived from a previously described propensity-matched cohort (15). (L) Left ventricular (LV) mass index (LV mass/body surface area), (M) left ventricle posterior wall diameter and (N) left atrium (LA) volume index (LA volume/body surface area). Error bars indicate 95% CI. Data was assessed using a general linear model (GLM), and least square means (LSMeans) were determined adjusting for age, sex, body-mass-index, race, and outdoor temperature. Pairwise comparisons were performed using the least significant difference (LSD) test, and 95% confidence intervals were reported. Analyses were conducted using SAS software (SAS Institute, Cary, NC, USA). Statistical significance for all test was set at *P < 0.05; **P < 0.01; ***P < 0.001; ****P < 0.0001; ns, not significant.
Fig.4.
Fig.4.. Loss of QSOX1 in PRDM16cKO adipocytes rescues aortic fibrosis and ANGII-mediated hypercontraction.
(A) Schematic of media shuffling experiment setup. (B) qPCR for Fn1, Col1a1, Col3a1 and Col4a1 on wild type primary aortic vascular smooth muscle cells (VSMC) treated for 48h with conditioned media from flox control or PRDM16cKO adipocytes. Individual data points represent data from a single well from 3 independent experiment, and bars are means ± SEMs. (C) Venn diagram of DEGs from tPVAT and aPVAT of PRDM16cKO mice overlayed with adipocyte-derived secreted proteins identified previously(54). 12 genes are identified to be down (blue) or upregulated (red) in PRDM16cKO mice and signal peptide P-positive. (D) Schematic of generation of double flox adipocyte conditional knock-out (DFcKO) mice (E) Immunofluorescence image for QSOX1 and nuclei staining DAPI in tPVAT of double PRDM16flox; Qsox1flox control (dF control) and DFcKO. Scale bar 30μm. (F) Appearance and HE staining of the thoracic PVAT in dFlox control and DFcKO mice. (G, H) Representative western blot of tPVAT for UCP1 (top), αTUBULIN (top) and AGT (bottom) and VINCULIN (bottom) and (H) quantification. Statistical analysis was performed using Student’s T-Test. (I) qPCR for Fn1, Col1a1, Col3a1 and Col4a1 on the thoracic aorta of dFlox Control and DFcKO mice. Individual data points represent data from a single animal, and bars are means ± SEMs. (J-O) Pressure myography of mesenteric arteries after removal of perivascular fat was conducted in dflox control and DFcKO mice (n=5 per group; 1-2 mesenteric arteries per mouse) treated with (J) ANGII, (K) phenylephrine and (L) acetylcholine. Data are mean+/− SEM. Statistical significance for all test was set at *P < 0.05; **P < 0.01; ***P < 0.001; ****P < 0.0001; ns, not significant.

References

    1. Lawes CMM, Vander Hoorn S, Rodgers A, International Society of Hypertension. Global burden of blood-pressure-related disease, 2001. Lancet. 2008. May 3;371(9623):1513–8. - PubMed
    1. Zhou D, Xi B, Zhao M, Wang L, Veeranki SP. Uncontrolled hypertension increases risk of all-cause and cardiovascular disease mortality in US adults: the NHANES III Linked Mortality Study. Sci Rep. 2018. Jun 20;8(1):9418. - PMC - PubMed
    1. Hypertension Detection and Follow-up Program Cooperative Group. The effect of treatment on mortality in “mild” hypertension: results of the hypertension detection and follow-up program. N Engl J Med. 1982. Oct 14;307(16):976–80. - PubMed
    1. Shulman N, Tuttle E Jr, Entwisle G, Apostolides A, Oberman A, Schnaper HW, et al. Persistence of Reduction in Blood Pressure and Mortality of Participants in the Hypertension Detection and Follow-up Program. JAMA. 1988. Apr 8;259(14):2113–22. - PubMed
    1. Sagie A, Larson MG, Levy D. The natural history of borderline isolated systolic hypertension. N Engl J Med. 1993. Dec 23;329(26):1912–7. - PubMed

Publication types

LinkOut - more resources