

Prevalence of Extremely Severe Obesity and Metabolic Dysfunction Among US Children and Adolescents
- PMID: 40668581
- PMCID: PMC12268495
- DOI: 10.1001/jamanetworkopen.2025.21170
Prevalence of Extremely Severe Obesity and Metabolic Dysfunction Among US Children and Adolescents
Abstract
Importance: Pediatric obesity is associated with complications such as metabolic dysfunction-associated steatotic liver disease (MASLD), type 2 diabetes, dyslipidemia, and hypertension. However, data on the prevalence of extremely severe obesity in childhood and adolescence and its associated complications are lacking.
Objective: To assess trends in pediatric obesity over time and to investigate the association between obesity degree and comorbidities.
Design, setting, and participants: This cross-sectional study included data from nationally representative samples of pediatric participants aged 2 to 18 years from the National Health and Nutrition Examination Survey (NHANES) from 2008 through 2023. NHANES is a US cross-sectional survey assessing health and nutrition through questionnaires, physical examinations, and laboratory tests.
Exposure: Pediatric obesity, classified as follows: traditional classes 1 to 3 obesity (body mass index [BMI] ≥95th percentile to <160% of the 95th percentile) and extremely severe obesity, comprising class 4 (BMI ≥160% to <180% of 95th percentile) and class 5 (BMI ≥180% of 95th percentile) obesity.
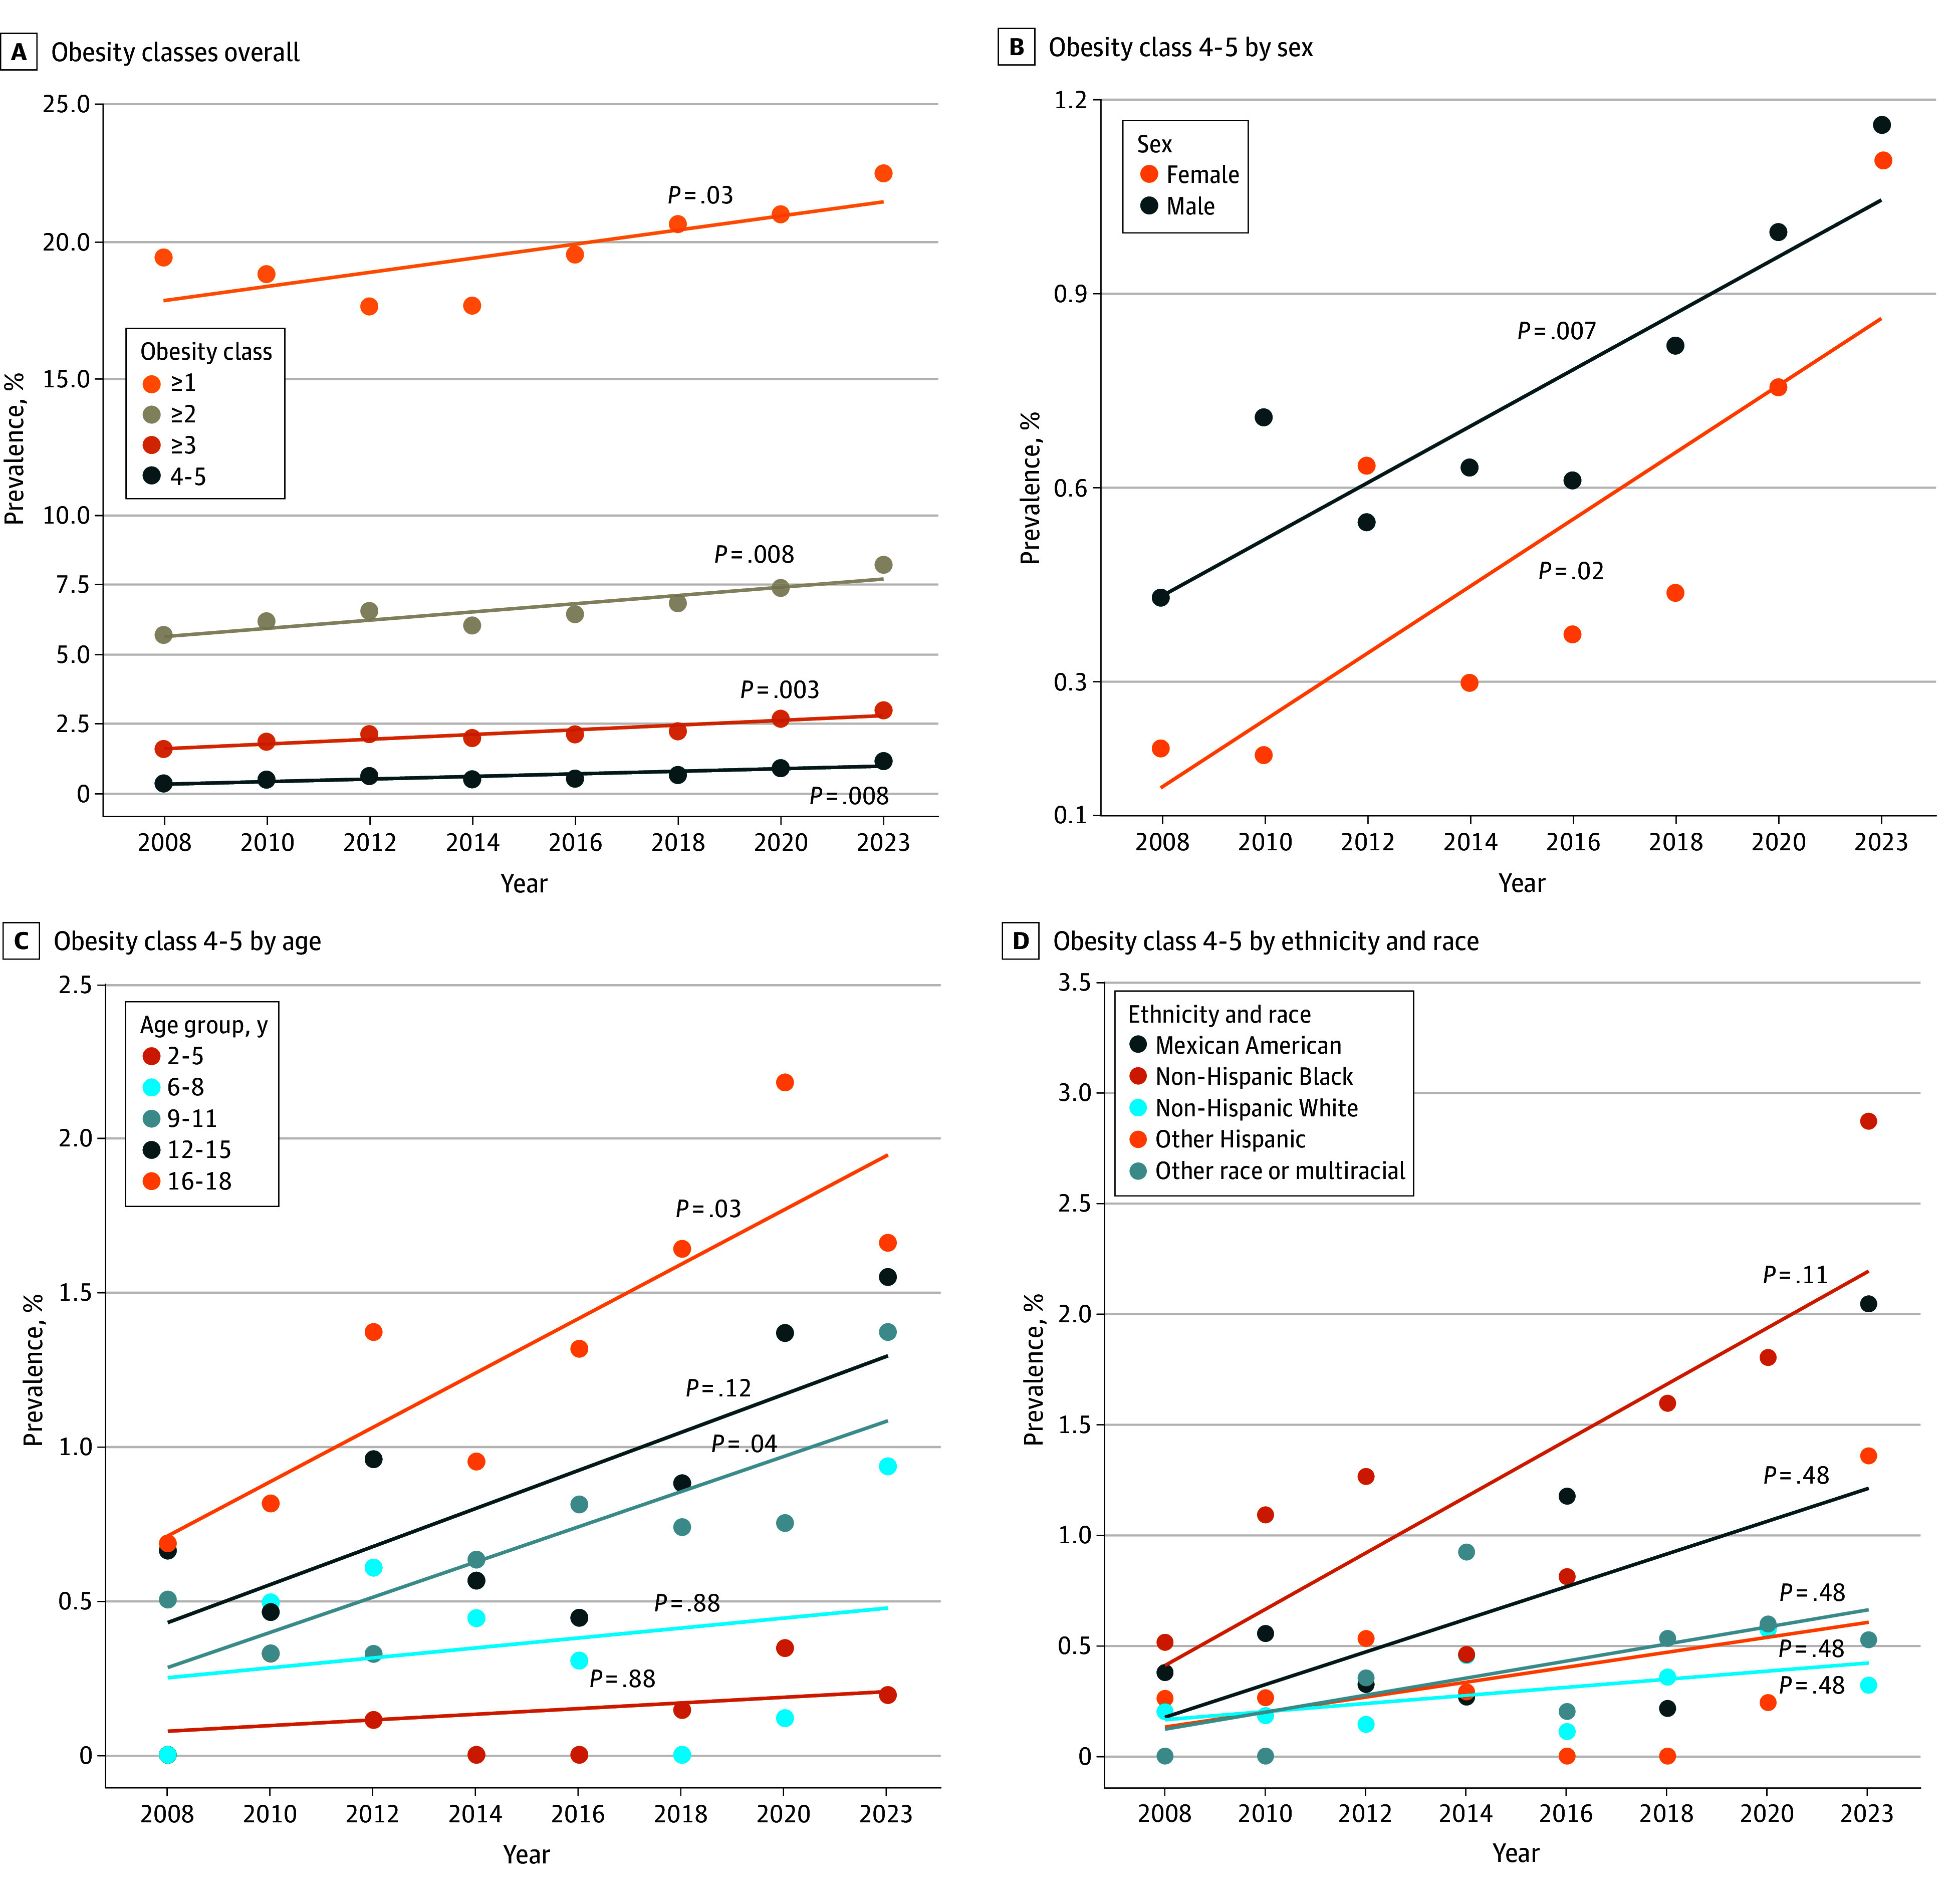
Main outcomes and measures: The main outcomes were national trends in prevalence of obesity classes in childhood and adolescence, stratified by gender, age, and ethnicity and race, and odds of conditions of metabolic dysfunction in each obesity group.
Results: The cohort included 25 847 participants (51% male) with a median age of 10.0 (IQR, 6.00-15.0) years. From 2008 to 2023, the prevalence of pediatric obesity increased, with the highest relative increase of 253.1% observed for extremely severe obesity from 0.32% (95% CI, 0.17%-0.59%) in 2008 to 1.13% (95% CI, 0.78%-1.65%) in 2023. From 2020 to 2023, extremely severe obesity was particularly prevalent among adolescents aged 16 to 18 years (1.99%; 95% CI, 1.31%-2.99%) and non-Hispanic Black participants (2.04%; 95% CI, 1.45%-2.86%). Compared with milder forms of obesity, extremely severe obesity was associated with higher odds of metabolic complications, including MASLD (odds ratio [OR], 6.74; 95% CI, 3.30-15.75), prediabetes or diabetes (OR, 4.94; 95% CI, 3.41-7.14), severe insulin resistance (OR, 8.05; 95% CI, 3.70-17.02), and metabolic syndrome (OR, 1.99; 95% CI, 1.45-2.73).
Conclusions and relevance: In this nationally representative cross-sectional study of US children and adolescents, prevalence of extremely severe obesity significantly increased over time, particularly among older adolescents and non-Hispanic Black participants. Extremely severe obesity was associated with severe metabolic and cardiovascular complications, including MASLD, prediabetes or diabetes, severe insulin resistance, and metabolic syndrome. These findings emphasize the urgent need for public health interventions and policies to address pediatric obesity broadly.
Conflict of interest statement
Figures


References
-
- World Health Organization . Obesity and overweight. May 7, 2025. Accessed August 4, 2024. https://www.who.int/news-room/fact-sheets/detail/obesity-and-overweight
Publication types
MeSH terms
Grants and funding
LinkOut - more resources
Full Text Sources
Medical
