. 2025 Oct 14;9(19):4910-4923.
doi: 10.1182/bloodadvances.2025017079.

Dietary tryptophan augments cancer-associated venous thrombogenicity mitigated by indoleamine 2,3-dioxygenase 1 inhibition

Affiliations

Dietary tryptophan augments cancer-associated venous thrombogenicity mitigated by indoleamine 2,3-dioxygenase 1 inhibition

Saran Lotfollahzadeh et al. Blood Adv. .

Abstract

Studies related to cardio-oncology remain a high priority, considering that venous thromboembolism (VTE) in cancer survivors is the second most common cause of death. Although diet-derived metabolites are emerging as contributors to VTE, the influence of specific dietary components, their underlying mechanisms, and means to mitigate cancer-associated VTE remain poorly investigated. This point is important because population studies point to a protein-rich diet associated with VTE. Leveraging a new colon cancer-VTE mouse model, we show that an imbalanced protein-rich diet augments venous thrombogenicity in tumor-bearing mice. Further probing showed that dietary tryptophan induces a procoagulant venous wall, characterized by upregulation of tissue factor, plasminogen activator inhibitor-1, and von Willebrand factor and downregulation of thrombomodulin. Targeted metabolomics of sera from tumor-bearing mice revealed a pattern consistent with increased biogenesis of kynurenine (Kyn) and its suppressed catabolism, despite equal diet consumption in all groups. Kyn levels positively correlated with venous clots. Indoleamine 2,3-dioxygenase 1 (IDO1) is a key rate-limiting enzyme converting tryptophan to Kyn. Sera and the inferior vena cava of tumor-bearing mice showed greater IDO1 activity and protein level, respectively. A specific IDO1 inhibitor reduced serum levels of Kyn, restored the balance of procoagulant and anticoagulant factors in the venous endothelium, and significantly suppressed venous thrombogenicity in tumor-bearing mice. Taken together, our results uncovered a prothrombotic effect of a protein- or tryptophan-rich diet in a syngeneic colon cancer model, which is significantly attenuated by an IDO1 inhibitor.


Conflict of interest statement

Conflict-of-interest disclosure: The authors declare no competing financial interests.

Figures

None
Graphical abstract
Figure 1.
Figure 1.
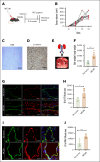
Development of a syngeneic colon cancer tumor model with deep vein thrombosis. (A) A group of 8- to 12-week-old C57BL/6 female mice were injected at the flank with 1 million colon cancer MC38 cells or vehicle. Age-matched mice were compared between the tumor-bearing and control mice. Upon tumors reaching a certain size (typically within 2-3 weeks; see “Methods”), IVC ligation was performed, and clots were harvested 48 hours thereafter. (B) Averages of tumor growth in individual mice injected with MC38 over 3 weeks. (C) Histological analysis of MC38 cells; H&E stain was used. (D) Immunohistochemistry (IHC) of tumors using β-catenin antibody are shown at 100× original magnification (scale bar, 100 μm). (E) A schematic figure of the partial IVC ligation (see “Methods”) and an intraoperative feature of the IVC ligation model. (F) Averages of clot weights normalized to body weight from both groups are shown. Error bars represent the standard error of the mean (SEM; n = 5 mice per group; P = .0016). (G) Paraffin-embedded sections of IVC were stained using anti-TF and anti-CD31 antibodies. Alexa Fluor secondary antibodies and DAPI were used. Images are representative of IVCs from 5 mice in each group. Arrowheads point to endothelial cells. White arrowheads point to the TF expression on endothelial cells, and asterisk points to the subendothelial cells (scale bar, 100 μm). (H) Three images per mouse were analyzed, and a region of interest was marked corresponding to the endothelial cells. ID was normalized to the surface area of the region of interest measured in microns by using ImageJ. Averages of ID normalized to surface area are shown. Error bars represent SEM (P = .0154). (I) IVCs were stained by using anti–PAI-1 and anti-CD31 antibodies. Alexa Fluor secondary antibodies and DAPI were used. Representative images from 5 mice in each group (scale bar, 100 μm). (J) PAI-1 expression was quantified as previously described. Averages of ID normalized to the surface area are shown. Error bars represent SEM (P = .0056). DAPI, 4′,6-diamidino-2-phenylindole; H&E, hematoxylin and eosin; ID, integrated density; K, kidney; L, ligated IVC. ∗P < 0.05, ∗∗P < 0.01, ∗∗∗P < 0.0001, ∗∗∗∗P < 0.0001.
Figure 2.
Figure 2.
Influence of high-protein diet in a syngeneic colon cancer tumor model. Age-matched C57BL/6 female mice were used as in Figure 1. (A) Averages of tumor volumes per group are shown. Error bars represent SEM. (B) Averages of normalized clot weights are shown. Two-factor analysis of variance (ANOVA; P = .0002). (C) Paraffin-embedded sections of IVC were stained using anti-TF and anti-CD31 antibodies. Alexa Fluor secondary antibodies and DAPI were used. Images are representative of IVCs from 5 mice in each group (scale bar, 100 μm). (D) ID was normalized to the surface area of the region of interest measured in microns by using ImageJ. Averages of ID normalized to surface area are shown. Error bars represent SEM. Two-factor ANOVA test (P = .0003). (E) IVCs were stained by using anti–PAI-1 and anti-CD31 antibodies. Alexa Fluor secondary antibodies and DAPI were used. Representative images from 5 mice in each group (scale bar, 100 μm). (F) PAI-1 expression was quantified as previously described. Averages of ID normalized to the surface area are shown. Error bars represent SEM. Two-factor ANOVA test (P = .0002; ∗∗P = .0255). #P < 0.05, ∗P < 0.05.
Figure 3.
Figure 3.
Dietary Trp alters the risk of venous thrombogenicity in a syngeneic colon cancer model. Age-matched C57BL/6 female mice were used as in Figure 1. (A) Averages of tumor growth in all 3 dietary groups are shown. Error bars represent standard deviation. (B) Representative harvested tumors from the 3 groups are shown. (C) Averages of tumor weights in the 3 experimental groups are shown (zero Trp vs 0.2% Trp [normal] vs 1.2% Trp [high]). Error bars represent SEM. (D) Representative images of H&E-stained tumor tissue sections are shown at 40× and 100× original magnifications (scale bars, 25 μm [40×] and 50 μm [100×]). (E) Averages of normalized clot weights in female mice under 6 experimental conditions. Two-factor ANOVA showed P value <.001. Error bars represent SEM. (F) Averages of normalized clot weights in male mice under 6 experimental conditions. The number of mice analyzed under each condition is denoted by dots in each bar graph. Error bars represent SEM. Two-factor ANOVA test showed P value <.001. ns, nonsignificant. ∗P < 0.05, ∗∗P < 0.01, ∗∗∗P < 0.0001, ###P < 0.0001, ####P < 0.0001.
Figure 4.
Figure 4.
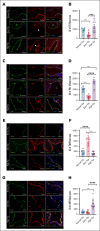
The expressions of procoagulant and anticoagulant proteins are altered in the IVC of mice with colon cancer tumors and on a high Trp diet. Age-matched C57BL/6 female mice were used as in Figure 1. (A) Representative images of paraffin-embedded sections of IVC from mice with MC38 tumor exposed to a normal, zero, or high Trp diets (n = 10 female mice per group). IVC tissues were stained with indicated antibodies. DAPI was used for nuclear stain (scale bar, 100 μm). (B) Averages of normalized ID of TF normalized to surface area in each of the examined sections. Three images per IVC were analyzed in each mouse. Two-factor ANOVA test (P < .0001). (C) Representative images of tissue section of IVC stained with anti–PAI-1 and anti-CD31 antibodies (scale bar, 100 μm). (D) Averages of normalized ID of PAI-1 normalized to surface area in each of the examined section. ANOVA (P < .0001). (E) Representative images of paraffin-embedded sections of IVC from female mice with MC38 tumor exposed to a normal, zero, or high Trp diets, stained with TM and CD31 (n = 10 mice per group). DAPI was used for nuclear stain (scale bar, 100 μm). (F) Averages of normalized ID of TM expression in endothelial cells normalized to surface area in each of the examined sections. ANOVA (P < .0001). (G) Representative images of paraffin-embedded sections of IVC from mice with MC38 tumor exposed to a normal, zero, or high Trp diets, stained with VWF and CD31 (scale bar, 100 μm). (H) Average normalized ID VWF expression in IVC was measured using a region of interest marked corresponding to the endothelial cells. ANOVA (P < .0001; ∗∗∗P = .0002 [zero vs normal Trp]; P = .0585 [not significant; high vs normal Trp]; ###P = .002 [high vs zero Trp]).
Figure 5.
Figure 5.
Alterations in Trp metabolome in mice with syngeneic colon cancer tumors. (A) Average diet intake in grams was measured in 4 age-matched female mice subjected to different Trp diets over 4 days. The y-axis denotes the diet intake per day per mouse. Error bars represent SEM. (B-E) Average levels of Trp metabolites in 4 to 5 mice per group are shown. Error bars represent SEM. ANOVA was performed to compare all the groups. P = .0006 (Trp levels ANOVA); P = .0017 (Kyn ANOVA); P = .0147 (kynurenic acid ANOVA); indoxyl sulfate ANOVA was not significant. Student t test was performed to compare individual groups. For kynurenic acid, in the nontumor group, P = .0631 (between normal and high Trp groups); P = .0778 (between zero and high Trp groups). No significant differences were noted between different diets in the tumor groups. (F) A linear correlation of normalized clot weights with Kyn levels.
Figure 6.
Figure 6.
IDO1 inhibition attenuates thrombosis in a mouse cancer model under different Trp diets. (A) IDO activity measured in the sera of mice with and without MC38 tumor. A group of age-matched 8- to 12-week-old C57BL/6 female mice were used for this experiment. The y-axis is depicted in a log scale. Error bars represent SEM. Student t test was used to compare the groups (P = .0037). (B) Clot weights measured under different diets, as described in Figure 3E, were plotted against values of IDO1 activity measured in the sera of mice described in panel A. A linear correlation between normalized clot weights and IDO activity levels. (C) Representative IF images of IVC from IVC of mice on different Trp diets, stained with antibodies to IDO1 and CD31. DAPI was used for nuclear stain (scale bar, 100 μm). (D) ID of IDO1 labeling normalized to a uniform surface area in all samples. ANOVA (P < .001). Student t test was used to compare groups. (E) Averages of tumor volume in all groups are shown. Error bars represent SEM. (F) Averages of clot weights normalized to the body weight across different groups of mice are shown. Error bars represent SEM. ANOVA was done to compare all groups; P < .0001. Student t test was performed to compare groups. ∗P = .0131; ∗∗P = .0020; ##P = .0011. (G) Average levels of Kyn are shown. Error bars represent SEM. Kyn level measured here under a normal or high Trp diet is somewhat higher than the one recorded in Figure 5C, likely owing to a 3-day longer duration of diet under this experimental condition (see “Results”). The number of mice analyzed under each condition is denoted by dots in each bar graph. Age-matched C57BL/6 female mice were used in all experiments, similar to Figure 1. ANOVA was performed to compare all groups. P = .0012. Student t test was performed to compare groups. #P = .0199; ∗P = .0501; ∗∗P = .0079.
Figure 7.
Figure 7.
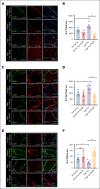
IDO1 inhibition alters TF, PAI-1, and TM expression in IVC of mice with tumors exposed to a high Trp diet. (A) Representative images of tissue sections of IVC from MC38 tumor–bearing mice stained with TF and CD31. DAPI was used for nuclear stain (scale bar, 100 μm). White arrowheads point to the TF expression on endothelial cells, and asterisk points to the subendothelial cells (B) Averages of normalized ID are shown. ANOVA (P < .0001). Student t test was used to compare groups. (C) Representative images of tissue sections of IVC from mice in different groups stained with PAI-1 and CD31. DAPI was used for nuclear stain (scale bar, 100 μm). White arrowheads point to the PAI-1 expression on endothelial cells, and asterisk points to the subendothelial cells. (D) Averages of normalized ID are shown. ANOVA (P = .0036). Student t test was used to compare groups. (E) Representative images of tissue sections of IVC from MC38 tumor–bearing mice stained with TM and CD31. DAPI was used for nuclear stain (scale bar, 100 μm). (F) Averages of normalized ID are shown. Data are representative of 5 age-matched female mice per group. ANOVA (P = .0015). Student t test was used to compare groups. ns, nonsignificant.

References

    1. National Cancer Institute Surveillance, Epidemiology, and End Results Program . 2020. SEER Cancer Statistics Review (CSR) 1975-2017.
    1. Sung H, Ferlay J, Siegel RL, et al. Global cancer statistics 2020: GLOBOCAN estimates of incidence and mortality worldwide for 36 cancers in 185 countries. CA Cancer J Clin. 2021;71(3):209–249. - PubMed
    1. Stoltzfus KC, Zhang Y, Sturgeon K, et al. Fatal heart disease among cancer patients. Nat Commun. 2020;11(1):2011. - PMC - PubMed
    1. Eichinger S. Cancer associated thrombosis: risk factors and outcomes. Thromb Res. 2016;140(Suppl 1):S12–S17. - PubMed
    1. Timp JF, Braekkan SK, Versteeg HH, Cannegieter SC. Epidemiology of cancer-associated venous thrombosis. Blood. 2013;122(10):1712–1723. - PubMed