. 2025 Jul 22;44(7):115991.
doi: 10.1016/j.celrep.2025.115991. Epub 2025 Jul 14.

Physiological and injury-induced microglial dynamics across the lifespan

Affiliations

Physiological and injury-induced microglial dynamics across the lifespan

Taryn Tieu et al. Cell Rep. .

Abstract

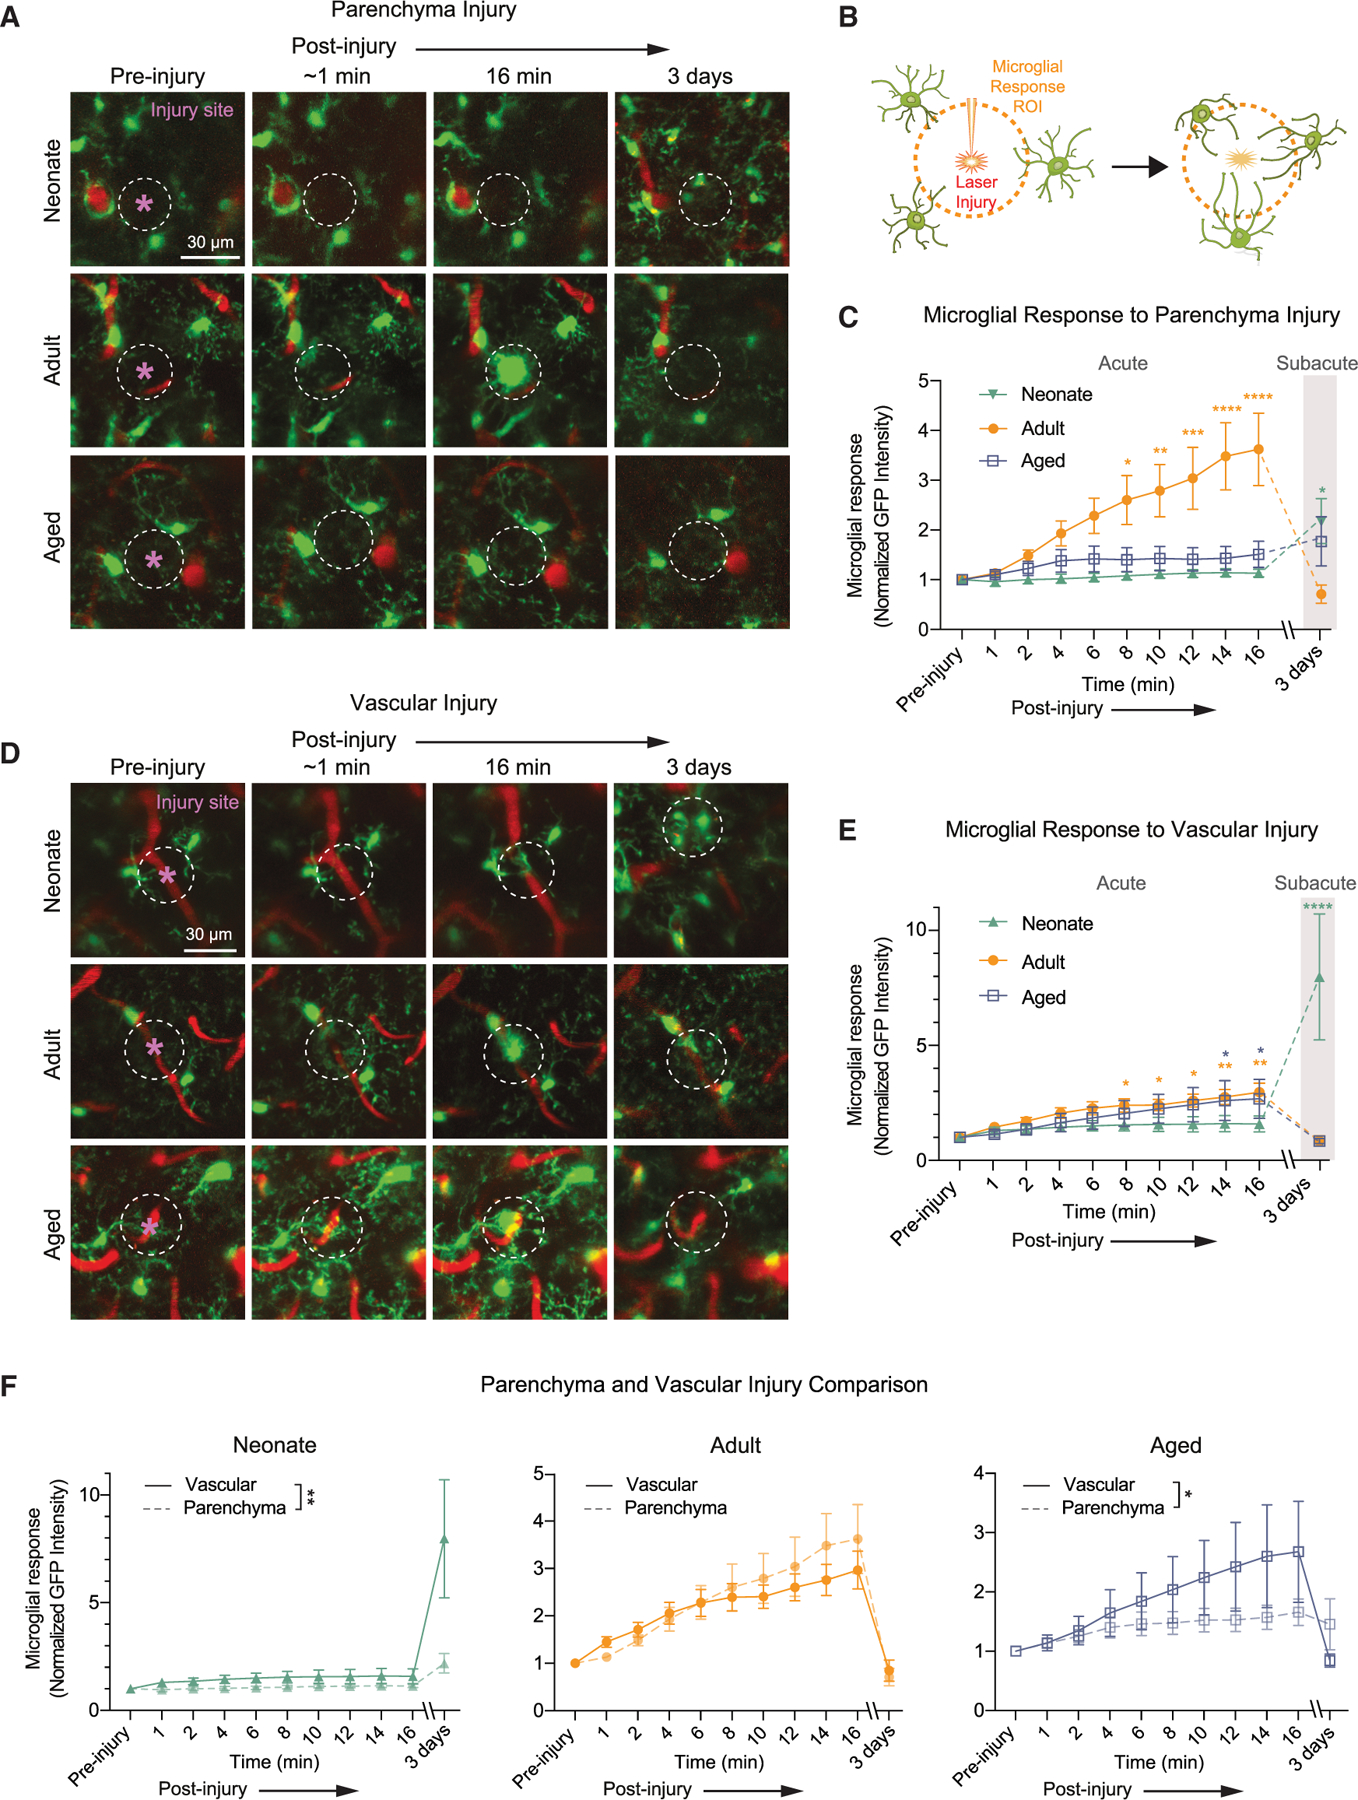
Microglia are the brain's resident immune cells known for their dynamic responses to tissue and vascular injury. However, few studies have explored how microglial activity differs across the life stages of early development, adulthood, and aging. Using two-photon live imaging, we confirm that microglia in the adult cerebral cortex exhibit highly ramified processes and relatively immobile somata under basal conditions. Their responses to focal laser-induced injury occur over minutes and are highly coordinated among neighboring microglia. In contrast, neonatal microglia are denser and more mobile but less morphologically complex. Their responses to focal laser-induced injuries of capillaries or parenchymal tissue are uncoordinated, delayed, and persist over days. In the aged brain, microglia somata remain immobile under basal conditions, but their processes become less ramified. Their responses to focal injuries are coordinated but slower and less sensitive. These studies reveal the marked shifts in microglial morphology, distribution, dynamics, and injury response across the lifespan.

Keywords: CP: Developmental biology; CP: Neuroscience; adulthood; aging; development; lifetime; live imaging; microglia; neuroimmune; surveillance; two-photon imaging; vascular.


Conflict of interest statement

Declaration of interests The authors declare no competing interests.

Figures

Figure 1.
Figure 1.. Physiological characteristics of microglia distribution and branch complexity
(A) Microglia and vasculature in neonates (postnatal day 9), adults (3–5 months), and aged mice (21–23 months). Scale bars: 30 μm. (B) Quantification of microglia density (n = 12 fields from 8 neonatal mice, n = 10 fields from 6 adult mice, and n = 12 fields from 5 aged mice) ****p < 0.0001 using one-way ANOVA with Tukey’s multiple comparisons test. (C) Examples of capillary-associated and non-associated microglia from an adult mouse. Scale bars: 30 μm. (D) Percentage of capillary-associated microglia per field of view (n = 11 fields from 8 neonatal mice, n = 10 fields from 6 adult mice, and n = 12 fields from 5 aged mice; ****p < 0.0001 using one-way ANOVA with Tukey’s multiple comparisons test). (E) High-magnification thresholded images of individual microglia to demonstrate differences in morphology between neonate, adults, and aged mice. Scale bars: 30 μm. (F) Sholl analysis method used to quantify microglial process length, branching, and complexity. Data are presented as mean ± SEM (n = 45 cells from 4 neonatal mice, n = 51 cells from 6 adult mice, and n = 40 cells from 5 aged mice; one-way ANOVA with Tukey’s multiple comparisons test). (G–J) Comparison of Sholl analysis data in postnatal, adult, and aged mice, including length from soma to the longest process point (G), highest number of process intersections that are occurring at one radius point (H), number of initial processes stemming from the soma (I), and ratio of the process maximum to the primary branches, i.e., Schoenen ramification index (J). See also Figures S1 and S2.
Figure 2.
Figure 2.. Microglia soma and process dynamics through the life stages
(A) Representative images showing microglia movement over 20 min in all ages. Light gray microglia represent the initial time of imaging, overlaid with red-colored microglia that depict their positions 20 min later. Scale bars: 30 μm. (B) Distance traveled by microglia somata (n = 195 cells from 4 P9 mice, n = 144 cells from 4 adult mice, and n = 204 cells from 3 aged mice; ****p < 0.0001 using one-way ANOVA with Kruskal-Wallis multiple comparisons test). (C) Percentage of mobile microglia in all age groups (n = 6 cells from 4 neonate, n = 9 cells from 5 adult mice, and n = 12 cells from 5 aged mice; ****p < 0.0001 using one-way ANOVA with Tukey’s multiple comparisons test). (D) Representative images of microglial process extension and retraction at 0, 10, and 20 min in all ages. Scale bars: 20 μm. (E) Length changes of individual microglial processes in neonate, adults, and aged animals. (F) Total absolute change in length for process extensions and retractions across ages (n = 31 processes from 6 neonatal mice, n = 26 processes from 7 adult mice, and n = 39 processes from 8 aged mice). No statistical differences using t test. (G and H) Comparison of total change in process length during extension (G) and retraction (H) plotted as a function of age. (I) Comparison of process growth velocity over rapid timescales (neonate vs. adult **p < 0.0011 and neonate vs. aged *p < 0.0114 using one-way ANOVA with Kruskal-Wallis multiple comparisons test). (J) Comparison of process growth velocity over slow timescales (neonate vs. aged *p < 0.0312 using one-way ANOVA with Kruskal-Wallis multiple comparisons test). (K) Schematic summary of microglia association with vessels and mobility results. See also Figures S3, S4 and S5 and Videos S1, S2 and S3.
Figure 3.
Figure 3.. Comparing microglia reactivity in parenchyma and vascular injuries
(A) Representative images of microglia response to parenchymal injury. The mice were imaged acutely and then reimaged 3 days later. Asterisks mark where the injury was made. Scale bars: 30 μm. (B) Schematic of laser injury experiment. Region of interest is a demarcated area around the injury site where the microglia response is measured. (C) Normalized fluorescence intensity of parenchyma injury sites collected to measure microglial response (n = 14 areas from 6 neonatal mice, n = 11 areas from 8 adult mice, and n = 8 areas from 4 aged mice). Difference from pre-injury in acute response phase (0–16 min): adult pre-injury vs. acute *p = 0.0228, **p = 0.0057, ***p = 0.0007, and ****p < 0.0001 using two-way ANOVA with Sidak’s post hoc test. Subacute response (pre-injury vs. 3 days): *p = 0.0134 using two-way ANOVA with Dunnett’s post hoc test; only neonatal was impacted. Overall response to parenchymal injury: p < 0.0001 neonate vs. adults and aging vs. adults using twoway ANOVA with Dunnett’s post hoc test. (D) Representative images of microglia response to vascular injury. Scale bars: 30 μm. (E) Normalized fluorescence intensity of vascular injury sites collected to measure microglial response. Data are presented as mean ± SEM (n = 14 areas from 6 neonatal mice, n = 11 areas from 8 adult mice, and n = 8 areas from 4 aged mice). Difference from pre-injury in acute response phase (0–16 min): adult pre-injury vs. acute 8 min *p = 0.0307, 10 min *p = 0.0281, 12 min **p = 0.0071, 14 min **p = 0.0021, and 16 min **p = 0.0004; aging pre-injury vs. acute 14 min *p = 0.0365 and 16 min *p = 0.0238 and two-way ANOVA with Sidak’s post hoc test. Subacute response (pre-injury vs. 3 days): ****p < 0.0001 using two-way ANOVA and Dunnett’s post hoc test. Overall response to parenchymal injury: p = 0.0044 neonate vs. adults using two-way ANOVA with Dunnett’s post hoc test. (F) Comparison of parenchymal and vascular injury response in neonate, adult, and aged groups (n = 14 areas from 6 neonatal mice, n = 11 areas from 8 adult mice, and n = 8 areas from 4 aged mice; *p = 0.0151 and **p = 0.0010 parenchyma vs. vascular injury using two-way ANOVA with Sidak’s post hoc test). Scale bar: 30 μm. See also Videos S5, S6, S7, S8 and S9.
Figure 4.
Figure 4.. Assessing peripheral microglia response to injury
(A) Representative images at 0 min and 3 days from neonates with no injury and neonates, adult, and aged mice with vascular injuries. Asterisks mark where the vascular injury was made. Scale bars: 30 μm. (B) Schematic showing analysis of surrounding microglia, defined as microglia in the imaging field but outside of the injury ROI. (C) Thresholded example images of individual surrounding microglia in each experimental group at 0 min and 3 days after vascular injury. (D) Ramification index of surrounding microglia in vascular injury experiments (n = 14 areas from 6 neonatal mice, n = 11 areas from 8 adult mice, and n = 8 areas from 4 aged mice). Overall response to vascular injury: ****p < 0.0001 neonate no-injury and **p = 0.0309 neonate injury using two-way ANOVA with Sidak’s post hoc test. Subacute response (pre-injury vs. 3 days): ****p < 0.0001 neonatal injury vs. no injury and adults vs. aged and *p = 0.0208 neonatal injury vs. adults using two-way ANOVA with Tukey’s post hoc test; only neonatal was impacted. (E) Graphic summary of parenchyma and vascular injury response. See also Figures S6 and S7.

References

    1. Nayak D, Roth TL, and McGavern DB (2014). Microglia development and function. Annu. Rev. Immunol 32, 367–402. 10.1146/annurev-immunol-032713-120240. - DOI - PMC - PubMed
    1. Stevens B, and Schafer DP (2018). Roles of microglia in nervous system development, plasticity, and disease. Dev. Neurobiol 78, 559–560. 10.1002/dneu.22594. - DOI - PubMed
    1. Stevens B, Allen NJ, Vazquez LE, Howell GR, Christopherson KS, Nouri N, Micheva KD, Mehalow AK, Huberman AD, Stafford B, et al. (2007). The classical complement cascade mediates CNS synapse elimination. Cell 131, 1164–1178. 10.1016/j.cell.2007.10.036. - DOI - PubMed
    1. Schafer DP, Lehrman EK, Kautzman AG, Koyama R, Mardinly AR, Yamasaki R, Ransohoff RM, Greenberg ME, Barres BA, and Stevens B (2012). Microglia sculpt postnatal neural circuits in an activity and complement-dependent manner. Neuron 74, 691–705. 10.1016/j.neuron.2012.03.026. - DOI - PMC - PubMed
    1. Tremblay MÈ, Lowery RL, and Majewska AK (2010). Microglial interactions with synapses are modulated by visual experience. PLoS Biol 8, e1000527. 10.1371/journal.pbio.1000527. - DOI - PMC - PubMed