

Cellular porosity in dentin exhibits complex network characteristics with spatio-temporal fluctuations
- PMID: 40668788
- PMCID: PMC12266439
- DOI: 10.1371/journal.pone.0327030
Cellular porosity in dentin exhibits complex network characteristics with spatio-temporal fluctuations
Abstract
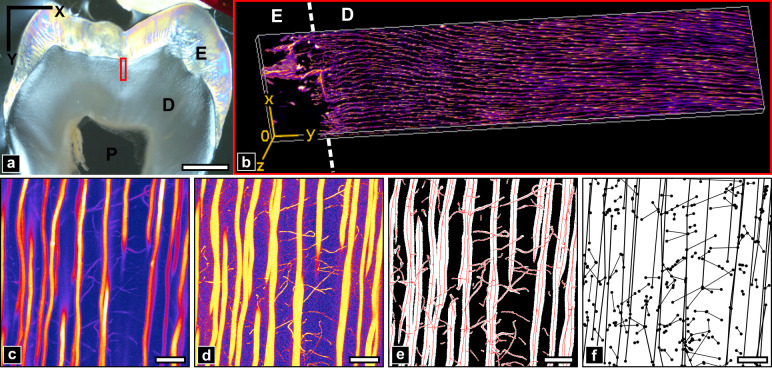
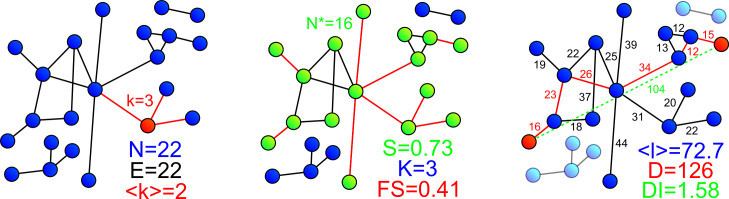
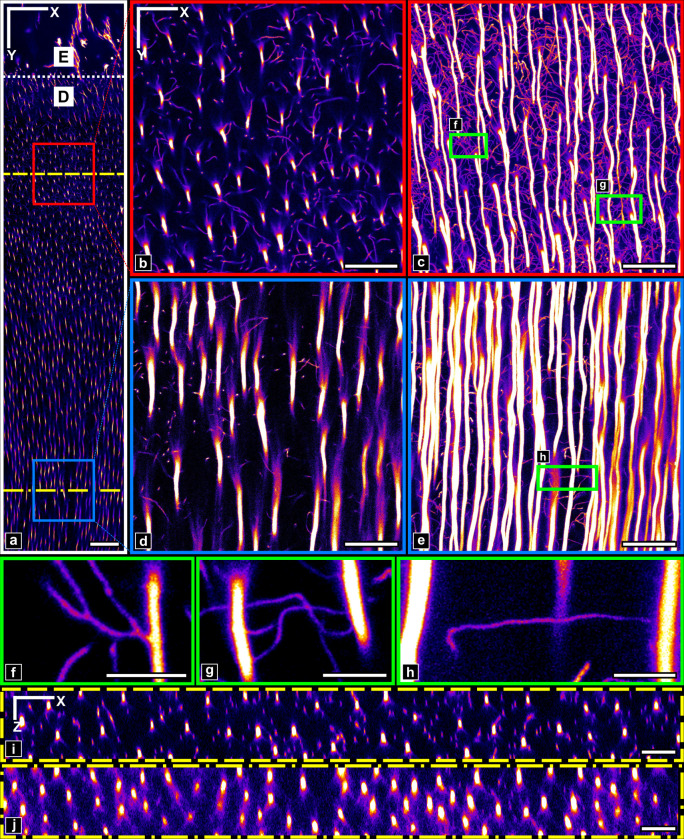
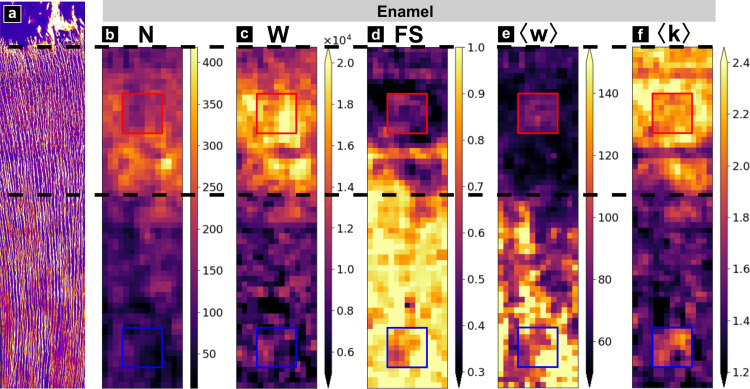
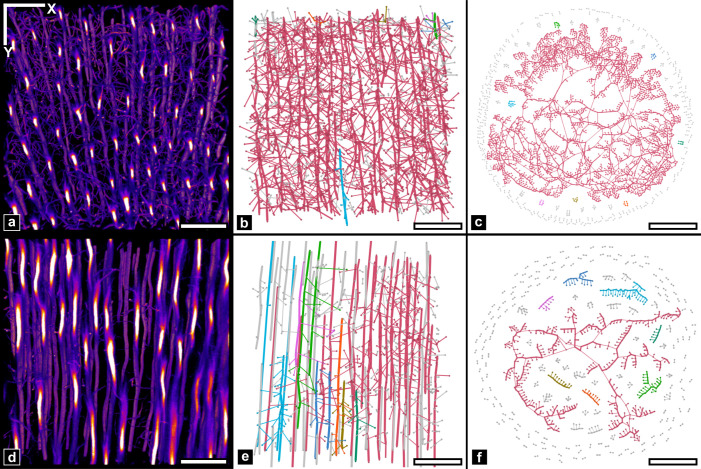
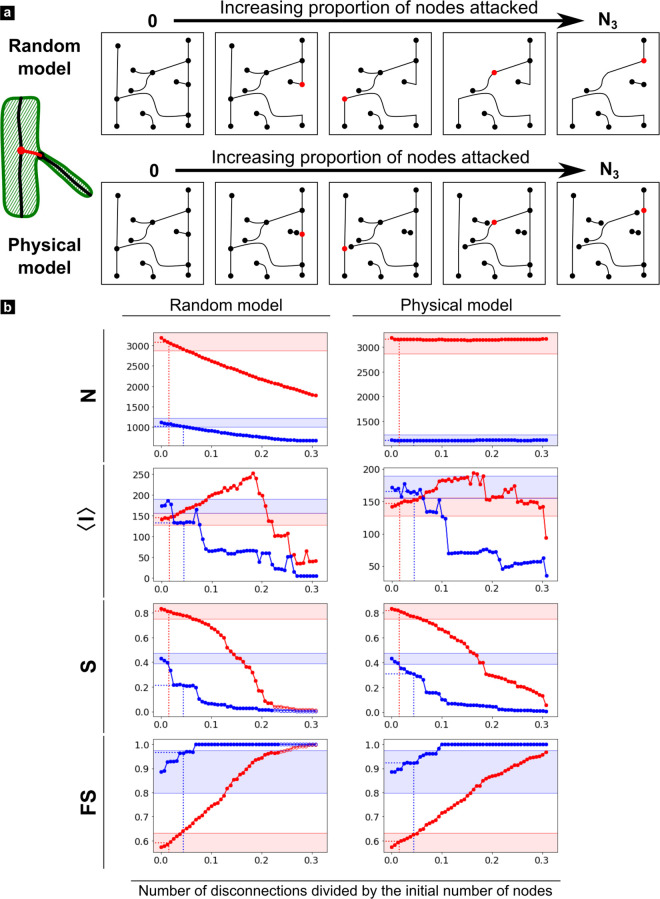
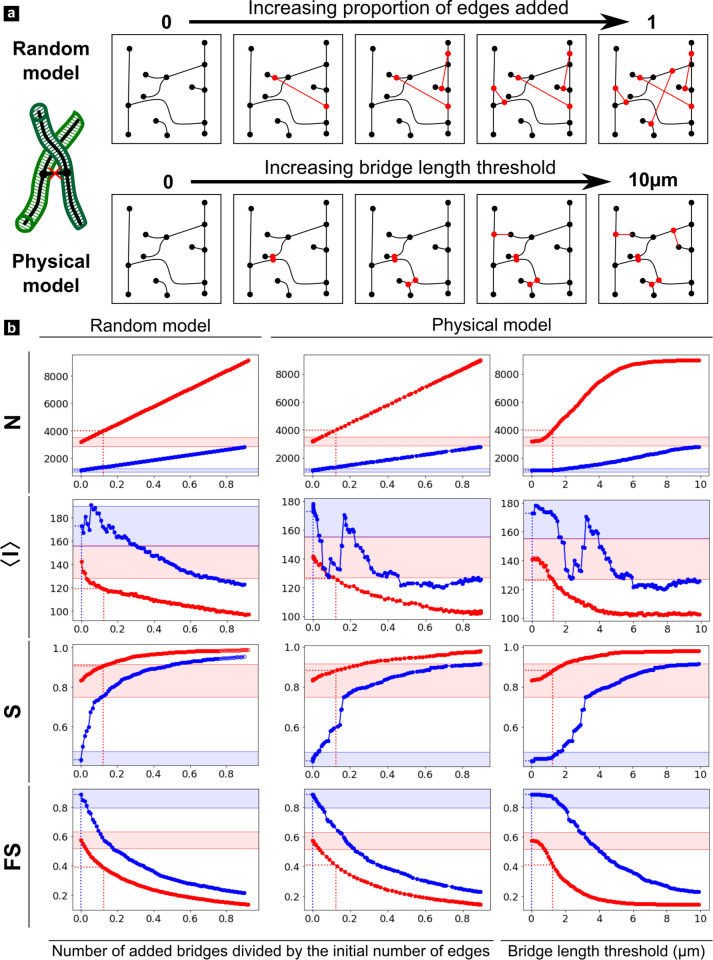
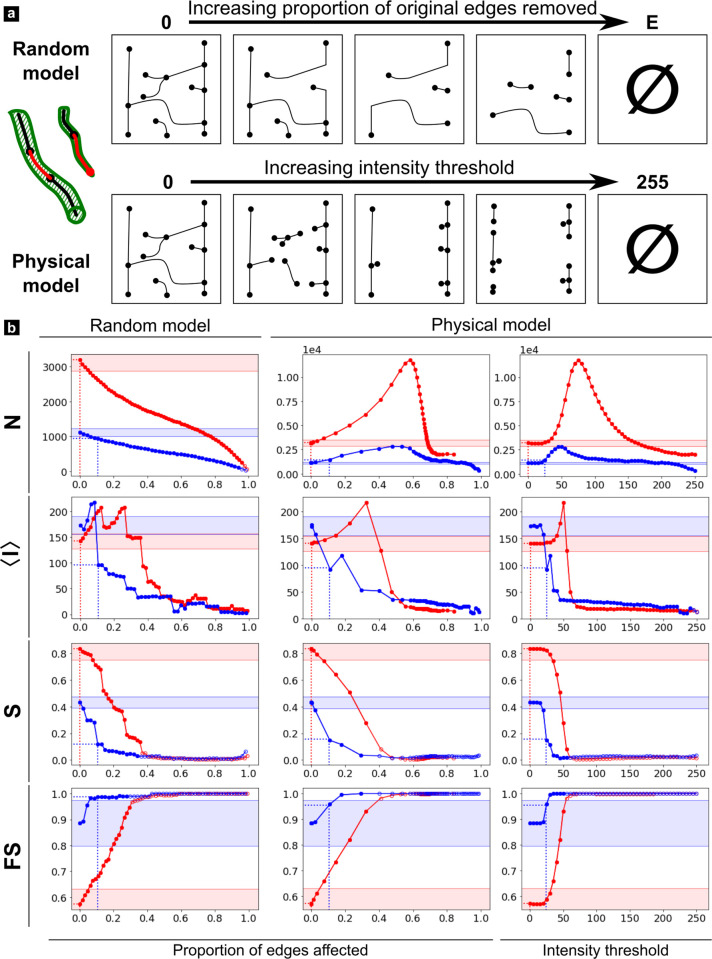
According to the current hydrodynamic theory, teeth sensitivity is mediated by odontoblast cell processes which can be activated by fluid flow in the pericellular space of bulk dentin. To better understand the possible spatial extent of such phenomena, we investigated the topology and connectivity of dentinal porosity of a healthy human tooth. Using confocal fluorescence microscopy, we modeled the porosity as a spatial graph with edges representing dentinal tubules or lateral branches and nodes defining their connections. A large fraction of porosity channels in crown dentin was found to be interconnected, with 47% of nodes linked in a single component over a millimetric distance from the dentin-enamel junction (DEJ). However, significant differences in network topology were also observed. A sharp transition in connectivity from 83% to 43% occurred at 300 µm from the DEJ, which corresponds to an early stage of tooth formation. This was reflected in all graph metrics investigated, in particular the network resilience which dropped by a factor 2. To test the robustness of our observations, an in-depth analysis of potential remaining biases of the graph extraction was conducted. Most graph metrics considered were found to be within a 10% precision range from a manually annotated ground truth. However, path metrics, which characterize transport properties, proved very sensitive to network defects. Residual errors were classified in 4 topological classes related to fluorescence staining and confocal detection efficiency, instrumental resolution and image processing. Their relative importance was estimated using statistical and physical graph attack simulations in a broad experimental range. Our modeling thus provides a practical framework to estimate the interpretability of calculated graph metrics for a given experimental microscopy setup and image processing pipeline. Overall, this study shows that dentin porosity exhibits typical characteristics of a complex network and quantitatively emphasize the importance of the smallest lateral branches. Our results could be used to model fluid flow more accurately in order to better understand mechanosensing by odontoblasts in dentin.
Copyright: © 2025 Chatelain et al. This is an open access article distributed under the terms of the Creative Commons Attribution License, which permits unrestricted use, distribution, and reproduction in any medium, provided the original author and source are credited.
Conflict of interest statement
The authors have declared that no competing interests exist.
Figures
Similar articles
-
Systemic pharmacological treatments for chronic plaque psoriasis: a network meta-analysis.Cochrane Database Syst Rev. 2021 Apr 19;4(4):CD011535. doi: 10.1002/14651858.CD011535.pub4. Cochrane Database Syst Rev. 2021. Update in: Cochrane Database Syst Rev. 2022 May 23;5:CD011535. doi: 10.1002/14651858.CD011535.pub5. PMID: 33871055 Free PMC article. Updated.
-
Systemic pharmacological treatments for chronic plaque psoriasis: a network meta-analysis.Cochrane Database Syst Rev. 2017 Dec 22;12(12):CD011535. doi: 10.1002/14651858.CD011535.pub2. Cochrane Database Syst Rev. 2017. Update in: Cochrane Database Syst Rev. 2020 Jan 9;1:CD011535. doi: 10.1002/14651858.CD011535.pub3. PMID: 29271481 Free PMC article. Updated.
-
Surgical interventions for treating intracapsular hip fractures in older adults: a network meta-analysis.Cochrane Database Syst Rev. 2022 Feb 14;2(2):CD013404. doi: 10.1002/14651858.CD013404.pub2. Cochrane Database Syst Rev. 2022. PMID: 35156192 Free PMC article.
-
Short-Term Memory Impairment.2024 Jun 8. In: StatPearls [Internet]. Treasure Island (FL): StatPearls Publishing; 2025 Jan–. 2024 Jun 8. In: StatPearls [Internet]. Treasure Island (FL): StatPearls Publishing; 2025 Jan–. PMID: 31424720 Free Books & Documents.
-
Signs and symptoms to determine if a patient presenting in primary care or hospital outpatient settings has COVID-19.Cochrane Database Syst Rev. 2022 May 20;5(5):CD013665. doi: 10.1002/14651858.CD013665.pub3. Cochrane Database Syst Rev. 2022. PMID: 35593186 Free PMC article.
References
-
- Magloire H, Maurin JC, Couble ML, Shibukawa Y, Tsumura M, Thivichon-Prince B, et al. Topical review. Dental pain and odontoblasts: facts and hypotheses. J Orofac Pain. 2010;24(4):335–49. - PubMed
MeSH terms
LinkOut - more resources
Full Text Sources
