

The impact of early special educational needs provision on later hospital admissions, school absence and education attainment: A target trial emulation study of children with isolated cleft lip and/or palate
- PMID: 40668838
- PMCID: PMC12266429
- DOI: 10.1371/journal.pone.0327720
The impact of early special educational needs provision on later hospital admissions, school absence and education attainment: A target trial emulation study of children with isolated cleft lip and/or palate
Abstract
Background: Special educational needs (SEN) provision is designed to help pupils with additional educational, behavioural or health needs. Our aim was to assess the impact of early SEN provision on health and educational outcomes for a well-defined population, pupils with cleft lip and/or cleft palate (CLP) without additional anomalies.
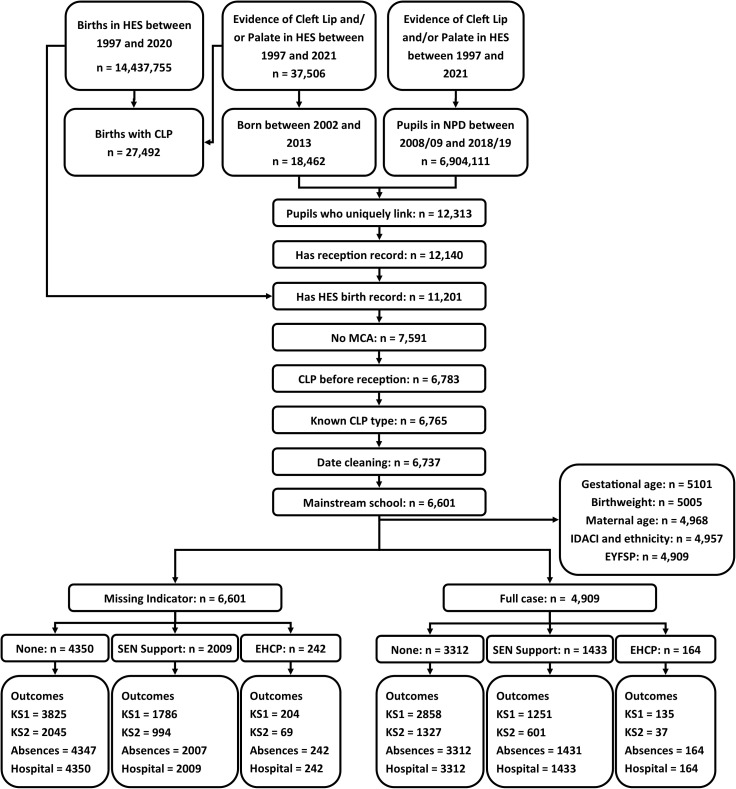
Methods: We used the ECHILD database, which links educational and health records across England. Our target population consisted of children with a recorded diagnosis of CLP without other major congenital anomalies in hospital admission records in ECHILD. We applied a trial emulation framework to define eligibility into our study and investigate the causal impact of SEN provision in the first year of compulsory school (Year 1 - age five/six years) on various health and educational outcomes accumulated by the end of primary education (Year 6 - age ten/eleven years). SEN provision was categorised as: None, SEN Support, and Education and Health Care Plan (EHCP). The outcomes were: unplanned hospital utilisation, medical and unauthorised school absences, persistent absences, and standardised key stage 1 (KS1) and key stage 2 (KS2) mathematics attainment scores. To account for confounding factors affecting the observed associations and estimate the causal effects of early SEN provision on these outcomes, we used three estimating approaches: propensity score-based methods (inverse probability weighting, [IPW]), g-computation, and augmented IPW (AIPW). Causal effects were measured in terms of average treatment effects (ATE) and average treatment effects on the treated (ATT), expressed as rate ratios (RaR) for hospitalisations and absences, risk ratios (RiR) for persistent absences, and mean differences (Δ) for academic scores. Missing values of the confounders were handled via the missing covariate indicator method. We triangulated these results with those obtained by univariable and multivariable regression.
Results: Our study included 6,601 children with CLP and without additional major congenital anomalies. Evaluations involving EHCP were limited by the low numbers of comparative children. Thus, only comparisons of SEN Support (N = 2,009, 31.6%) versus None (N = 4,350, 68.4%) are reported. Observed rates of unplanned hospitalisation (RaRcrude = 1.31, 95% confidence interval (CI): 1.12, 1.52), persistent absence (RiRcrude = 2.21 (1.87, 2.62)) and medical absence (RaRcrude = 1.34 (1.28, 1.40)) were higher amongst children with recorded SEN support, whilst KS1 and KS2 maths scores were lower (Δ crude = -0.85 (-0.90, -0.79) and Δ crude = -0.82 (-0.89, -0.75), respectively). Contrary to the observed relative rates and risks, we found small or no evidence of a causal effect of SEN Support on unplanned hospitalisation (ATE: RaRIPW = 1.16 (1.00, 1.34), RaRg = 0.99 (0.87, 1.12); RaRIAPW = 1.02 (0.87, 1.17) or persistent absences (ATE: RiRIPW = 1.13 (0.92, 1.34); RiRg = 1.08 (0.86, 1.31); RiRAIPW = 1.20 (0.96, 1.45)). We found that SEN support increased rates of medical absences (ATE: RaRIPW = 1.10 (1.04, 1.18); RaRg = 1.09 (1.03, 1.15); RaRAIPW = 1.04 (0.95, 1.13)), decreased those of unauthorised absences (RaRIPW = 0.86 (0.76, 0.97); RaRg = 0.98 (0.86, 1.09); RaRAIPW = 0.80 (0.66, 0.95)) and decreased - but not as extensively as the crude differences suggested- KS1 (ATE: Δ IPW = -0.18 (-0.25, -0.10); Δ g = -0.21 (-0.26, -0.16); Δ AIPW = -0.25 (-0.32, -0.17)) and KS2 maths scores (ATE: Δ IPW = -0.24 (-0.33, -0.15); Δ g = -0.27 (-0.33, -0.21); Δ AIPW = -0.24 (-0.32, -0.17)). Results for the ATT for each of these outcomes were similar to those for the ATE, indicating no observable evidence of heterogeneity of effects by treatment received. Sensitivity analyses confirmed the robustness of these results.
Discussion: In the population of children with CLP without further major congenital anomalies, assignment to receive or not receiving early SEN Support appears to have no harmful impact on the rates of unplanned hospitalisation or persistent absences, but to increase rates of medical absences, whilst reducing rates of unauthorised absences. For the sub-populations of children with key stage results, such hypothetical intervention does not appear to completely reduce the observed disadvantage in KS1 and KS2 mathematics scores. These results relate to the impact of the intention to intervene not the actual delivery of actual SEN Support provision as this information is not available in school administrative records. Furthermore, we cannot discount the impact of unaccounted confounding factors, such as parental education and early home learning environments, particularly for the education attainment results.
Copyright: © 2025 Nguyen et al. This is an open access article distributed under the terms of the Creative Commons Attribution License, which permits unrestricted use, distribution, and reproduction in any medium, provided the original author and source are credited.
Conflict of interest statement
The authors have declared that no competing interests exist.
Figures


Similar articles
-
Early special educational needs provision and its impact on unplanned hospital utilisation and school absences in children with isolated cleft lip and/or palate: a demonstration target trial emulation study protocol using ECHILD.NIHR Open Res. 2023 Oct 24;3:54. doi: 10.3310/nihropenres.13472.1. eCollection 2023. NIHR Open Res. 2023. PMID: 39139277 Free PMC article.
-
Education support services for improving school engagement and academic performance of children and adolescents with a chronic health condition.Cochrane Database Syst Rev. 2023 Feb 8;2(2):CD011538. doi: 10.1002/14651858.CD011538.pub2. Cochrane Database Syst Rev. 2023. PMID: 36752365 Free PMC article.
-
Measures implemented in the school setting to contain the COVID-19 pandemic.Cochrane Database Syst Rev. 2022 Jan 17;1(1):CD015029. doi: 10.1002/14651858.CD015029. Cochrane Database Syst Rev. 2022. Update in: Cochrane Database Syst Rev. 2024 May 2;5:CD015029. doi: 10.1002/14651858.CD015029.pub2. PMID: 35037252 Free PMC article. Updated.
-
Prevention of self-harm and suicide in young people up to the age of 25 in education settings.Cochrane Database Syst Rev. 2024 Dec 20;12(12):CD013844. doi: 10.1002/14651858.CD013844.pub2. Cochrane Database Syst Rev. 2024. PMID: 39704320
-
Signs and symptoms to determine if a patient presenting in primary care or hospital outpatient settings has COVID-19.Cochrane Database Syst Rev. 2022 May 20;5(5):CD013665. doi: 10.1002/14651858.CD013665.pub3. Cochrane Database Syst Rev. 2022. PMID: 35593186 Free PMC article.
References
MeSH terms
LinkOut - more resources
Full Text Sources
Medical
Research Materials
Miscellaneous
