. 2025 Jul 16;23(7):e3002958.
doi: 10.1371/journal.pbio.3002958. eCollection 2025 Jul.

Influenza A virus induces PI4P production at the endoplasmic reticulum in an ATG16L1-dependent manner to promote the egress of viral ribonucleoproteins

Affiliations

Influenza A virus induces PI4P production at the endoplasmic reticulum in an ATG16L1-dependent manner to promote the egress of viral ribonucleoproteins

Carla Alemany et al. PLoS Biol. .

Abstract

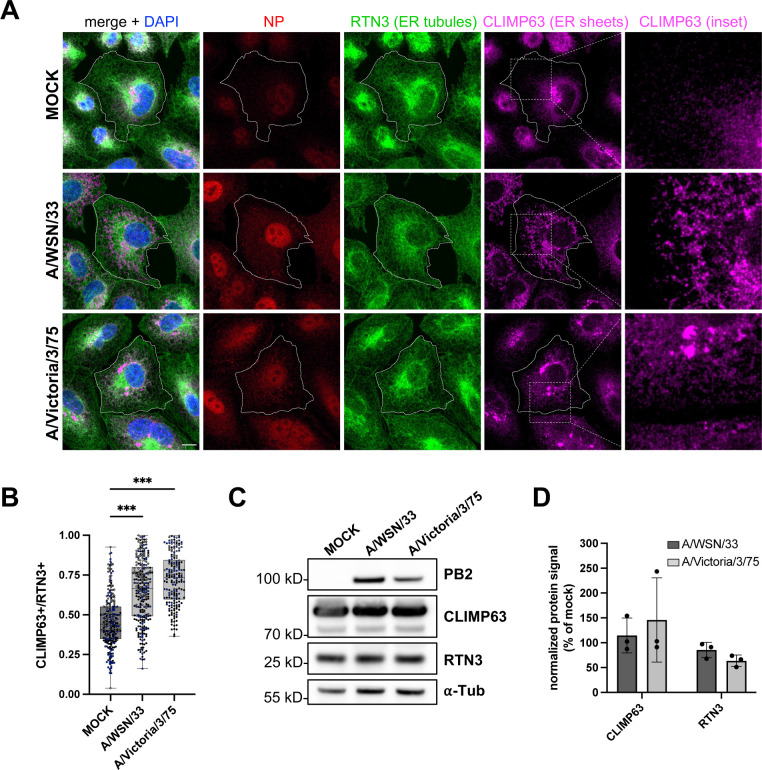
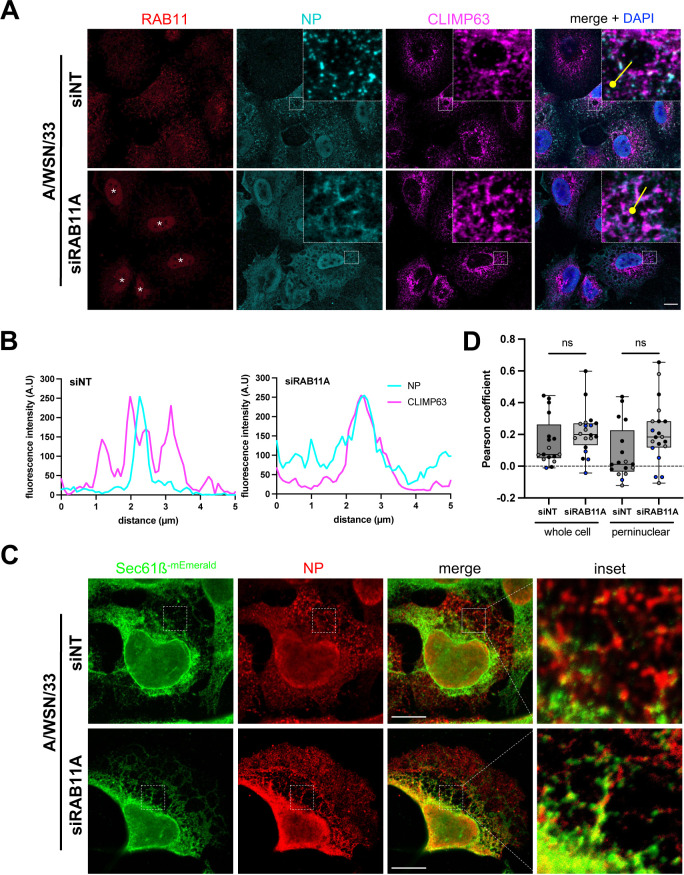
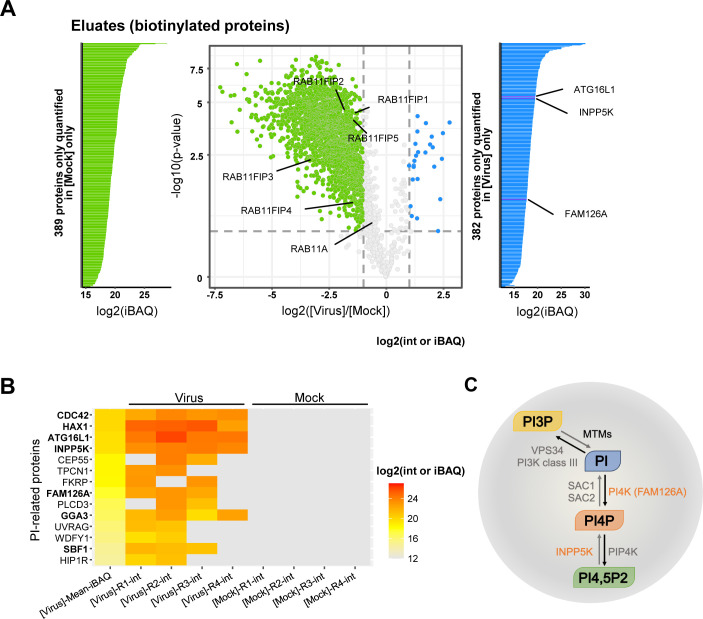
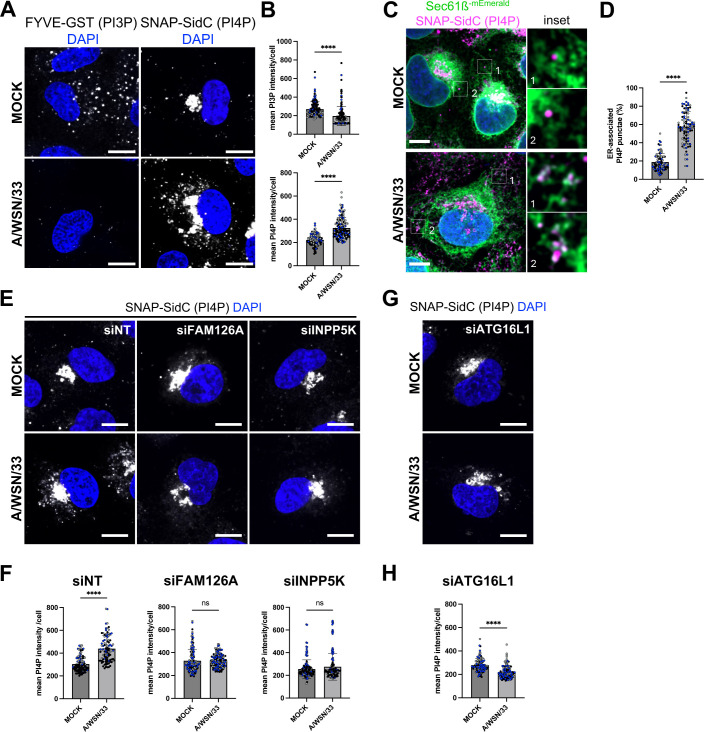
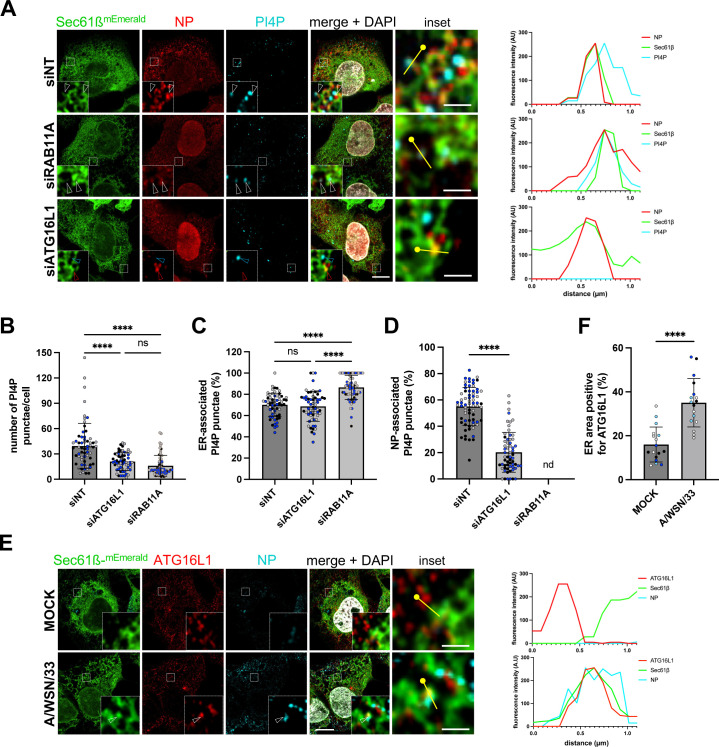
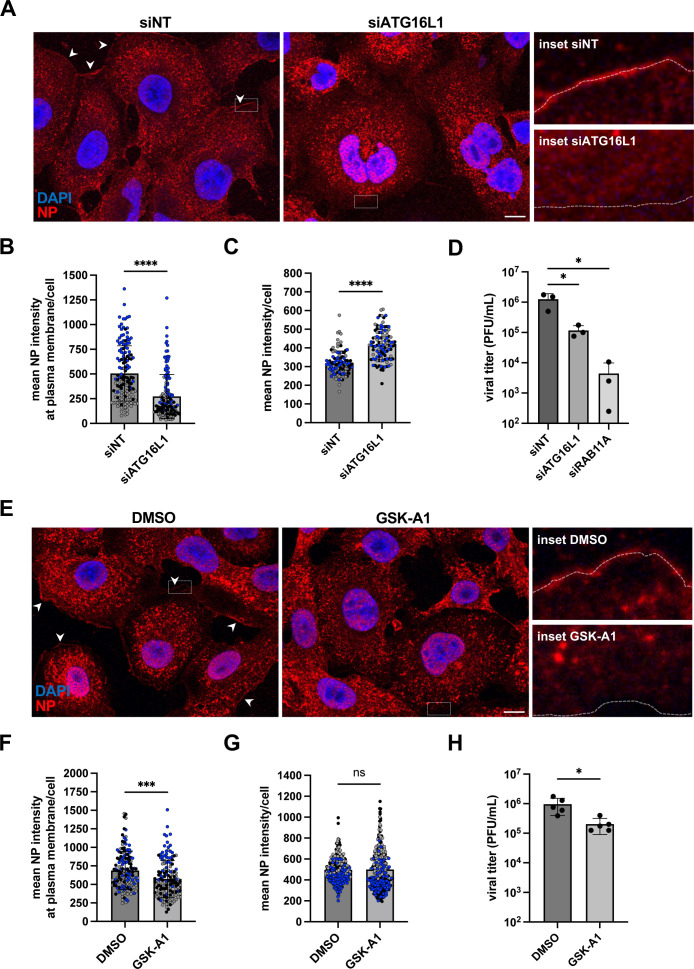
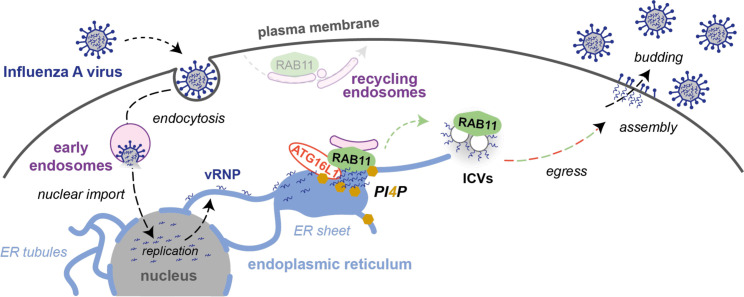
The genomic RNAs of influenza A viruses (IAVs) are replicated in the nucleus of infected cells in the form of viral ribonucleoproteins (vRNPs) before being exported to the cytoplasm. The small GTPase RAB11A is involved in the transport of vRNPs to the sites of viral assembly at the plasma membrane, but the molecular mechanisms involved remain largely unknown. Here we show that IAV infection remodels the architecture of the endoplasmic reticulum (ER) sheets, where vRNPs tend to accumulate in the absence of RAB11A. To decipher the interplay between RAB11A, vRNPs, and the ER, we investigated viral-induced perturbations of RAB11A proximity interactome. To this end, we generated cells stably expressing a TurboID-RAB11A fusion protein and performed biotin-based proximity labeling upon viral infection. We found that cellular regulators of phophatidylinositol-4-phosphate (PI4P) homeostasis, including the autophagic and stress response protein ATG16L1, are significantly enriched at the vicinity of RAB11A in infected cells. Infection induces an increase in cellular PI4P levels in an ATG16L1-dependent manner, while ATG16L1 relocalizes to ER membranes upon infection. Depletion of ATG16L1 decreases the co-distribution of vRNPs with PI4P punctae on ER membranes, and reduces the accumulation of vRNPs at the plasma membrane as well as the production of IAV infectious particles. Our data extend to IAVs the notion that viruses can modulate the metabolism and localization of phosphoinositides to control host membrane dynamics and point to the ER as an essential platform for vRNP transport. They provide evidence for a pivotal role of ATG16L1 in regulating the identity of endomembranes and coordinating RAB11A and PI4P-enriched membranes to ensure delivery of vRNPs to the plasma membrane.


Conflict of interest statement

The authors have declared that no competing interests exist.

Figures

Fig 1
Fig 1. IAV infection specifically remodels ER sheets.
A. A549 cells were infected with WSN or VIC at a MOI of 5 PFU/cell for 8 h, or mock-infected. Fixed cells were stained for the viral NP and the cellular markers for ER sheets and ER tubules, CLIMP63 and RTN3, respectively. The RTN3 staining was used to delineate the cell edges. Nuclei were stained with DAPI (blue), and cells were imaged with a confocal microscope. Scale bar: 10 µm. B. A549 cells treated as in (A) were analyzed with the Cell Profiler software in order to segment CLIMP63+ and RTN3+ areas based on the Otsu thresholding method. The ratios of the CLIMP63+ area to the RTN3+ area are shown. Each dot represents one cell, and the data from three independent experiments are shown (black, gray and blue dots). The median and interquartile values are represented as box-plots (182-262 cells per condition). ***: p-value < 0.001, one-way ANOVA. C, D. A549 cells were infected or mock-infected as in (A). At 8 hpi, total cell lysates were prepared and analyzed by western blot, using the indicated antibodies. (C) Cropped blots of one representative experiment out of three are shown. (D) The signals for CLIMP63 and RTN3 are normalized over the α-tubulin signal and expressed as percentages (100%: mock-infected cells). The data shown are the mean ± SD of three independent experiments. No significant difference is detected between infected and mock-infected cells (two-way ANOVA with Sidak’s multiple comparison test). The data underlying this figure can be found at https://zenodo.org/records/15682874 (raw images), in S4 File (uncropped western blots) and S6 File (graphs raw data).
Fig 2
Fig 2. Impact of RAB11A depletion on ER remodeling and vRNP localization upon infection with the WSN virus.
A. A549 cells were treated with RAB11A-specific or control Non-Target (NT) siRNAs for 48 h, and subsequently infected with WSN at a MOI of 5 PFU/cell for 4 h. Fixed cells were stained for the viral NP and the cellular RAB11 and CLIMP63 proteins. Nuclei were stained with DAPI (blue), and cells were imaged with a confocal microscope. White stars: non-specific nuclear staining visible upon siRNA treatment, unrelated to NP antibody bleed-through as documented in S6A Fig. Scale bar: 10 µm. B. Fluorescence intensity profiles for NP (cyan) and CLIMP63 (magenta) along the yellow lines drawn in panel (A) (merge insets), starting from the knob. C. U2OS cells stably expressing the ER translocon Sec61ß fused to mEmerald (U2OS-Sec61ß-mEmerald) were treated with RAB11A-specific or control Non-Target (NT) siRNAs for 48 h, and subsequently infected with WSN at a MOI of 5 PFU/cell for 8 h. Fixed cells were stained for NP and Sec61ß-mEmerald (anti-GFP antibody) and images were acquired using STED microscopy. Scale bar: 10 µm. D. U2OS-Sec61ß-mEmerald cells treated as in (A) were analyzed to assess co-localization of NP and Sec61ß, using a pixel-based method to determine the Pearson coefficient on a region of interest corresponding to the whole cell or to the perinuclear region, as defined in the Methods section. Each dot represents one cell, and the data from three independent experiments are shown (black, gray and blue dots). The median and interquartile values are represented as box-plots (17–20 cells treated with the NT or RAB11A-specific siRNAs, respectively). ns: non-significant (unpaired t test). The data underlying this figure can be found at https://zenodo.org/records/15682874 (raw images) and S6 File (graphs raw data).
Fig 3
Fig 3. Viral-induced perturbations of RAB11A proximity interactome.
A. Volcano plot showing the log2 fold change (x axis) and its significance (−log10(p-value), y axis) associated to a false discovery rate <1%, for each protein (dots) in eluates from the RAB11A proximity labeling experiment. The log2 fold change refers to the enrichment in WSN-infected (n = 4) vs. mock-infected (n = 4) samples. Blue and green dots represent proteins enriched in WSN-infected vs. mock-infected samples, and proteins enriched in mock-infected vs. WSN-infected samples, respectively. The iBAQ (intensity Based Absolute Quantification) plots shown on the sides of the volcano plot provide additional information on proteins for which no statistical comparison of the abundance could be performed (hence they are not represented in the volcano plot), because they are present only in WSN-infected samples (blue) or in mock-infected samples only (green). B. Heat-map of cellular proteins associated with a GO term or a description containing the term “phosphatidylinositol”, according to the intensity values measured in the IAV-infected (n = 4) or mock-infected (n = 4) samples. On the left side of the heatmap, the “mean iBAQ in IAV” column represents the mean of the iBAQ values in the IAV-infected samples. The iBAQ value approximates the abundance of a protein by dividing the (total precursor) intensities by the number of theoretically observable tryptic peptides of the protein. The same log2 scale is used for intensity values of the replicates and for mean iBAQ values (shown on the right). C. Schematic representation of the enzymatic regulation of the PI3P/PI4P balance. Black and gray arrows represent the activities of the indicated kinases and phosphatase-related proteins, respectively. MTMs: myotubularins; INPP5K: inositol polyphosphate-5-phosphatase K; PI3K, PI4K, PI4PK: PI3-, PI4- and PI4P kinases, respectively; SAC1 and SAC2: PI4P phosphatases. The data underlying this figure can be found in S2 File.
Fig 4
Fig 4. Viral-induced perturbations of the PI3P/PI4P balance.
A. A549 cells were infected with WSN at a MOI of 5 PFU/cell for 8 h, or mock-infected. Fixed cells were stained for PI3P (FYVE-GST probe) or PI4P (SNAP-SidC probe). Nuclei were stained with DAPI (blue), and cells were imaged with a confocal microscope. Scale bar: 10 µm. B. A549 cells treated as in (A) were analyzed with the Fiji software to determine the mean intensity of the PI3P or PI4P signal per cell. Each dot represents one cell, and the data from three independent experiments are shown (black, gray and blue dots). The median and standard deviation values are represented (134-164 cells per condition). ****: p-value < 0.0001, unpaired t test. C. U2OS-Sec61ß-mEmerald cells were infected with WSN at a MOI of 5 PFU/cell for 8 h, or mock-infected. Fixed cells were stained for PI4P as in A and nuclei were stained with DAPI (blue). Cells were imaged with a confocal microscope. Scale bar: 5 µm. D. U2OS-Sec61ß-mEmerald cells treated as in (C) were analyzed with the Fiji software to determine the percentage of the total PI4P punctae associated to ER in individual cells. Each dot represents one cell, and the data from three independent experiments are shown (black, gray and blue dots). The mean and standard deviation values are represented as histograms (87–88 cells per condition). ****: p-value < 0.0001, unpaired t test. E, G. A549 cells were treated with control non-target (NT) siRNAs or with siRNAs targeting FAM126A, INPP5K (E) or ATG16L1 (G) for 48 h, and subsequently infected with WSN at a MOI of 5 PFU/cell for 8 h, or mock-infected. Fixed cells were stained for PI3P or PI4P as in A. Nuclei were stained with DAPI (blue), and cells were imaged with a confocal microscope. Scale bar: 10 µm. F, H. A549 cells treated as in (E) and (G), respectively, were analyzed with the Fiji software to determine the mean intensity of the PI3P or PI4P signal per cell. Each dot represents one cell, and the data from three independent experiments are shown (black, gray and blue dots). The median and standard deviation values are represented (98–152 cells per condition). ****: p-value < 0.0001, ns: non-significant, unpaired t test. The data underlying this figure can be found at https://zenodo.org/records/15682874 (raw images) and S6 File (graphs raw data).
Fig 5
Fig 5. Impact of RAB11A or ATG16L1 depletion on viral-induced production and localization of PI4P.
A. U2OS-Sec61ß-mEmerald cells were treated with control Non-Target (NT) siRNAs or with siRNAs targeting RAB11A or ATG16L1 for 48 h, and subsequently infected with WSN at a MOI of 5 PFU/cell for 8 h. Fixed cells were immunostained for PI4P and NP, and nuclei were stained with DAPI (white). Cells were imaged with a confocal microscope. Whole cell scale bar: 5 µm; insets scale bar: 1 µm; white arrowheads: NP-Sec61ß-PI4P co-distribution; red arrowheads: NP-Sec61ß co-distribution; blue arrowheads: Sec61ß-PI4P co-distribution. For each condition, the graph on the right corresponds to a fluorescence intensity profile for NP (red), Sec61ß (green), and PI4P (cyan) along the yellow line drawn in the inset, starting from the knob. B–D. U2OS-Sec61ß-mEmerald cells treated as in (A) were analyzed with the Fiji software to determine the number of PI4P punctae (B), the percentage of PI4P punctae associated to the ER (C), and the percentage of PI4P punctae associated to NP puncta (D) in individual cells. Each dot represents one cell, and the data from three independent experiments are shown (black, gray, and blue dots). The mean and standard deviation values are represented as histograms (62–70 cells per condition). (B, C) ****: p-value < 0.0001, ns: not significant, two-way ANOVA. (D) ****: p-value < 0.0001, unpaired t test. nd: not determined, because the diffuse cytoplasmic distribution of NP signal in cells treated with the siRNA targeting RAB11A precludes analysis of the percentage of PI4P punctae associated to NP punctae. E. U2OS-Sec61ß-mEmerald cells were infected with WSN at a MOI of 5 PFU/cell for 8 h, or mock-infected. Fixed cells were stained for ATG16L1 and NP, and nuclei were stained with DAPI (white). Cells were imaged with a confocal microscope. Whole cell scale bar: 5 µm; insets scale bar: 1 µm. arrowheads: NP-Sec61ß-ATG16L1 co-distribution. For each condition, the graph on the right corresponds to a fluorescence intensity profile for Sec61ß (green), ATG16L1 (red), and NP (cyan) along the yellow line drawn in the inset, starting from the knob. F. U2OS-Sec61ß-mEmerald cells treated as in (E) were analyzed with machine learning segmentation and Fiji software to determine the percentage of ER area positive for ATG16L1. Each dot represents the mean of multiple cells from one image, and the data from five independent experiments are shown (white, black, gray, blue and light blue dots). The mean and standard deviation values are represented (17 images per condition). ****: p-value < 0.0001, unpaired t test. The data underlying this figure can be found at https://zenodo.org/records/15682874 (raw images) and S6 File (graphs raw data).
Fig 6
Fig 6. Impact of ATG16L1 depletion or GSK-A1 treatment on vRNP egress and viral progeny.
A. A549 cells were treated with the indicated siRNAs for 48 h and subsequently infected with WSN at a MOI of 5 PFU/mL. At 8 hpi, fixed cells were stained for NP and nuclei were stained with DAPI (blue). Cells were imaged with a confocal microscope. Accumulations of NP signal at the plasma membrane are indicated by white arrowheads. Scale bar: 10 µm. The dotted white lines in the insets delineate the cell border. B. A549 cells were treated as in (A) and analyzed with the Fiji software to measure the mean NP signal along a line drawn over the plasma membrane in individual cells. Each dot represents one cell, and the data from three independent experiments are shown (black, gray, and blue dots). The median and standard deviation values are represented (149 cells per condition). ****: p-value < 0.0001, ns: not significant, unpaired t test. C. A549 cells treated as in (A) were analyzed with the Fiji software to determine the mean intensity of NP signal per cell. Each dot represents one cell, and the data from three independent experiments are shown (black, gray, and blue dots). The median and standard deviation values are represented (100–106 cells per condition). ****: p-value < 0.0001, unpaired t test. D. A549 cells were treated with the indicated siRNAs for 48 h and subsequently infected with WSN at a MOI of 0.001 PFU/mL. At 24 hpi, the supernatants were collected and the infectious titers were determined by plaque assay. The mean ± SD of three independent experiments is shown. *: p-value < 0.05, paired t test. E. A549 cells were infected with WSN at a MOI of 5 PFU/mL. Two hours later, the PI4KIIIA inhibitor GSK-A1 drug was added at a final concentration of 100 nM. DMSO at the same concentration was used as a control. At 6 hpi, fixed cells were stained for NP and nuclei were stained with DAPI (blue). Cells were imaged with a confocal microscope. Accumulations of NP signal at the plasma membrane are indicated by white arrowheads. Scale bar: 10 µm. The dotted white lines in the insets delineate the cell border. F. A549 cells were treated as in (E) and analyzed with the Fiji software to measure the mean NP signal along a line drawn over the plasma membrane in individual cells. Each dot represents one cell, and the data from three independent experiments are shown (black, gray, and blue dots). The median and standard deviation values are represented (147 cells per conditions): ***: p-value < 0.001, unpaired t test. G. A549 cells treated as in (E) were analyzed with the Fiji software to determine the mean intensity of NP signal per cell. Each dot represents one cell, and the data from three independent experiments are shown (black, gray, and blue dots). The median and standard deviation values are represented (318–343 cells per condition). ns: non significant, unpaired t test. H. A549 cells were infected with WSN at a MOI of 5 PFU/mL. Two hours later, the GSK-A1 drug was added at a final concentration of 100 nM. DMSO at the same concentration was used as a control. At 6 hpi, the supernatants were collected and the infectious titers were determined by plaque assay. The mean ± SD of 5 independent experiments is shown. *: p-value < 0.05, paired t test. The data underlying this figure can be found at https://zenodo.org/records/15682874 (raw images) and S6 File (graphs raw data).
Fig 7
Fig 7. Model for influenza vRNP transport from the nucleus to the plasma membrane.
Upon influenza virus entry, viral ribonucleoproteins (vRNPs) are imported into the nucleus where they serve as a template for the transcription and replication of the viral genome. The neo-synthesized vRNPs are exported from the nucleus and associate with the endoplasmic reticulum (ER) membrane. Viral infection promotes the remodeling of ER sheets and their extension toward the cell periphery. The recruitment of ATG16L1 to vRNP-enriched ER sites promotes the local production of PI4P and the recruitment of RAB11A. RAB11A, but not ATG16L1, is critical for the biogenesis of vRNP-coated vesicles previously described as irregularly coated vesicles (ICVs) [12]. In addition to RAB11A, ATG16L1 and the PI4P signaling machinery are required for the ICVs to be fully functional and efficiently transported toward the plasma membrane, where viral particles are assembled and bud from the cell surface.

Similar articles

References

    1. Iuliano AD, Roguski KM, Chang HH, Muscatello DJ, Palekar R, Tempia S, et al. Estimates of global seasonal influenza-associated respiratory mortality: a modelling study. Lancet. 2018;391(10127):1285–300. doi: 10.1016/S0140-6736(17)33293-2 - DOI - PMC - PubMed
    1. Wille M, Holmes EC. The ecology and evolution of influenza viruses. Cold Spring Harb Perspect Med. 2020;10(7):a038489. doi: 10.1101/cshperspect.a038489 - DOI - PMC - PubMed
    1. Pohl MO, Lanz C, Stertz S. Late stages of the influenza A virus replication cycle-a tight interplay between virus and host. J Gen Virol. 2016;97(9):2058–72. doi: 10.1099/jgv.0.000562 - DOI - PubMed
    1. Fodor E, Te Velthuis AJW. Structure and function of the influenza virus transcription and replication machinery. Cold Spring Harb Perspect Med. 2020;10(9):a038398. doi: 10.1101/cshperspect.a038398 - DOI - PMC - PubMed
    1. Amorim MJ. A comprehensive review on the interaction between the host GTPase Rab11 and Influenza A virus. Front Cell Dev Biol. 2019;6:176. doi: 10.3389/fcell.2018.00176 - DOI - PMC - PubMed

MeSH terms

LinkOut - more resources