. 2025 Jul 16;21(7):e1011797.
doi: 10.1371/journal.pgen.1011797. eCollection 2025 Jul.

The heme-regulated inhibitor kinase Hri1 is activated in response to aminolevulinic acid deficiency in Schizosaccharomyces pombe

Affiliations

The heme-regulated inhibitor kinase Hri1 is activated in response to aminolevulinic acid deficiency in Schizosaccharomyces pombe

Samuel Plante et al. PLoS Genet. .

Abstract

A key mechanism for regulating the initiation of protein synthesis in response to various stresses involves the phosphorylation of the α subunit of eukaryotic initiation factor 2 (eIF2α). Schizosaccharomyces pombe possesses three distinct eIF2α kinases: Hri1, Hri2, and Gcn2. Using a strain that is unable to synthesize heme de novo (hem1Δ), global transcriptome analysis reveals that among the genes encoding these kinases, hri1+ is the most strongly induced under δ-aminolevulinate (ALA)-limiting conditions. The induction of hri1+ consistently correlates with increased eIF2α phosphorylation and a reduction in global protein translation in ALA-starved hem1Δ cells. In contrast, hem1Δ cells lacking hri1+ (hri1Δ) exhibit poor eIF2α phosphorylation under the same stress conditions. When ALA-starved hem1Δ hri1Δ cells are subsequently transferred to a medium supplemented with exogenous hemin, they exhibit impaired growth compared to ALA-starved hem1Δ cells expressing the endogenous hri1+ allele or hem1Δ hri1Δ hri2Δ gcn2Δ cells expressing functional hri1+ and hri1+-GFP alleles. Consistent with its role as a heme-sensing eIF2α kinase, further analysis by absorbance spectroscopy demonstrates that Hri1 binds to hemin, with an equilibrium dissociation constant (KD) of 0.11 µM. In contrast, a truncated form of Hri1 (from residues 1-185) fails to interact with hemin. Taken together, these findings provide the first report of a fungal eIF2α kinase being activated in response to stress directly linked to a defect in heme homeostasis.


Conflict of interest statement

The authors have declared that no competing interests exist.

Figures

Fig 1
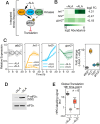
Fig 1. ALA deprivation leads to a shortage of heme in hem1cells.
A, Illustration of a hem1∆-based cellular system used to induce heme deficiency. In this system, endogenous heme production is arrested due to the deletion of Hem1 (hem1∆). Addition of exogenous δ-aminolevulinate (+ALA) restores heme biosynthesis at the second step of the pathway, maintaining high heme levels. In contrast, in the absence of exogenous ALA (-ALA), cellular heme levels are significantly depleted. B, hem1∆ cells were precultured in YES medium containing ALA (25 µM). After washes, the cells were either incubated without ALA supplementation (-ALA) or supplemented with ALA (100 µM). Cell growth was monitored every 10 min for 19 h. The growth curves for three replicates are shown, with solid lines representing the mean values of the replicates. C, Heme content in hem1∆ cells was quantified after 19 h of incubation in either ALA-free medium or medium supplemented with ALA. Total cellular heme content was measured using a fluorometric-based assay and expressed as picomoles of heme per cell. D, Three-dimensional model of heme sensor 1 (HS1) based on protein data bank (PDB) identification numbers 3BXB and 3U8P. E, Representative fluorescence images of mKATE (red) and EGFP (green) from HS1-M7A expressed in hem1∆ cells after 19 h of incubation in either ALA-free medium or medium supplemented with ALA. Differential interference contrast microscopy (Nomarski) was used to examine cell morphology. The scale bar represents 10 µm. F, Whole cell extracts were prepared from aliquots of cultures described in panel E, and analyzed using immunoblot assays with anti-GFP and anti-α-tubulin antibodies. G, hem1∆ cells expressing the heme sensor HS1-M7A were cultured as described in panel B. Changes in the EGFP/mKATE2 fluorescence ratio (green/red) for HS1-M7A were monitored over the indicated times. Dynamic variations in the EGFP/mKATE2 fluorescence ratio were depicted using the averages from six independent experiments.
Fig 2
Fig 2. Transcriptomic analysis of differentially expressed genes in ALA-starved versus ALA-replete hem1Δ cells.
A, Schematic representation of the experimental design for RNA-seq analysis. hem1∆ cells precultured in the presence of ALA (25 µM) were washed and transferred to YES medium either supplemented with 100 µM ALA (+ALA) or left without ALA supplementation (-ALA) for 19 h. RNA was then extracted from each growth condition and used to generate RNA-seq librairies. B, Transcriptome-wide picture of the response to ALA starvation. Differentially expressed genes were analyzed in ALA-starved hem1Δ cells (-ALA) compared to ALA-replete hem1Δ cells (+ALA). A total of 5,780 transcripts were investigated by RNA-seq. While all differentially expressed genes are shown, only 7 are labelled on the graph. Examples of genes induced under low-ALA conditions are highlighted in red, whereas examples of genes repressed (blue) or unregulated (black) under the same conditions are also depicted. The y-axis represents the log2 fold change for each differentially expressed gene. C, Volcano plot showing significant differentially expressed genes in ALA-starved hem1Δ cells (-ALA; red) versus ALA-replete hem1Δ cells (+ALA; blue). The x-axis represents the log2 fold change, while the y-axis represents -log10 (P value) for each significantly differentially expressed gene. D, The heatmap in green exhibits 579 genes with higher expression levels in ALA-starved hem1Δ cells compared to ALA-replete hem1Δ cells. Darker green shades represent higher transcript abundance, whereas lighter green shades indicate lower transcript levels. The heatmap in red displays the average log2 fold change values in expression of the 579 genes induced in ALA-depleted cells (averaging >1.5 fold). E, The green heatmap displays 170 genes with lower expression levels in ALA-starved hem1Δ cells compared to ALA-replete hem1Δ cells. The blue heatmap shows the average log2 fold change values in expression of these 170 genes (averaging <1.5 fold). F - G, Gene ontology analysis of the genes up-regulated (red) or down-regulated (blue) under ALA deprivation conditions. Up-regulated genes encode proteins that are associated with different biological processes, including cellular stress response, protection against oxidative stress, and xenobiotic metabolism. In contrast, down-regulated genes are linked with pathways such as nutrient catabolism, ribosome biogenesis, and cell wall synthesis. H, Transcript log2 fold changes were calculated as the ratio of the expression levels of the indicated gene in ALA-starved hem1Δ cells compared to ALA-replete hem1Δ cells. Colored boxes (orange, gray, red, and blue) represent the quantification from three independent RT-qPCR assays, whereas empty boxes correspond to data analyzed from three separate RNA-seq experiments. Error bars indicate the standard deviation (± SD).
Fig 3
Fig 3. Expression profiles of the hri1+, hri2+, and gcn2+ genes in ALA-starved hem1Δ cells.
A, Schematic representation of the signaling pathway involved in translational inhibition via phosphorylation of eIF2α by the Hri1, Hri2, and Gcn2 kinases in response to ALA deficiency. B, The green heatmap illustrates the transcriptional response from the RNA-seq data presented in Fig 2 for hri1+, hri2+, and gcn2+ mRNAs. Darker green shades indicate higher transcript abundance (log2). Log2 fold change values for the transcripts are shown on the right. C, hem1∆ cells precultured in the presence of ALA (25 µM) were washed and then treated with 100 µM ALA (+ALA) or left without ALA supplementation (-ALA) for 0, 6, 12, and 19 h. Total RNA was isolated from culture aliquots collected at the indicated time points. Following RNA extraction, mRNA levels of hri1+, hri2+, gcn2+, and atb2+ were assessed by RT-qPCR assays. Transcript fold changes (far-right bridge chart) were calculated as the ratio of the expression levels of the indicated gene in ALA-starved cells compared to ALA-replete cells, and shown with gene color codes as follows: gray, atb2+; orange, hri1+; blue, hri2+; and green, gcn2+. D, Phosphorylation of eIF2α was detected in ALA-starved hem1Δ cells. At the 19-h time point, aliquots of the cultures used in panel C were taken to prepare whole cell extracts that were subjected to immunoblot assays. These assays utilized a polyclonal anti-eIF2α antibody and a monoclonal anti-phospho-eIF2α antibody. E, Assessment of global cellular translation in hem1Δ cells either treated with 100 µM ALA (+ALA, gray) or left without ALA supplementation (-ALA, red) for 19 h. In the final 30 min of treatment, HPG (10 µM) was added to cultures and then cells were fixed and permeabilized prior AlexaFluor647 azide fluorophore labelling of HPG-containing polypeptide chains. When indicated, cycloheximide (CHX, 0.1 mg/ml) was added to cultures 30 min prior HPG supplementation to inhibit translation. Bridge chart represents the quantification using the averages of values from six independent translation assays using Click-iT reactions. Error bars indicate the standard deviation (± SD).
Fig 4
Fig 4. Disruption of hri1+ leads to reduced phosphorylation of eIF2α and impairs the recovery process from ALA starvation upon hemin supplementation.
A, The indicated strains were grown in YES medium supplemented with ALA (25 µM). The growth of the strains was monitored at the indicated time points (far-left graph). Strain color codes are as follows: black, hem1Δ; orange, hem1Δ hri1Δ; blue, hem1Δ hri2Δ; green, hem1Δ gcn2Δ; red, hem1Δ hri1Δ hri2Δ gcn2Δ (kinasesΔ). For the next graph, its y-axis represents the number of generations for the indicated strains, calculated based on the total number of cell population doublings over a period of 19 h. The middle-right graph represents the assessment of global cellular translation in the indicated strains grown in the presence of ALA for 19 h. In the final 30 min of proliferation, HPG (10 µM) was added to cultures prior AlexaFluor647 azide fluorophore labelling of HPG-containing polypeptide chains. Bridge chart represents the quantification using the averages of values from three independent translation assays using Click-iT reactions. Error bars indicate the standard deviation (± SD). At the 19-h time point, aliquots of the cultures were taken to prepare whole cell extracts that were subjected to immunoblot assays. These assays utilized a polyclonal anti-eIF2α antibody and a monoclonal anti-phospho-eIF2α antibody. B, the specified strains were precultured in YES medium containing ALA (25 µM). After washes, the strains were incubated without ALA supplementation (-ALA). Cell growth was monitored every 10 min for 19 h (far-left graph). Solid lines represent the mean values of three replicates. The second graph exhibits measurement of cell population doublings over a period of 19 h. Results are shown as averages ± SD of three independent experiments that were performed in biological triplicate. The asterisks correspond to p < 0.1 (*), and p < 0.001 (***) (one-way ANOVA with Dunnett’s multiple comparisons test against ALA-starved hem1Δ cells). The third graph represents the assessment of global cellular translation in the indicated strains incubated in YES medium without ALA supplementation for 19 h. In the final 30 min of incubation, HPG (10 µM) was added to cultures as described in panel A, and its incorporation into proteins, detected using Click-iT chemistry, served as a measure of global cellular translation. At the 19-h time point, aliquots of the indicated strains grown in ALA-deprived media were used to prepare whole cell extracts that were subjected to immunoblot assays. These assays utilized a polyclonal anti-eIF2α antibody and a monoclonal anti-phospho-eIF2α antibody. C, Schematic representation illustrating the hemin-dependent growth defect of the hem1Δ hri1Δ and hem1Δ hri1Δ hri2Δ gcn2Δ (hem1Δ kinases Δ) mutant strains following their culture in an ALA-deficient medium (panel D), where a reduction or absence of eIF2α phosphorylation was observed, respectively. D, The indicated strains were incubated without ALA supplementation (-ALA) for 19 h as described in panel B. At this stage, strains were diluted to an OD600 of 0.1 (zero time point) and then incubated in ALA-free medium supplemented with hemin (1 µM) where cell growth was monitored by measuring optical cell density (left graph). The area under the curve (AUC) for each strain’s growth curve was calculated and plotted in the bridge chart (right graph). Results represent averages ± SD from three independent experiments performed in biological triplicate. The asterisks correspond to p < 0.001 (***) (one-way ANOVA with Dunnett’s multiple comparisons test against ALA-starved hem1Δ cells).
Fig 5
Fig 5. Effect of Lys253Ala mutation on the ability of Hri1 to phosphorylate eIF2α.
A, The indicated strains were incubated in ALA-free medium for 19 h, and cell population doublings were measured during this period (left graph). Strain color codes are as follows: black, hem1Δ; red, hem1Δ hri1Δ hri2Δ gcn2Δ (kinasesΔ); gray, hem1Δ kinasesΔ expressing hri1+; green, hem1Δ kinasesΔ expressing hri1+-GFP; violet, hem1Δ kinasesΔ expressing hri1K253A-GFP. In the final 30 min of incubation in ALA-free medium, strains were treated with HPG (10 µM), then fixed and permeabilized for labelling of HPG-containing polypeptides using AlexaFluor647 azide fluorophore. The bridge chart (right) shows the quantification of translation using the averages of values from three independent assays performed in biological triplicate using Click-iT reactions. Error bars indicate the standard deviation (± SD). B, Whole-cell extracts were prepared from aliquots of cultures described in panel A. Samples were analyzed by immunoblotting using anti-GFP, anti-eIF2α and anti-phospho-eIF2α antibodies. C, hem1Δ hri1Δ hri2Δ gcn2Δ cells expressing hri1+-GFP or hri1K253A-GFP under the control of their own promoters were incubated in YES medium supplemented with ALA (25 µM) or lacking ALA for 19 h. Cells were analyzed by fluorescence microscopy to detect GFP-dependent fluorescence signals (lower panels of each pair). Nomarski optics was used to examine cell morphology. D, A schematic representation illustrates Hri1-dependent phosphorylation of eIF2α when cells were incubated in ALA-deficient medium prior their exposure to exogenous hemin. E, After culturing in ALA-deficient medium, hem1Δ hri1Δ hri2Δ gcn2Δ cells expressing functional hri1+ (gray) or hri1+-GFP (green) alleles restored growth in the presence of exogenous hemin as the sole source of heme. In contrast, cells expressing the hri1K253A (red) or eIF2αS52A (blue) mutant allele exhibited poor grow under these conditions (left graph). The area under the curve (AUC) for each strain’s growth curve was determined and shown in the bridge chart (right graph). Results are shown as averages ± SD of three independent experiments performed in biological triplicate. F, Whole-cell extracts from the indicated strains were analyzed by immunoblot assays using anti-GFP, anti-eIF2α and anti-phospho-eIF2α antibodies.
Fig 6
Fig 6. Hri1 and its paralog Hri2 interact with hemin.
A, Schematic representation of Hri1, Hri2, and the Hri1ΔN mutant. A positive BLOSUM62 score indicates regions of the proteins with conserved amino acid residues, whereas a negative score displays non-conserved residues between Hri1 and Hri2 proteins. The predicted heme-binding domain (HBD) spans residues 44-119 in Hri1 and residues 37-112 in Hri2. The predicted protein kinase domain includes conserved subdomains, shown as hatched regions, covering residues 224-291 and 433-662 in Hri1, and residues 172-252 and 360-583 in Hri2. B, Wild-type Hri1, Hri2, and the Hri1ΔN mutant were expressed in E. coli, purified, and analyzed via differential spectral titration using 5 µM hemin. Titration assays were performed with the indicated increasing concentrations of Hri1, Hri2, or Hri1ΔN. Absorbance changes at the Soret peak (402 nm) were plotted against protein concentrations to generate binding curves. C, Wild-type Hri1 and Hri2 exhibited KD values of 0.11 × 10-6 M and 1.05 × 10-6 M, respectively. In contrast, the Hri1ΔN mutant showed minimal interaction with hemin, precluding the determination of a KD value.

Similar articles

References

    1. Donegan RK, Moore CM, Hanna DA, Reddi AR. Handling heme: The mechanisms underlying the movement of heme within and between cells. Free Radic Biol Med. 2019;133:88–100. doi: 10.1016/j.freeradbiomed.2018.08.005 - DOI - PMC - PubMed
    1. Dutt S, Hamza I, Bartnikas TB. Molecular Mechanisms of Iron and Heme Metabolism. Annu Rev Nutr. 2022;42:311–35. doi: 10.1146/annurev-nutr-062320-112625 - DOI - PMC - PubMed
    1. Reddi AR, Hamza I. Heme Mobilization in Animals: A Metallolipid’s Journey. Acc Chem Res. 2016;49(6):1104–10. doi: 10.1021/acs.accounts.5b00553 - DOI - PMC - PubMed
    1. Severance S, Hamza I. Trafficking of heme and porphyrins in metazoa. Chem Rev. 2009;109(10):4596–616. doi: 10.1021/cr9001116 - DOI - PMC - PubMed
    1. Swenson SA, Moore CM, Marcero JR, Medlock AE, Reddi AR, Khalimonchuk O. From Synthesis to Utilization: The Ins and Outs of Mitochondrial Heme. Cells. 2020;9(3):579. doi: 10.3390/cells9030579 - DOI - PMC - PubMed

MeSH terms

LinkOut - more resources