

Genetic and environmental influences on the distributions of three chromosomal drive haplotypes in maize
- PMID: 40668866
- PMCID: PMC12279129
- DOI: 10.1371/journal.pgen.1011742
Genetic and environmental influences on the distributions of three chromosomal drive haplotypes in maize
Abstract
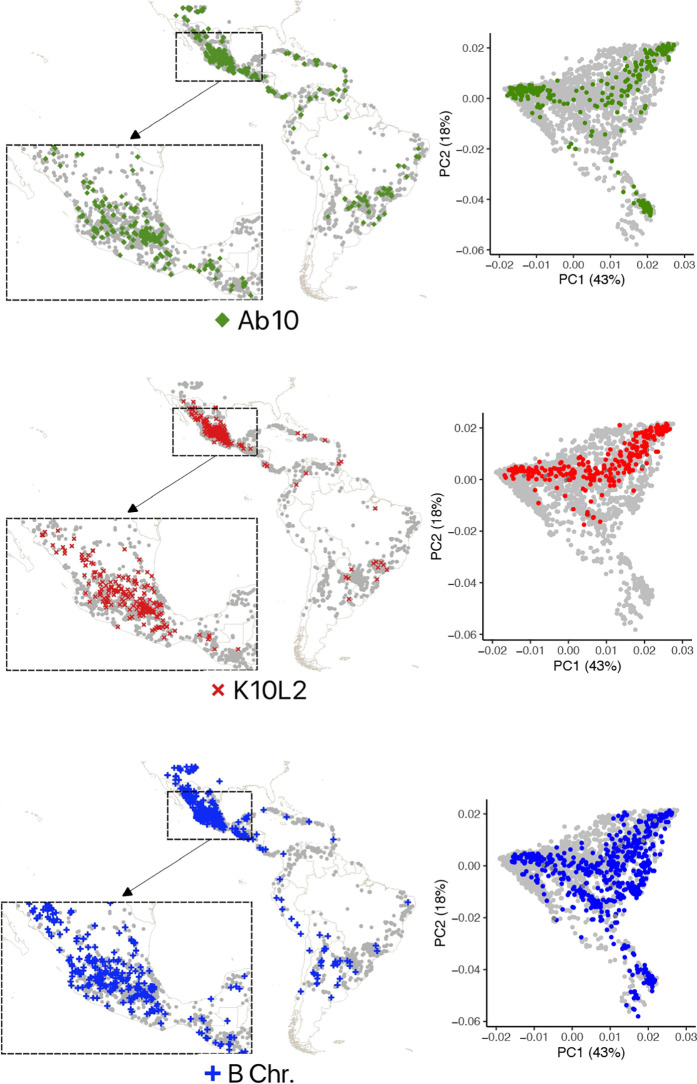
Meiotic drive elements are regions of the genome that are transmitted to progeny at frequencies that exceed Mendelian expectations, often to the detriment of the organism. In maize there are three prevalent chromosomal drive elements known as Abnormal chromosome 10 (Ab10), K10L2, and the B chromosome. There has been much speculation about how these drivers might interact with each other and the environment in traditional maize landraces and their teosinte ancestors. Here we used genotype-by-sequencing data to score more than 10,000 maize and teosinte lines for the presence or absence of each driver. Fewer than ~0.5% of modern inbred lines carry chromosomal drivers. In contrast, among individuals from 5331 open-pollinated landraces, 6.32% carried Ab10, 5.16% carried K10L2, and 12.28% carried at least one B chromosome. These frequencies are consistent with those reported in previous studies. Using a GWAS approach we identified unlinked loci that associate with the presence or absence of the selfish genetic elements. Many significant SNPs are positively associated with the drivers, suggesting that there may have been selection for alleles that ameliorate their negative fitness consequences. We then assessed the contributions of population structure, associated loci, and the environment on the distribution of each chromosomal driver. There was no significant relationship between any chromosomal driver and altitude, contrary to conclusions based on smaller studies. Our data suggest that the distribution of the major chromosomal drivers is primarily influenced by neutral processes and the deleterious fitness consequences of the drivers themselves. While each driver has a unique relationship to genetic background and the environment, they are largely unconstrained by either.
Copyright: © 2025 Brady, Dawe. This is an open access article distributed under the terms of the Creative Commons Attribution License, which permits unrestricted use, distribution, and reproduction in any medium, provided the original author and source are credited.
Conflict of interest statement
The authors have declared that no competing interests exist.
Figures


Update of
-
Genetic and environmental influences on the distributions of three chromosomal drive haplotypes in maize.bioRxiv [Preprint]. 2025 May 27:2025.05.22.655462. doi: 10.1101/2025.05.22.655462. bioRxiv. 2025. Update in: PLoS Genet. 2025 Jul 16;21(7):e1011742. doi: 10.1371/journal.pgen.1011742. PMID: 40501570 Free PMC article. Updated. Preprint.
Similar articles
-
Genetic and environmental influences on the distributions of three chromosomal drive haplotypes in maize.bioRxiv [Preprint]. 2025 May 27:2025.05.22.655462. doi: 10.1101/2025.05.22.655462. bioRxiv. 2025. Update in: PLoS Genet. 2025 Jul 16;21(7):e1011742. doi: 10.1371/journal.pgen.1011742. PMID: 40501570 Free PMC article. Updated. Preprint.
-
Conflicting Kinesin-14s in a single chromosomal drive haplotype.Genetics. 2025 Jul 9;230(3):iyaf091. doi: 10.1093/genetics/iyaf091. Genetics. 2025. PMID: 40365704
-
The Black Book of Psychotropic Dosing and Monitoring.Psychopharmacol Bull. 2024 Jul 8;54(3):8-59. Psychopharmacol Bull. 2024. PMID: 38993656 Free PMC article. Review.
-
Sexual Harassment and Prevention Training.2024 Mar 29. In: StatPearls [Internet]. Treasure Island (FL): StatPearls Publishing; 2025 Jan–. 2024 Mar 29. In: StatPearls [Internet]. Treasure Island (FL): StatPearls Publishing; 2025 Jan–. PMID: 36508513 Free Books & Documents.
-
Signs and symptoms to determine if a patient presenting in primary care or hospital outpatient settings has COVID-19.Cochrane Database Syst Rev. 2022 May 20;5(5):CD013665. doi: 10.1002/14651858.CD013665.pub3. Cochrane Database Syst Rev. 2022. PMID: 35593186 Free PMC article.
References
-
- Lindholm AK, Dyer KA, Firman RC, Fishman L, Forstmeier W, Holman L. The Ecology and Evolutionary Dynamics of Meiotic Drive. Trends in Ecology & Evolution. 2016;31:315–26. - PubMed
-
- Sandler L, Novitski E. Meiotic drive as an evolutionary force. Am Nat. 1957;91:105–10.
MeSH terms
Grants and funding
LinkOut - more resources
Full Text Sources
