. 2025 Jul 16;21(7):e1013247.
doi: 10.1371/journal.pcbi.1013247. eCollection 2025 Jul.

Multi-scale computational modeling towards efficacy in radiopharmaceutical therapies while minimizing side effects: Modeling of amino acid infusion

Affiliations

Multi-scale computational modeling towards efficacy in radiopharmaceutical therapies while minimizing side effects: Modeling of amino acid infusion

Aryan Golzaryan et al. PLoS Comput Biol. .

Abstract

Amino acid infusion (AAI) is a technique used in radiopharmaceutical therapy (RPT) to reduce toxicity in kidney and increase clearance rate of radiopharmaceuticals from body. In this study our aim is to evaluate its effect in personalized RPT considering kidney and salivary glands as dose limiting organs using a multiscale modeling framework. We developed a Physiologically-Based Pharmacokinetic (PBPK) model consisting of 19 compartments, personalized it for four prostate cancer patients using data derived from gamma camera imaging. This model was used to investigate the influence of AAI on the absorbed dose to tumors and organs at risk. We then computed the maximum safe injected activity based on the PBPK model. To address the effects of interstitial fluid pressure (IFP) and tumor heterogeneity, we coupled the PBPK model with convection-diffusion-reaction (CDR) equations. To compare the effectiveness of our modeling approaches, we calculated absorbed doses to the tumors with and without AAI, using both the standalone PBPK model and the coupled PBPK-CDR model. Our findings revealed a relative error (RE) of 9.6% ± 2.2% (mean ± SD) in total tumor absorbed dose calculation between PBPK and CDR equations, attributable to the consideration of IFP. Moreover, AAI proved beneficial for RPT when the kidney was designated as the organ-at-risk. It enabled an increase in radiopharmaceutical injection from 12.3 ± 6.32 MBq (mean ± SD) to 15.45 ± 6.95 MBq (RE: 28.5% ± 15.7%), resulting in a corresponding increase in tumor absorbed dose from 67.8 ± 47.45 Gy to 72.43 ± 51.03 Gy (RE: 8.6% ± 5.4%), while maintaining critical kidney absorbed dose limits. However, this was not observed when the salivary gland was considered the dose-limiting organ. Although, AAI allowed for increased therapeutic injection ranging from 4.22 ± 2.23 MBq to 5.25 ± 3.14 MBq (RE: 19.2% ± 9.9%), it results in a minimal increase in tumor absorbed dose of 0.22 ± 0.04 (RE: 1.4% ± 1.3%). Statistical analysis using the Wilcoxon Signed-Rank Test revealed significant effects of AAI on administered activity and tumor absorbed dose (p-value = 0.007 < 0.05). Finally, a local sensitivity analysis was performed on selected radiation and tumor transportation parameters individually to evaluate their impact on the tumor absorbed dose. In conclusion, selection of organ-at-risk in personalized RPT is critical, as it determines the injected activity amount and the efficacy of delivery-enhancing techniques.


Conflict of interest statement

The authors have declared that no competing interests exist.

Figures

Fig 1
Fig 1. Illustration of the strategy.
(A) A whole-body physiologically based pharmacokinetic (PBPK) model, consisting of 19 compartments, including normal organs and a tumor (prostate cancer), was developed. This model calculates absorbed doses in all orans including tumor and organs-at risk, and determines drug concentration within vascular space of tumor. In this framework, oxygenated blood enters the arterial compartment, from which it is distributed to all tissue compartments based on organ-specific blood flow rates. Blood exiting the tissues flows into the venous compartment and is routed back to the lungs for reoxygenation, thereby completing the circulatory loop. The systemic circulation is simplified into two main compartments—arterial and venous blood—with oxygenated blood from the lungs entering the arterial side directly, bypassing explicit modeling of the heart’s pumping function. Image from Pixabay (https://www.pixabay.com), used under the Pixabay License. (B) A schematic of capillary growth driven by the movement of individual tip endothelial cells (tECs). The migration of each cell, located at the nodes of a computational lattice (finite difference discretization), is governed by five states. These states are determined by coefficients representing the probabilities of the cell remaining stationary (P0) or moving in one of four directions: right (P1), up (P2), left (P3) or down (P4). The processes of anastomosis and branching occur as part of angiogenesis. Tumor induced angiogenesis creates a nonhomogeneous microvessels distribution within the tumor and it defines as tumor vascular space. Image created using Servier Medical Art (https://smart.servier.com/), licensed under CC BY 4.0. (C) The computational domain designed to simulate the spatiotemporal distribution of radiopharmaceuticals, encompassing parent vessels, tumor microvasculature, tumor interstitial space, and surrounding normal host tissue. Using the drug concentration in the tumor’s vascular space, derived from PBPK model, and the synthesized microvasculature, the CDR equations simulate spatiotemporal distribution of radiopharmaceuticals in order to calculate delivered dose to tumor more accurately. More information about mathematical modeling of angiogenesis process and PBPK model provided in S1 Text.
Fig 2
Fig 2. Multi‑Compartment PBPK model and spatial simulation domain for radiopharmaceutical transport in tumor tissue.
(A) Solution domain and microvascular network distribution and Schematic of the Multi-Compartment Model for tumor in radiopharmaceutical therapy. This diagram represents a multi-compartmental physiologically based pharmacokinetic model detailing the distribution and interaction radiopharmaceuticals within four distinct physiological spaces: vascular, interstitial, cell membrane, and intracellular compartments. The transient mass transfer simulation incorporates convective contributions and applies the multi-compartment model to track solute dynamics across the biophysical domains. Key Steps: 1: Physical decay of radionuclide; 2 & 3 Exchange of radiopharmaceuticals between the vascular and interstitial compartments; 4 & 5: Binding and subsequent unbinding of the free drug to receptors on cell membrane; 6: Internalization of peptides that bound to receptors into intracellular space; 7: clearance of radiopharmaceuticals. Image created using Servier Medical Art (https://smart.servier.com/), licensed under CC BY 4.0. (B) Illustration of Solution Domain with Microvascular Network Distribution and Boundary Conditions. The simulation focuses on a tumor with an approximate diameter of 16 mm, embedded in a domain that also includes adjacent normal tissue. The microvascular network comprises vessels with diameters around 20 μm, branching from larger parent vessels of about 400 μm in diameter [118]. Vascular architecture is generated based on the sprouting angiogenesis model originally formulated by Anderson and Chaplain [57,58], with vessel density increasing in response to local concentrations of tumor angiogenic factors. This leads to a complex capillary network with enhanced branching and loop formation in the tumor region. The domain extends 2 mm beyond the tumor margin to capture the full therapeutic range of 177Lu, with emphasis placed on modeling both intratumoral and peritumoral transport phenomena.
Fig 3
Fig 3. The modeling of angiogenesis process over a span of 30 days is depicted and compared qualitatively with actual microvasculature surrounding and within tumors.
The models demonstrate that newly formed blood vessels near and within the tumor exhibit significant branching and looping, consistent with in vivo observations. Comparing angiogenesis models that correspond with in vivo studies highlights that newly formed blood vessels near and within the tumor exhibit significant branching and looping [67]. The timeline includes snapshots at specific intervals: (A) Day 5, (B) Day 25, and (C) Day 30, showing the progression of vascular development in the model. Additionally, (D) represents tumor vasculature captured through optical frequency domain imaging [119], serving as a reference for comparison.
Fig 4
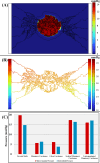
Fig 4. Interstitial fluid pressure (IFP) and intravascular fluid pressure (IVP) validation; (A) Simulated distribution of IFP and (B) IVP within the tumor microenvironment.
These simulations illustrate the elevated internal pressures characteristic of solid tumors. Notably, when an inlet pressure of 25 mmHg is applied, the corresponding microvascular pressure reaches 19.8 mmHg, while the interstitial fluid pressure rises to 14.8 mmHg, indicating a significant internal buildup of pressure within the tumor tissue. (C) An analysis correlating intravascular and interstitial pressure across various tumors in realistic models suggests that both pressures are elevated with a minimal disparity between them [122]. This trend is attributed to structural abnormalities in the tumor vasculature, dysfunctional lymphatic drainage, and the dense packing of tumor cells. Elevated IFP impedes convective transvascular transport and can hinder the delivery and retention of therapeutic agents by promoting outward fluid convection, potentially facilitating drug efflux from the tumor. While this study does not account for lymphatic drainage, monitoring IFP and IFV remains vital for understanding drug delivery dynamics and improving therapeutic strategies in solid tumors.
Fig 5
Fig 5. Validation of PBPK model and parameter estimation.
By employing post-treatment data obtained from γ-camera images for four patients [42], the designed PBPK model is fitted to the acquired data, facilitating the customization of RPT for personalized treatment strategies. Details of the fitting procedures—including optimization techniques and convergence criteria—as well as the statistical outcomes of the parameter estimation are provided in Figs A-D and Tables C-F in S2 Text.
Fig 6
Fig 6. The spatiotemporal distribution of radiopharmaceuticals in tumor interstitial space at (A) 500 min, (B) 1000 min, (C) 3000 min, (D) 6000 min, and (E) 30000 min post-treatment for patient 1.
(F) Different absorbed doses (due to contribution of peptides in interstitial space) calculated by PBPK vs. CDR models.
Fig 7
Fig 7. The spatiotemporal distribution of radiopharmaceuticals that bound to receptors at (A) 500 min, (B) 1000 min, (C) 3000 min, (D) 6000 min, and (E) 30000 min post-treatment for patient 1.
(F) Different absorbed doses (due to the contribution of peptides bound to receptors) calculated by PBPK vs. CDR models.
Fig 8
Fig 8. The spatiotemporal distribution of radiopharmaceuticals that internalized into tumor cells at (A) 500 min, (B) 1000 min, (C) 3000 min, (D) 6000 min, and (E) 30000 min post-treatment for patient 1.
(F) Different absorbed doses (due to the contribution of peptides internalized into cells) calculated by PBPK vs. CDR models.
Fig 9
Fig 9. The spatiotemporal distribution of radiopharmaceuticals is shown for (A) the tumor vascular space and (B) the amount of radiopharmaceuticals in muscle that affect tumor cells, for patient 1, at different time points during treatment.
Fig 10
Fig 10. Comparison of radiopharmaceutical concentration in tumor vascular space, with and without amino acid administration, across 4 mCRPC patients.
The figures show a decrease in the concentration of radiopharmaceuticals in the tumor vasculature following the administration of amino acids.

Similar articles

References

    1. Souri M, Soltani M, Moradi Kashkooli F, Kiani Shahvandi M, Chiani M, Shariati FS, et al. Towards principled design of cancer nanomedicine to accelerate clinical translation. Mater Today Bio. 2022;13:100208. doi: 10.1016/j.mtbio.2022.100208 - DOI - PMC - PubMed
    1. Souri M, Golzaryan A, Soltani M. Charge-Switchable nanoparticles to enhance tumor penetration and accumulation. Eur J Pharm Biopharm. 2024;199:114310. doi: 10.1016/j.ejpb.2024.114310 - DOI - PubMed
    1. Moradi Kashkooli F, Mirala F, H H Tehrani M, Alirahimi M, Souri M, Golzaryan A, et al. Mechanical forces in tumor growth and treatment: perspectives from biology, physics, engineering, and mathematical modeling. WIREs Mech Dis. 2025;17(2):e70000. doi: 10.1002/wsbm.70000 - DOI - PubMed
    1. Butner JD, Dogra P, Chung C, Pasqualini R, Arap W, Lowengrub J, et al. Mathematical modeling of cancer immunotherapy for personalized clinical translation. Nat Comput Sci. 2022;2(12):785–96. doi: 10.1038/s43588-022-00377-z - DOI - PMC - PubMed
    1. Sgouros G, Bodei L, McDevitt MR, Nedrow JR. Radiopharmaceutical therapy in cancer: clinical advances and challenges. Nat Rev Drug Discov. 2020;19(9):589–608. doi: 10.1038/s41573-020-0073-9 - DOI - PMC - PubMed

MeSH terms