. 2025 Jul 16;17(807):eady1135.
doi: 10.1126/scitranslmed.ady1135. Epub 2025 Jul 16.

Donor-recipient mismatch at the SIRPA locus adversely affects kidney allograft outcomes

Affiliations

Donor-recipient mismatch at the SIRPA locus adversely affects kidney allograft outcomes

Daqiang Zhao et al. Sci Transl Med. .

Abstract

Donor-recipient mismatches in histocompatibility antigens recognized by lymphoid cells have been demonstrated to adversely affect allograft outcomes. In contrast, it remains unclear whether mismatches sensed by innate myeloid cells have a similar effect. We investigated the consequences of mismatch in the polymorphic gene encoding signal regulatory protein α (SIRPα) on kidney allograft pathology and survival in mice and humans. We found that SIRPα variants elicit monocyte activation by binding to CD47 and that eliminating SIRPα mismatch or recipient CD47 expression prevented chronic allograft pathology in mice receiving major histocompatibility complex (MHC)-mismatched renal allografts. Human genomic analysis identified two haplotype categories, A and B, encoding SIRPα variants with distinct CD47 binding interfaces. In kidney transplant recipients (N = 455), SIRPα mismatch was associated with increased acute rejection and graft fibrosis in the first posttransplant year, and A recipients of B kidneys had reduced long-term graft survival (hazard ratio, 3.2; 95% confidence interval, 1.5 to 6.9; P = 0.002), a finding that was confirmed in an independent validation cohort (N = 258). Moreover, monocytes in these graft recipients had an activated phenotype. The effects of SIRPα mismatch were independent of ancestry, human leukocyte antigen mismatch, donor-specific antibodies, and delayed graft function. Therefore, these data demonstrate that a donor-recipient mismatch that causes innate immune activation is a determinant of kidney transplantation outcomes.


Conflict of interest statement

Competing interests: D.M.R. serves on the advisory board for Verici Diagnostics and CSL Behring. F.G.L. is a paid consultant for CSL Behring and King Faisal Specialist Hospital & Research Center. O.T. serves on the advisory boards for Novartis, Biotest, Sanofi, Chiesi, Pierre Fabre, and MSD. O.T. also serves as a consultant for Adocia, Hormae, and Xenothera. A.C. serves on the advisory board for Verici Diagnostics and Biohope Pharmaceutical. The other authors declare that they have no competing interests.

Figures

Fig. 1.
Fig. 1.. SIRPα mismatch drives chronic pathology in mouse kidney allografts.
Allogeneic NOD or NOD.B6-Sirpa mouse kidneys were transplanted to bilaterally nephrectomized wild-type (B6) or CD47 knockout (B6.Cd47−/−) recipients (n = 3 to 6 mice per group). NOD.B6-Sirpa mice are NOD congenic mice that are identical to the parental NOD strain except for an ~2–mega–base pair segment that includes B6-Sirpa instead of NOD Sirpa. (A and B) Shown are graft histopathology with quantification of graft infiltrate and fibrosis (A) and enumeration of graft immune cell accumulation (B) at time of harvest 300 to 360 days posttransplantation. Scale bars in (A) indicate a resolution of 500 μm, and red arrows indicate areas of inflammatory infiltrate. Data points in (A) and (B) represent individual mice, and horizontal bars indicate mean. Groups were compared by one-way ANOVA with Tukey’s correction for multiple comparisons. H&E, hematoxylin and eosin; Mono-DC, monocyte-derived dendritic cells.
Fig. 2.
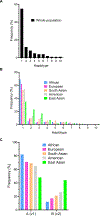
Fig. 2.. SIRPA haplotype distribution in the human population.
Five thousand eight human genome sequences available through the 1000 Genomes Project were analyzed to identify SNPs in the SIRPA gene. (A and B) The 10 most common haplotypes were derived, and their distribution across the whole population (A) and across ethnic groups (B) is shown. (C) Variants v1 to v10 were divided into two classes, A (or v1-like) and B (or v2-like), on the basis of polymorphisms in two amino acids that alter the SIRPα-CD47 binding interface. A and B haplotype frequencies across ethnic groups are shown.
Fig. 3.
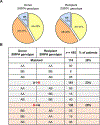
Fig. 3.. Donor and recipient SIRPA genotypes and mismatch categories.
(A and B) Prevalence of SIRPA AA, AB, and BB genotypes (A) and distribution of SIRPA matched, A→B mismatched, and B→A mismatched patients (B) in the study cohort (455 renal transplant donor-recipient pairs).
Fig. 4.
Fig. 4.. SIRPA mismatch is associated with increased acute kidney allograft rejection and fibrosis in humans.
(A to D) SIRPA matched (M), A→B mismatched (A→B), and B→A mismatched (B→A) patients were compared on the basis of rejection diagnosis anytime within the first year after transplantation [no rejection (NR), borderline rejection (BL), or Banff ≥ 1A AR (≥1A-AR)] (A); de novo or persistent delayed AR 5 to 12 months posttransplantation in patients who had at least two biopsies (persistent was defined as AR in someone who had AR in both the early and delayed biopsy, irrespective of treatment) (B); AR-free graft survival (GS) beyond the first year (C); and IFTA categories [minimal (score = 0 to 0.5), mild (1 to 2.5), and moderate or severe (≥3)] (D). Numbers within or above the bars in (A), (B), and (D) represent the percentage of graft recipients in that group. Patient groups were compared by chi-square test in (A), (B), and (D). Survival analysis is reported using the Kaplan-Meier method, and survival curves were compared by log-rank test in (C).
Fig. 5.
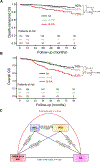
Fig. 5.. SIRPA mismatch is associated with shortened kidney allograft survival in humans.
(A and B) Death-censored (A) and overall GS (B) in matched (M), A→B mismatched (A→B), and B→A mismatched (B→A) patients. Survival analysis is reported using the Kaplan-Meier method, and survival curves were compared by log-rank test in (A) and (B). (C) Mediation analysis of B→A mismatch and death-censored graft loss (GL) demonstrating that GL in B→A mismatched (mm) patients is fully mediated by a combination of tubulointerstitial inflammation (INFL) and IFTA. Shown are the derived coefficients with 95% CIs of the coefficients in parentheses. SIRPA mm status was used as the risk variable, GL as the outcome variable, and both allograft INFL and IFTA by 1 year posttransplantation as the mediators. HLA mismatch, delayed graft function, and donor-specific antibody were the covariates in this model. Black dashed arrows (middle) depict individual effects, the red dashed arrow (top) depicts the total indirect effect, and the black solid arrow (bottom) depicts the total direct effect.
Fig. 6.
Fig. 6.. SIRPA mismatch is associated with shortened kidney allograft survival in humans (Northwestern and combined cohorts).
(A and B) Death-censored (A) and overall GS (B) in matched (M), A→B mismatched (A→B), and B→A mismatched (B→A) patients in the Northwestern University cohort. Survival analysis is reported using the Kaplan-Meier method, and survival curves were compared by log-rank test at 4 and 5 years (*P = 0.036, B→A versus M; P = 0.05 B→A versus A→B; **P = 0.1, B→A versus M; P = 0.2 B→A versus A→B) (#P = 0.04, B→A versus M; P = 0.08, B→A versus A→B; ##P = 0.1, B→A versus M; P = 0.17 B→A versus A→B). (C) The forest plot demonstrates HRs and CIs for 5-year and 4-year death-censored GS in B→A mismatched compared with matched patients for the Northwestern University (NW) and UPMC cohorts separately and together. Also shown are the HRs for death-censored graft survival for both cohorts together after bias-corrected bootstrap validation (1000 and 3000 bootstraps at 99% CI, respectively). HRs were derived using unadjusted Cox proportional hazards analysis.
Fig. 7.
Fig. 7.. B→A SIRPA mismatch is associated with an activated monocyte phenotype in kidney transplant recipients.
(A) Shown are t-SNE plots based on 22 markers using concatenated files of 30,750 monocytes per patient from matched (M, n = 18) and B→A mismatched (B→A, n = 19) renal allograft recipients. (B) Expression as MFI of individual markers from matched (M) and B→A mismatched (B→A) patients. (C) Expression (as MFI) of individual markers from M and B→A patients in the rejector (top) and nonrejector (bottom) groups. Data are presented as mean ± SEM. Data points represent individual patients. Patient groups were compared by Mann-Whitney U test in (B) and (C). PD-L1, programmed cell death ligand 1.

References

    1. Callemeyn J, Lamarthee B, Koenig A, Koshy P, Thaunat O, Naesens M, Allorecognition and the spectrum of kidney transplant rejection. Kidney Int. 101, 692–710 (2022). - PubMed
    1. Oberbarnscheidt MH, Lakkis FG, Innate allorecognition. Immunol. Rev. 258, 145–149 (2014). - PMC - PubMed
    1. Lakkis FG, Li XC, Innate allorecognition by monocytic cells and its role in graft rejection. Am. J. Transplant. 18, 289–292 (2018). - PMC - PubMed
    1. Oberbarnscheidt MH, Zeng Q, Li Q, Dai H, Williams AL, Shlomchik WD, Rothstein DM, Lakkis FG, Non-self recognition by monocytes initiates allograft rejection. J. Clin. Invest. 124, 3579–3589 (2014). - PMC - PubMed
    1. Chow KV, Delconte RB, Huntington ND, Tarlinton DM, Sutherland RM, Zhan Y, Lew AM, Innate allorecognition results in rapid accumulation of monocyte-derived dendritic cells. J. Immunol. 197, 2000–2008 (2016). - PubMed

MeSH terms