. 2025 Jul 18;11(29):eadv4636.
doi: 10.1126/sciadv.adv4636. Epub 2025 Jul 16.

NRBP1 pseudokinase binds to and activates the WNK pathway in response to osmotic stress

Affiliations

NRBP1 pseudokinase binds to and activates the WNK pathway in response to osmotic stress

Ramchandra V Amnekar et al. Sci Adv. .

Abstract

WNK family kinases are regulated by osmotic stress and control ion homeostasis by activating SPAK and OXSR1 kinases. Using a proximity labeling approach, we found that osmotic stress promotes the association of WNK1 with the NRBP1 pseudokinase and TSC22D2/4 adaptor proteins, results that are confirmed by immunoprecipitation, mass spectrometry, and immunoblotting studies. NRBP1 pseudokinase is closely related to WNK isoforms and contains a RΦ-motif-binding conserved C-terminal (CCT) domain, like the CCT domains in WNKs, SPAK, and OXSR1. Knockdown or knockout of NRBP1 markedly inhibited basal as well as sorbitol-induced activation of WNK1 and downstream components. We demonstrate that recombinant NRBP1 can directly induce the activation of WNK4 in vitro. AlphaFold-3 modeling predicts that WNK1, SPAK, NRBP1, and TSC22D4 form a complex, in which two TSC22D4 RΦ-motifs interact with the CCTL1 domain of WNK1 and the CCT domain of NRBP1. Our data indicate that NRBP1 and likely its close homolog NRBP2 function as an upstream activator of the WNK pathway.


Figures

Fig. 1.
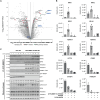
Fig. 1.. WNK1 is associated with NRBP1, TSC22D2, and TSC22D4 during hypertonic stress.
(A) Schematic of the GFP-WNK1, FLAG-TurboID-aGFP6M system. (B) Immunoblots of the indicated cell extracts with or without FLAG-TurboID-aGFP6M expression and/or exogenous biotin treatment. HRP, horseradish peroxidase; GAPDH, glyceraldehyde-3-phosphate dehydrogenase. (C) Schematic of the TurboID-MS experiment under hypertonic stress. GFP-WNK1 knock-in (KI) and wild-type (WT) HEK293 cells expressing FLAG-TurboID-aGFP6M were treated with or without 0.5 M sorbitol for 5 min in the presence of 0.5 mM biotin (n = 5 per treatment group). Streptavidin pulldown was followed by washing, S-trap microcolumn peptide preparation, and MS analysis in DIA mode. Data were processed in Python and visualized using the Curtain tool. Note that G denotes GFP WNK1 KI cells and H denotes WT WNK1 cells; m, no sorbitol; and p, with sorbitol. (D) Top: Volcano plots showing proteins enriched in GFP-WNK1 KI HEK293 cells compared to those in WT HEK293 cells under sorbitol treatment. Proteins highlighted in green include WNK1 and its known interactors (e.g., WNK2, WNK3, SPAK, and OXSR1). Proteins in red represent sorbitol-specific interactors of WNK1. The plots show proteins with ≥2-fold enrichment and statistical significance, normalized to the median intensity of all proteins, with missing values imputed using a Gaussian distribution. P values were adjusted using the Benjamini-Hochberg method, with a significance threshold of corrected P < 0.05. Data are based on four technical replicates per group. Bottom: Box plots showing the median intensities of notable hits identified in the volcano plot. Curtain link: https://curtain.proteo.info/#/84e40fb8-144e-4859-9b2b-924091194344. (E) Box plots of median protein intensities for WNK1 interactors enriched specifically under hypertonic stress conditions. (F) Lysates and streptavidin pulldowns from GFP-WNK1 TurboID cells confirm biotinylation of NRBP1, TSC22D2, and TSC22D4, specifically following hypertonic stress.
Fig. 2.
Fig. 2.. Domain organization of NRBP1, TSC22D2, and TSC22D4.
(A) Phylogenetic tree displaying evolutionary relationship between WNK kinases (highlighted in red) and the pseudokinases NRBP1 and NRBP2 (highlighted in green). (B) Schematic representation of the domain organization of human NRBP1, TSC22D2, TSC22D4, and WNK1 proteins. Key domains include the TSC-TGFβ1–stimulated clone 22 domain (TSC-TGFβ1), BC box (Elongin B and C binding domain), Src homology (SH) domain, and CCT domains. The Rϕ motifs (critical for interaction) are highlighted in red, with two motifs in TSC22D2/4 and five motifs in WNK1. (C and D) Predicted structural models of full-length NRBP1 and TSC22D2/4 proteins generated using AF3. (E) AF3-predicted structures of TSC22D2/4 homo- and heterodimers, focusing on the highly structured C-terminal TSC22 domain. Only the TSC22 domains are depicted, showing multiple contact sites critical for dimerization. (F) Co-immunoprecipitation assay in HEK293 cells co-transfected with GFP-TSC22D2/4 full-length (FL) WT and C-terminal deletion mutants of FLAG-TSC22D2. TSC22D2Δ refers to the TSC22D2 mutant lacking residues C-terminal to N690, while TSC22D4Δ lacks residues C-terminal to N320. Immunoprecipitation and immunoblotting confirmed homo- and heterodimerization of the full-length and mutant proteins. The experiment was performed in two biological replicates (N = 2), each having two technical replicates (n = 2).
Fig. 3.
Fig. 3.. CCT like domain of NRBP1 interacts with the RϕXX motifs of TSC22D2 and TSC22D4.
(A) Structural modeling using AF3 reveals the molecular interaction between TSC22D2 and NRBP1. Residues 158 to 184 of TSC22D2, containing RΦ motif B, directly interact with NRBP1’s CCT-like domain. (B) Two glutamate residues (Glu484 and Glu492) in the CCT-like domain of NRBP1 form salt bridges with Arg179 of TSC22D2’s motif B. Additionally, Trp180 of TSC22D2 embeds into a hydrophobic pocket of NRBP1’s CCT domain, involving residues Leu462, Leu464, Leu476, Cys478, Leu489, Leu493, Leu496, and Phe498. Cys182 of TSC22D2 further stabilizes this interaction via hydrophobic interactions with Leu476 and Phe498 of NRBP1. Conservation analysis using ConSurf (83) demonstrates high evolutionary conservation of RΦ motifs A and B, underscoring their functional significance. (C) Left: HEK293 cells stably expressing HA-NRBP1 were transfected with FLAG-TSC22D2 mutants harboring alterations in RΦ motifs A and B. After 36 hours, HA immunoprecipitation was performed to assess the interaction between NRBP1 and TSC22D2 mutants. FLAG-TSC22D2 levels in the HA-IP fraction were normalized to those in whole-cell lysates for analysis. Right: Densitometric analysis of the immunoprecipitated samples from two independent experiments (N = 2), each performed in duplicate (n = 2). (D) Left: HEK293 cells were co-transfected with GFP-TSC22D2 WT and HA-NRBP1 WT and the indicated mutants for 36 hours. GFP immunoprecipitation was performed to assess the interaction between TSC22D2 and NRBP1 mutants. HA-NRBP1 levels in the IP fraction were normalized to GFP TSC22D2 levels for analysis. Right: Densitometric analysis of the immunoprecipitated samples from two independent experiments (N = 2), each performed in duplicate (n = 2).
Fig. 4.
Fig. 4.. WNK1 directly phosphorylates NRBP1 in vitro and in cells.
(A) Autoradiograph (top) and Coomassie-stained gel (bottom) showing phosphorylation of NRBP1 by the WNK1 kinase domain (residues 1 to 661) in an in vitro kinase assay. (B) MS/MS spectra confirming phosphorylation of the NRBP1 peptide at Thr232, the putative T-loop phospho-acceptor residue. Data are from three technical replicates for each condition. (C) Protein sequence alignment of T-loops from NRBP1, SPAK (STK39), and OXSR1 (OXR1), highlighting Thr232 of NRBP1 as a conserved phosphosite. The alignment was performed using MUSCLE (84) and visualized with Jalview (85), demonstrating motif similarity to other known T-loop phosphorylation sites. (D) Immunoblot analysis using a sheep phospho-specific NRBP1 Thr232 antibody confirms phosphorylation in a kinase assay with GST-tagged NRBP1 (WT) and a Thr232A mutant by recombinant GST-WNK1 kinase domain (2 to 661). (E) Immunoblot analysis of GFP-NRBP1, TSC22D2, and TSC22D4 immunoprecipitated from GFP-NRBP1 KI HEK293 cells treated with 0.5 M sorbitol for various time points. Whole-cell lysates were also analyzed to assess phosphorylation dynamics. Data represent two independent experiments, each with two technical replicates. (F) Immunoblot analysis showing the impact of WNK463 (pan-WNK inhibitor) and WNKC11/12 (WNK1/3-specific inhibitors) on NRBP1 phosphorylation and the broader WNK pathway. Both whole-cell lysates and immunoprecipitated NRBP1 complexes were analyzed. For (E) and (F), representative blots from one experiment are shown, with two independent experiments performed, each with two technical replicates.
Fig. 5.
Fig. 5.. NRBP1 regulates the WNK1 pathway.
(A) Cartoon illustration depicting the inducible degradation system used for NRBP1. NRBP1 was N-terminally tagged with the bdTag (BromoTag), which, upon binding to the AGB1 compound, is directed to the proteasome for degradation. (B) Bromotag-NRBP1 KI HEK293 cells were treated with increasing concentrations of AGB1 (active compound) or cis-AGB1 (negative control inactive compound) for 3 hours. Lysates were subjected to immunoblotting to assess dose-dependent degradation of NRBP1. (C) Left: Time-dependent degradation of NRBP1 was analyzed alongside the WNK1 signaling pathway. BromoTag-NRBP1 KI HEK293 cells were treated with 100 μM AGB1, followed by 0.5 M sorbitol for 30 min. The impact on WNK pathway markers was assessed by immunoblotting. Right: Densitometric analysis of immunoblot results showing the changes in WNK pathway activation. Data represent the result of three independent experiments (N = 3), each with two technical replicates (n = 2). h, hours. (D) Top: The impact of NRBP1 knockout on WNK1 activation (pWNK1-S382) was assessed by immunoprecipitating endogenous WNK1 and immunoblotting. Bottom: Densitometric analysis of the western blots were performed. Data represent the result of three independent experiments (N = 3), each with two technical replicates (n = 2). (E) The impact of NRBP1 knockout and rescue with either WT NRBP1 or the Thr232A mutant was assessed on the WNK pathway by immunoblot analysis. Bottom: Densitometric analysis of the western blots was performed. Data represent the result of three independent experiments (N = 3), each with two technical replicates (n = 2). For (C) to (E), statistical analysis was performed using two-way analysis of variance (ANOVA) with Šidák’s multiple comparisons test (**P < 0.01; ***P < 0.001; ****P < 0.0001). n.s., not significant.
Fig. 6.
Fig. 6.. NRBP1 interactors.
(A) Schematic representation of the MS protocol used to identify NRBP1 interactors under basal and sorbitol stress conditions. GFP-NRBP1 KI HEK293 cells and WT HEK293 cells (negative control) were treated with or without 0.5 M sorbitol for 30 min (N = 5 for each group). Following GFP-magnetic bead pulldown and washing, samples were processed for MS using S-trap microcolumns according to the manufacturer’s protocol. Peptides were identified in DIA mode, analyzed in Python, and visualized with the Curtain tool. Note: Gm-GFP NRBP1 cells without sorbitol, Gp-GFP NRBP1 cells with sorbitol, Hm-WT NRBP1 cells without sorbitol, and Hp-WT NRBP1 cells with sorbitol. (B) Volcano plot showing proteins significantly enriched (≥4-fold) as NRBP1 interactors under unstimulated conditions. GFP-NRBP1 intensities were normalized to WT-NRBP1, and statistical significance was determined using Benjamini-Hochberg correction. Proteins with corrected P values of <0.05 were considered significant. Data from four technical replicates per group were visualized using the Curtain 2.0 tool. Curtain link: https://curtain.proteo.info/#/a38745d4-927f-411e-a89d-b10e6bdd2f9c. (C) Box plots showing normalized protein intensities of the interactors identified as significant in the volcano plot (B). (D) Selected NRBP1 interactors identified in MS were validated by Western blotting. Experiments were performed twice, with three technical replicates confirming the enrichment of interactors detected in the MS analysis.
Fig. 7.
Fig. 7.. NRBP1 differential interactors.
(A) Volcano plot displaying NRBP1 interactors significantly enriched (≥2-fold) following treatment with 0.5 M sorbitol. GFP-NRBP1 intensities were normalized to WT-NRBP1 within the sorbitol-treated group. Statistical significance was determined using Benjamini-Hochberg correction, with proteins considered significant at a corrected P value of <0.05. Data represent four technical replicates per group, visualized using the Curtain tool. Curtain link: https://curtain.proteo.info/#/6a8a5480-b5db-4c1e-ab94-c7403a37f850. (B) Box plots showing normalized protein intensities for the significant hits identified in the volcano plot (A). (C) Key NRBP1 differential interactors identified by MS were validated by Western blotting. Experiments were performed twice, with three technical replicates confirming the enrichment of interactors detected in the MS analysis.
Fig. 8.
Fig. 8.. WNK4 is activated in vitro by NRBP1 and NRBP2.
(A) The activation of WNK4 by NRBP1 was assessed through an in vitro kinase assay. The reaction included GST-WNK4 (residues 1 to 469), GST-NRBP1, and His-SUMO-OXSR1 (D164A, a catalytically inactive mutant). The reaction products were analyzed by immunoblotting to detect WNK4 activation as well as phosphorylation of OXSR1 and NRBP1. Representative results from two independent experiments, each performed with two technical replicates, are shown. Asterisk (*) indicates that the blotting was performed with the pWNK1-S382 and pSPAK-S371 antibody that detects the consensus phosphosite in WNK4 and OXSR1, respectively. (B) The activation of WNK4 by NRBP2 was assessed through an in vitro kinase assay using MBP-tagged NRBP2 as mentioned in (A).
Fig. 9.
Fig. 9.. AF3 modeling of the WNK1-SPAK NRBP1 and TSC22D4 complex.
(A) A structural model of WNK1 in complex with SPAK, NRBP1, and a TSC22D4 homodimer, generated using AF3. The model is shown both as a complete assembly and disassembly into individual components, highlighting key structural domains. The conserved CCT domains in NRBP1 and TSC22D4 are labeled. (B) As in (A), but showing only the kinase domains, CCT domains, and RΦ motifs within the WNK1-NRBP1-TSC22D4 complex. The NRBP1 T232 site has been highlighted in black. (C) Detailed view of the active site of WNK1 kinase, showing ATP positioned near key phosphorylation sites on SPAK (Thr231, Ser371, and Ser385).

References

    1. Xu B., English J. M., Wilsbacher J. L., Stippec S., Goldsmith E. J., Cobb M. H., WNK1, a novel mammalian serine/threonine protein kinase lacking the catalytic lysine in subdomain II. J. Biol. Chem. 275, 16795–16801 (2000). - PubMed
    1. Alessi D. R., Zhang J., Khanna A., Hochdorfer T., Shang Y., Kahle K. T., The WNK-SPAK/OSR1 pathway: Master regulator of cation-chloride cotransporters. Sci. Signal. 7, re3 (2014). - PubMed
    1. Vitari A. C., Deak M., Morrice N. A., Alessi D. R., The WNK1 and WNK4 protein kinases that are mutated in Gordon’s hypertension syndrome phosphorylate and activate SPAK and OSR1 protein kinases. Biochem. J. 391, 17–24 (2005). - PMC - PubMed
    1. Vitari A. C., Thastrup J., Rafiqi F. H., Deak M., Morrice N. A., Karlsson H. K., Alessi D. R., Functional interactions of the SPAK/OSR1 kinases with their upstream activator WNK1 and downstream substrate NKCC1. Biochem. J. 397, 223–231 (2006). - PMC - PubMed
    1. Xu B. E., Min X., Stippec S., Lee B. H., Goldsmith E. J., Cobb M. H., Regulation of WNK1 by an autoinhibitory domain and autophosphorylation. J. Biol. Chem. 277, 48456–48462 (2002). - PubMed

MeSH terms

Substances