. 2025 Jan-Dec;19(1):e70028.
doi: 10.1049/syb2.70028.

Characterising and Evaluating the Immune Microenvironment Landscapes of Colorectal Cancer Shaped by Different Therapies

Affiliations

Characterising and Evaluating the Immune Microenvironment Landscapes of Colorectal Cancer Shaped by Different Therapies

Chen Zhou et al. IET Syst Biol. 2025 Jan-Dec.

Abstract

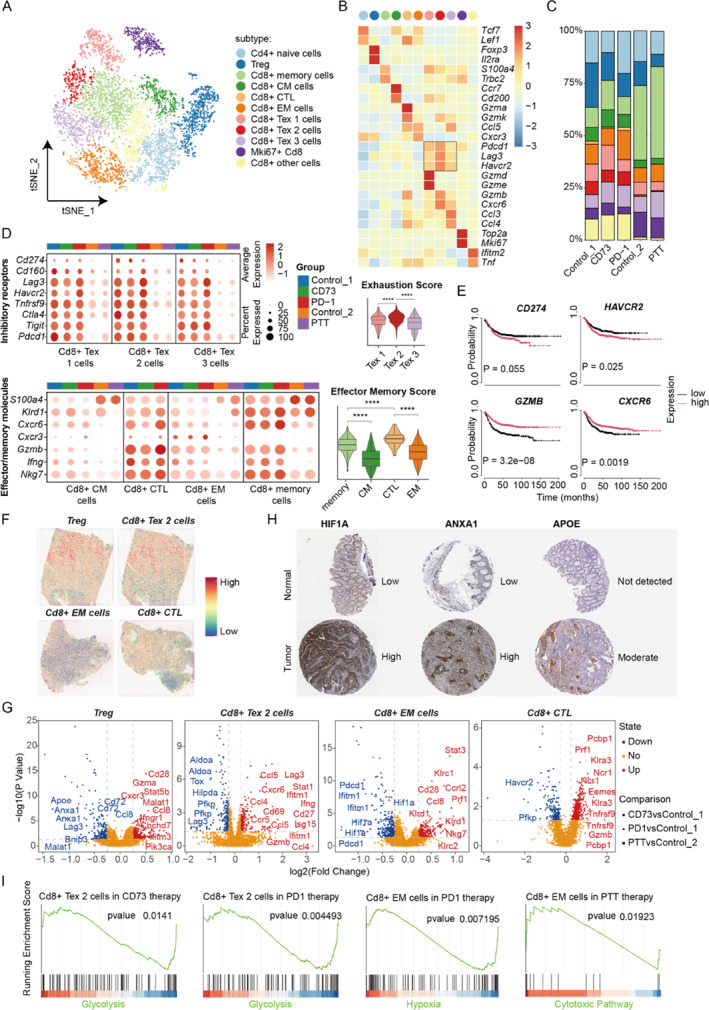
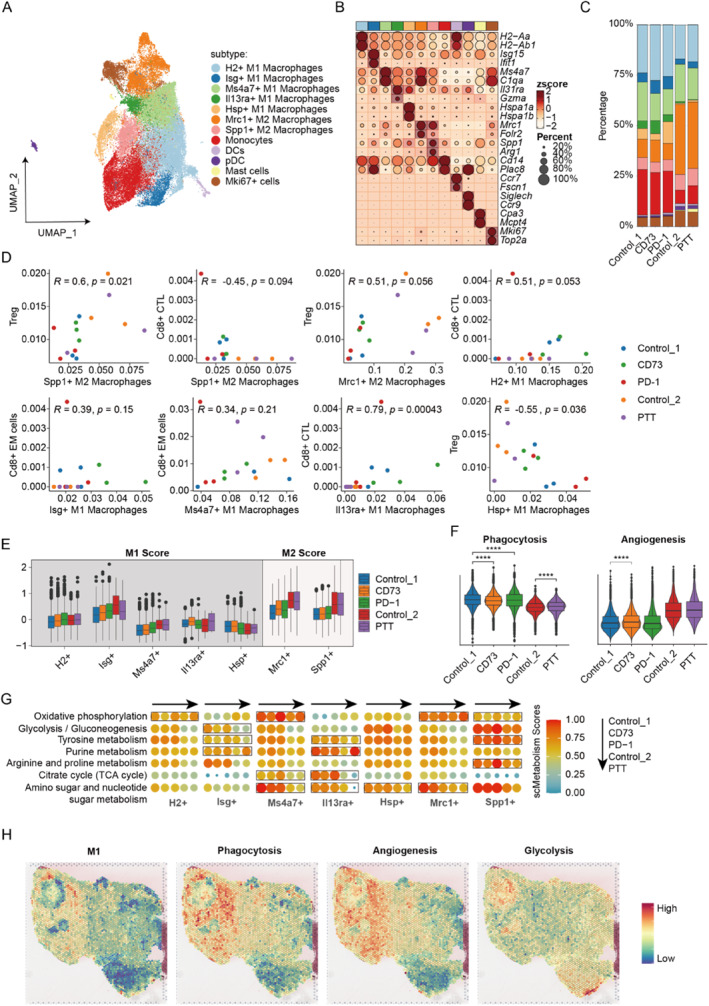
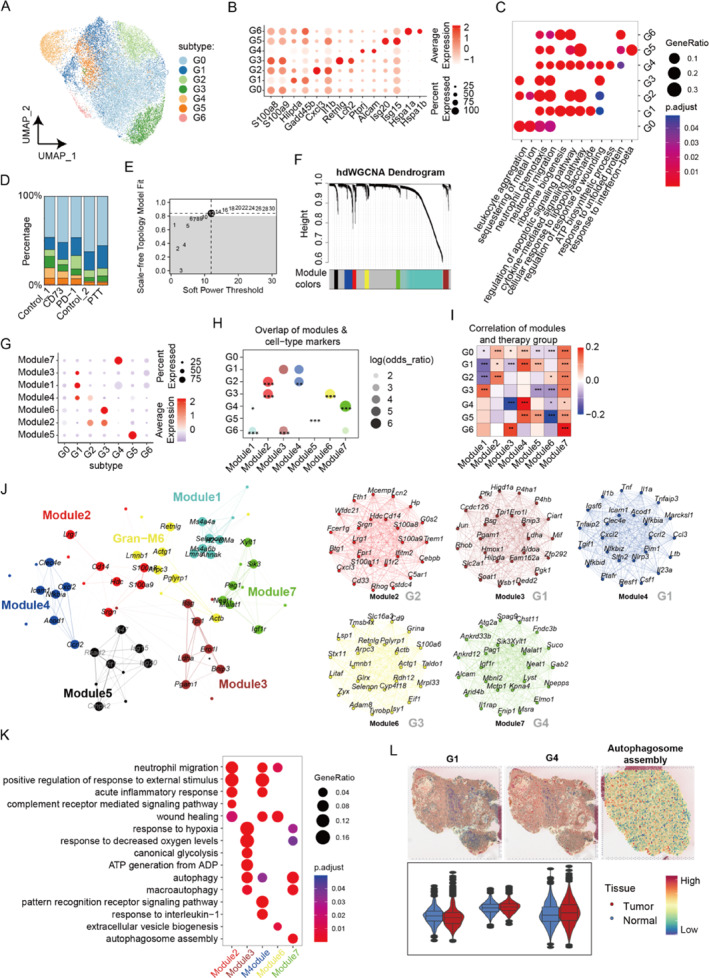
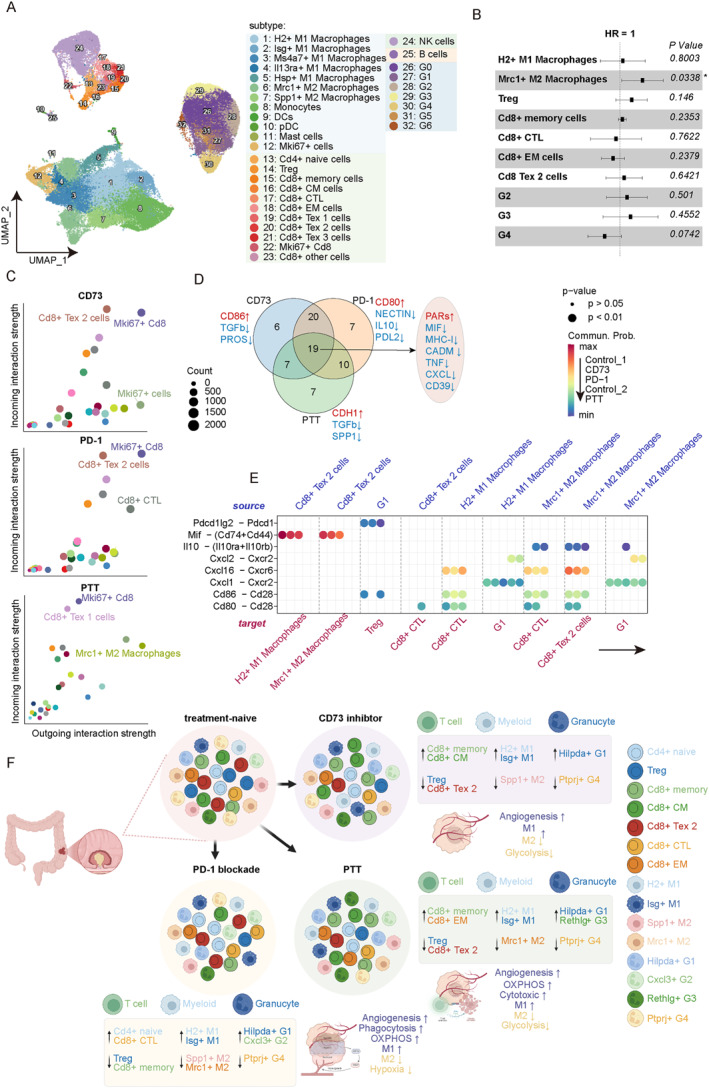
Colorectal cancer (CRC) occurs as the third most common cancer with high mortality across the world. Understanding the intratumoral immune cell heterogeneity and their responses to various therapies is crucial for enhancing patient outcomes. This study aimed to characterise and evaluate the immune microenvironment landscapes of CRC shaped by different therapies including CD73 inhibitor, PD-1 blockade and photothermal therapy (PTT). Our investigation revealed that three therapies could commonly modulate the down-regulation of Treg, M2 macrophage and Ptprj+ G4 granulocyte, up-regulation of effector/memory T cell, M1 macorphage and Hilpda+ G1 granulocyte. Moreover, we identified the uniquely dis-regulated cell types and pathway activities response to each therapy, such as CD73 inhibitor enriched more Cd8+ memory and central memory (CM) cell, PD-1 blockade with more Cd8+ CTL and Cxcl3+ G2 granulocyte, and PTT with more Cd8+ effector memory and Rethlg+ G3 granulocyte cell. These responses disordered the glycolysis, angiogenesis, phagocytosis functions and cellular communication to reshape the CRC tumour immune microenvironment. We provide the detail insights into the intratumoral immunomodulation preferences of CRC mice treated with CD73 inhibitor, PD-1 blockade and PTT therapies, which might contribute to the ongoing development of more effective anticancer strategies.

Keywords: RNA; bioinformatics; cancer; data analysis.


Conflict of interest statement

The authors declare no conflicts of interest.

Figures

FIGURE 1
FIGURE 1
Composition of infiltrated immune cells of CRC tissues in TCGA cohort. (A) Bar plots shows the proportions of deconvoluted immune cells in TCGA cohort. (B) Comparisons of immune cells between tumour and normal tissues of CRC, with wilcoxon test. (C) Comparisons of immune cells among different tumour stages of CRC. (D) Correlation of immune cells of CRC. (E) Survival analysis of the infiltrated immune cells in CRC samples. ns, p > 0.05; *p < 0.05; **p < 0.01; ***p < 0.001; ****p < 0.0001.
FIGURE 2
FIGURE 2
Cellular identification of CRC samples based on spatial transcriptome. (A) UMAP visualisation of 12,792 spots across the four CRC samples, coloured by tissue source. (B) The distribution of spots in each sample. (C) UMAP visualisation of spot clusters. (D) The relative expression levels of the top genes in each cluster. (E) The expression distribution of the main markers. (F) UMAP visualisation of the main cellular identification, coloured by the main spot types. (G) The volcano plot showing the up‐ and down‐regulated DEGs between tumour and normal tissues. (H) The bar plot of the DEGs‐enriched biological processes, coloured by adjusted p value.
FIGURE 3
FIGURE 3
Composition of infiltrated immune cells of CRC tissues in scRNA‐seq dataset. (A) Lollipop chart shows the cellular numbers of each sample in this study. (B) UMAP visualisation of 80,920 cells, coloured by cell types. (C) The expression levels of the canonical markers in each cell type. (D) UMAP visualisation of the major cell types in each group. (E) The cellular composition of each cell type across different groups.
FIGURE 4
FIGURE 4
Transcriptional programs shaped by different therapies in major cell types. (A) Venn plot shows the DEGs' distribution across the different therapies. (B) Dot plot shows fold change of the overlapped DEGs. (C) The relative expression levels of DEGs based on TCGA cohort, with wilcoxon test. (D) The biological progresses enriched in the unique DEGs. (E) The numbers of celltype‐specific DEGs across the different therapies. (F) Violin plots of the pathway activities across the different therapies, with wilcoxon test. (G) Heatmap shows the TFs' activities in each celltype. (H) The expression levels of the key TF in each celltype. (I) The expression's distribution of keg TFs in ST‐seq dataset. (J) Network plot of TF and their target genes. (K) Bar plot of the biological processes enriched in the target genes. ns, p > 0.05; **p < 0.01; ***p < 0.001; ****p < 0.0001.
FIGURE 5
FIGURE 5
Transcription programs dynamics of T cells after CRC therapy. (A) tSNE plot of 6537 T cells, coloured by subtypes. (B) Heatmap shows the expression levels of markers in each subtype. (C) Bar plot of the cellular composition in the different therapies, coloured by subtypes. (D) Dot plots show the expression levels of the inhibitory receptors and effector/memory genes (left) and genesets' scores in the key subtypes, with wilcoxon test. (E) The survival analysis of genes in CRC patients. (F) Spatial distribution of key subtypes in ST‐seq dataset. (G) Volcano plots the DEGs' distribution across the different therapies. (H) Protein levels of genes in normal and CRC tumour tissues. (I) GSEA plots of the key pathways's activities. ****p < 0.0001.
FIGURE 6
FIGURE 6
Transcription programs dynamics of Myeloid cells after CRC therapy. (A) UMAP plot of the 43,003 Myeloid cells, coloured by subtypes. (B) The expression levels of markers in each subtype. (C) Bar plot of the cellular composition in the different therapies, coloured by subtypes. (D) The correlation results between the key subtypes, coloured by groups. (E) Box plots of M1 and M2 scores' distribution in the key subtypes across the different therapies. (F) Violin plots of phagocytosis and angiogenesis' distribution across the different therapies, with wilcoxon test. (G) Metabolic pathways's activities in each macrophage subtype across the different therapies. (H) Spatial distribution of key pathways in ST‐seq dataset. ****p < 0.0001.
FIGURE 7
FIGURE 7
Transcription programs dynamics of granucytes after CRC therapy. (A) UMAP plot of the 25,109 granucytes, coloured by subtypes. (B) The expression levels of markers in each subtype. (C) The biological processes enriched in each subtype. (D) Bar plot of the cellular composition in the different therapies, coloured by subtypes. (E) Soft power threshold identification of granucytes. (F) Dendrogram plot showing the gene modules of co‐expression network. (G) Dot plot indicating the average expression levels of gene modules in each subtype. (H) The overlap of module‐ and subtype‐specific genes. (I) Heatmap showing correlation between the modules and subtypes. (J) The top hub genes within the main modules. (K) The biological processes enriched in the main modules. (L) Spatial distribution (top) and violin plots (bottom) of key pathways in ST‐seq dataset. *p < 0.05; **p < 0.01; ***p < 0.001.
FIGURE 8
FIGURE 8
Cellular communication analysis among the distinct subtypes. (A) UMAP plot of the 32 subtypes in scRNA‐seq dataset. (B) Forest plot showing the HR values of subtypes. (C) Dot plots of the incoming and outgoing interaction strength among the three groups. (D) The differentially expressed pathways between therapy and control groups (E). The communication probabilities of keg LR pairs. (F) The summary of results in this study.

Similar articles

References

    1. Bray F., Ferlay J., Soerjomataram I., Siegel R. L., Torre L. A., and Jemal A., “Global Cancer Statistics 2018: GLOBOCAN Estimates of Incidence and Mortality Worldwide for 36 Cancers in 185 Countries,” CA: A Cancer Journal for Clinicians 68, no. 6 (2018): 394–424, 10.3322/caac.21492. - DOI - PubMed
    1. Bray F., Laversanne M., Sung H., et al., “Global Cancer Statistics 2022: GLOBOCAN Estimates of Incidence and Mortality Worldwide for 36 Cancers in 185 Countries,” CA: A Cancer Journal for Clinicians 74, no. 3 (2024): 229–263, 10.3322/caac.21834. - DOI - PubMed
    1. Johdi N. A. and Sukor N. F., “Colorectal Cancer Immunotherapy: Options and Strategies,” Frontiers in Immunology 11 (2020): 1624, 10.3389/fimmu.2020.01624. - DOI - PMC - PubMed
    1. Singh M., Morris V. K., Bandey I. N., Hong D. S., and Kopetz S., “Advancements in Combining Targeted Therapy and Immunotherapy for Colorectal Cancer,” Trends in Cancer 10, no. 7 (2024): 598–609, 10.1016/j.trecan.2024.05.001. - DOI - PubMed
    1. Chen X., Chen L. J., Peng X. F., et al., “Anti‐PD‐1/PD‐L1 Therapy for Colorectal Cancer: Clinical Implications and Future Considerations,” Translational Oncology 40 (2024): 101851, 10.1016/j.tranon.2023.101851. - DOI - PMC - PubMed

Publication types

LinkOut - more resources