. 2025 Jul 12:85:103763.
doi: 10.1016/j.redox.2025.103763. Online ahead of print.

Guardian of myelin and neural Integrity: foxo1a through slc7a11 mitigating oxidative damage in myelin

Affiliations

Guardian of myelin and neural Integrity: foxo1a through slc7a11 mitigating oxidative damage in myelin

Yinjie Zhao et al. Redox Biol. .

Abstract

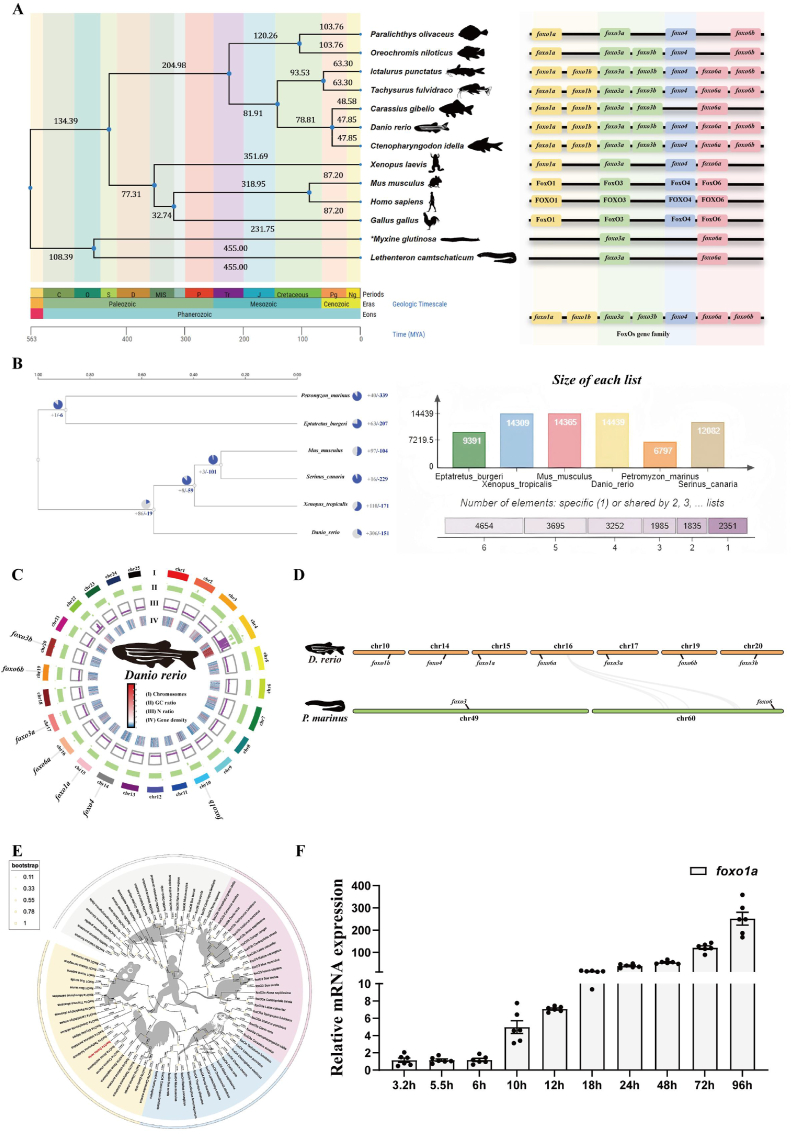
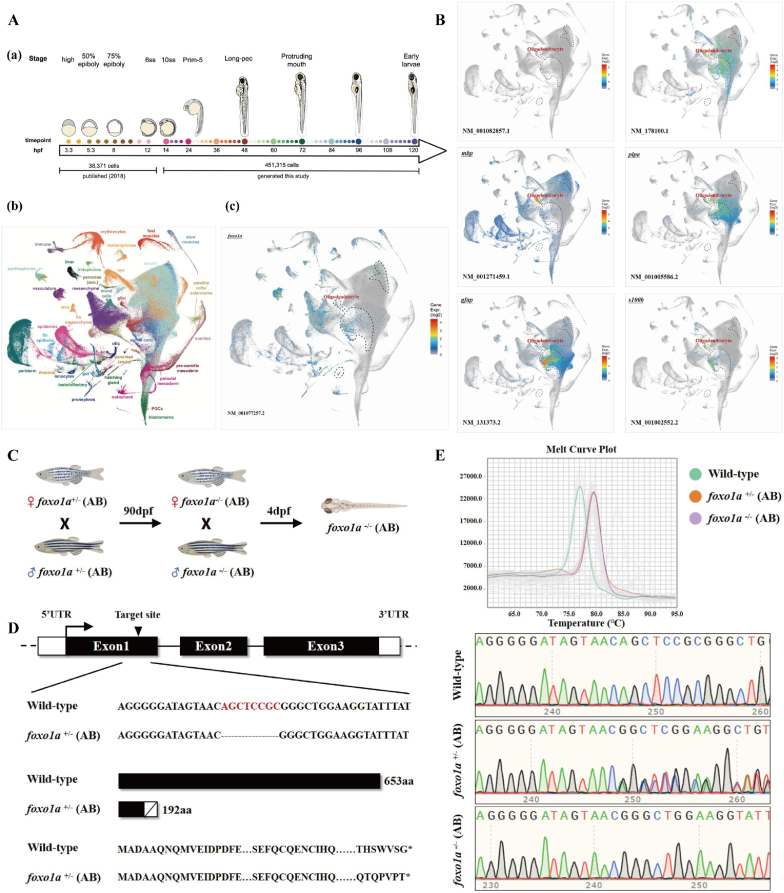
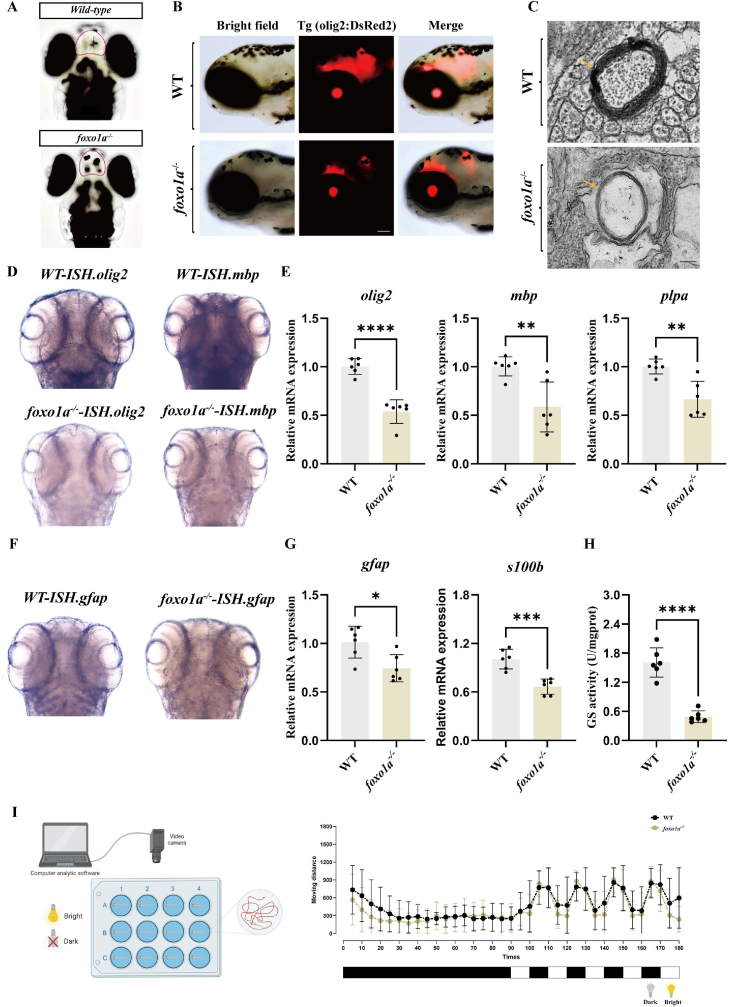
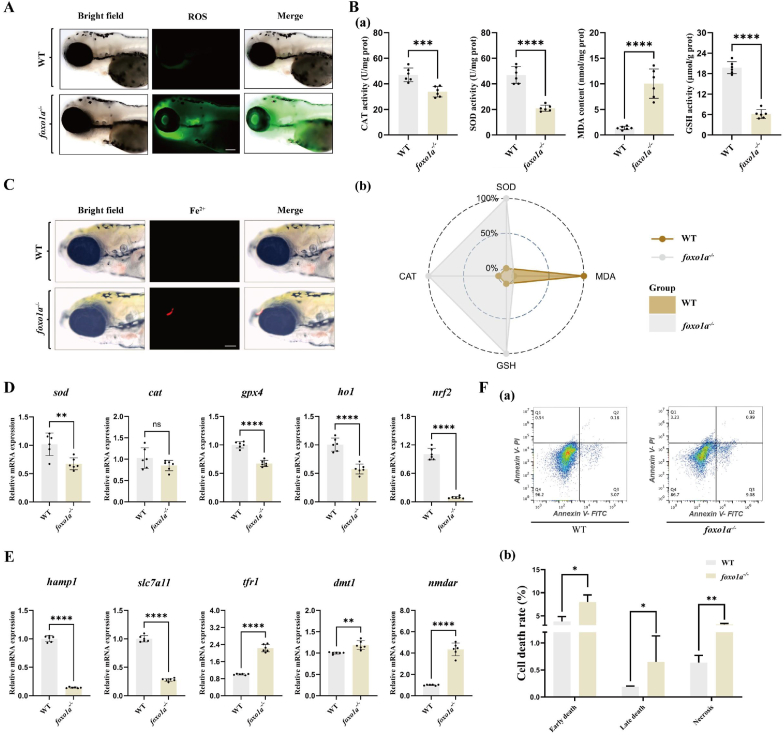
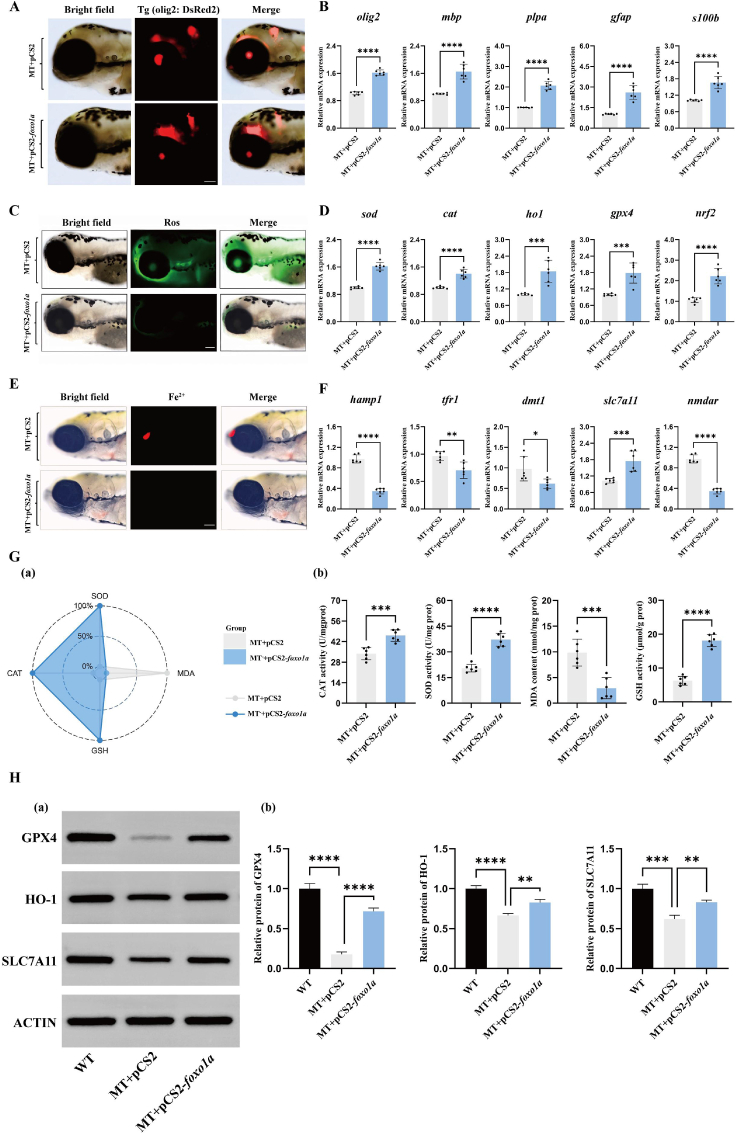
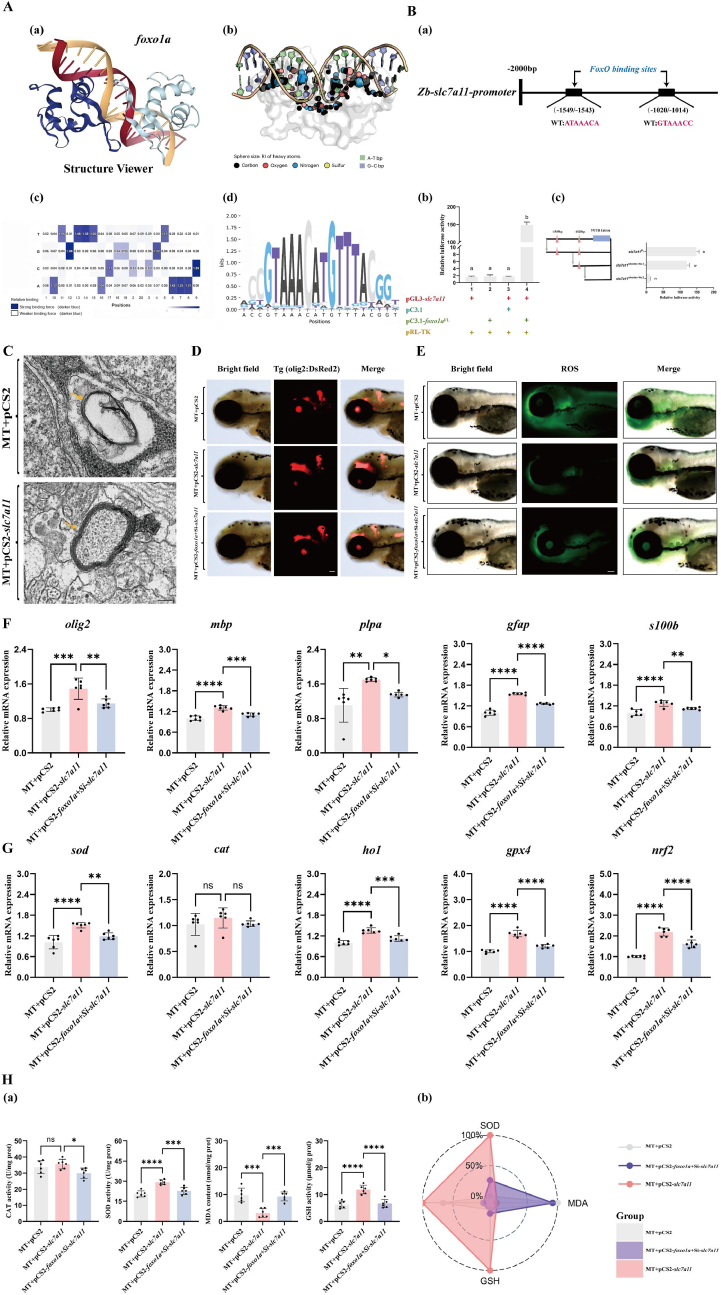
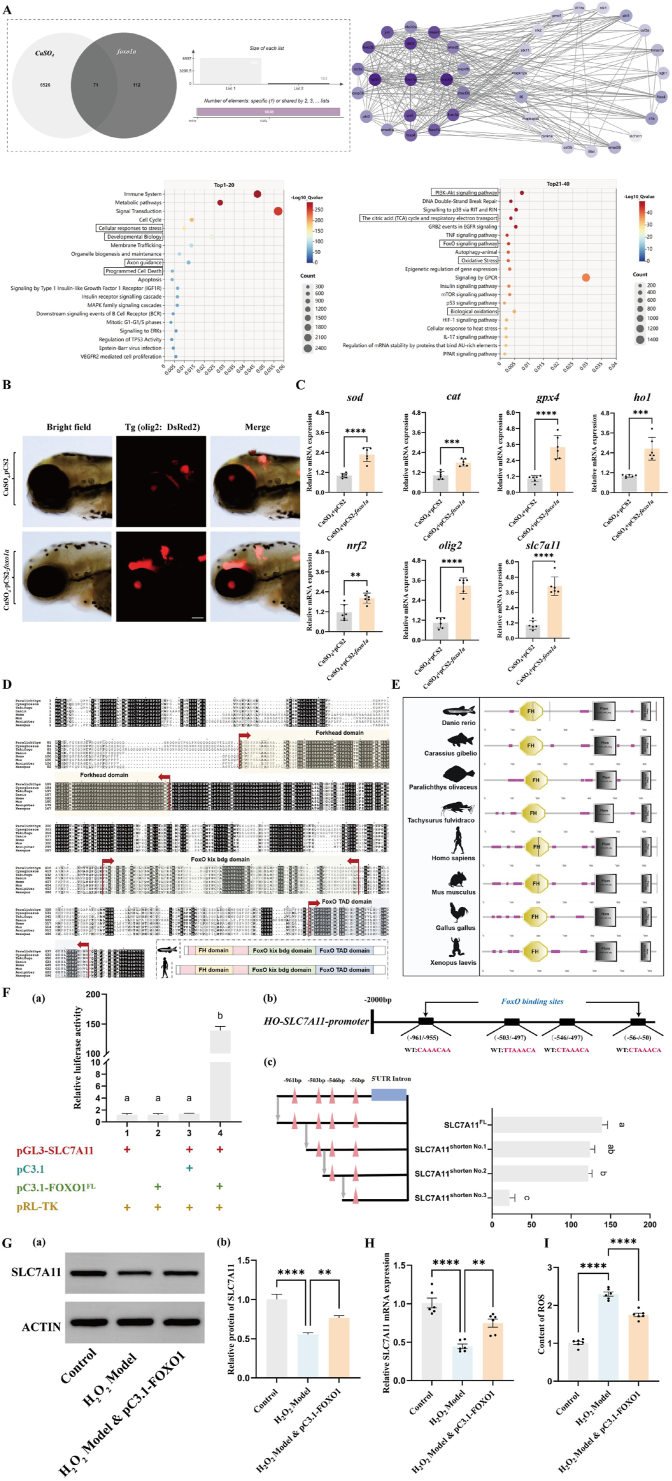
The emergence of myelin marks an evolutionary leap from jawless to jawed vertebrates. Although myelin's role in promoting rapid neural signal transmission and brain complexity is known, its neuroprotective mechanisms in complex signal transmission remain unclear. This study identifies the critical FoxO gene family member, foxo1a, as essential to the evolution of jawed vertebrates by comparing divergence times and gene family heterogeneity between jawless and jawed vertebrates. We found that foxo1a is located in zebrafish oligodendrocytes and myelin, playing a key antioxidant protective role. Specifically, we found that knocking out the foxo1a gene leads to abnormal myelin development in the central nervous system of zebrafish, a reduction in oligodendrocytes, astrocytes, and myelin markers, and induces freezing behavior. Further research revealed that this is related to oxidative stress responses and ferroptosis in the central nervous system of zebrafish following the deficiency of the foxo1a gene. Mechanistically, we discovered that foxo1a is involved in regulating oxidative stress responses and iron homeostasis in the central nervous system by directly regulating the promoter activity of the slc7a11 gene. In terms of application, we found that exogenous supplementation of foxo1a can exert antioxidant protective effects in a copper sulfate-induced myelin damage model. More importantly, we found a parallelism of the foxo1a-slc7a11 axis in both zebrafish and human cells, suggesting that the foxo1a-slc7a11 axis might be an evolutionarily conserved neural defense strategy in jawed vertebrates. In conclusion, our study elucidates the critical role of foxo1a in maintaining antioxidant homeostasis in the central nervous system and provides new insights into the adaptive evolution of the central nervous system in jawed vertebrates.

Keywords: Antioxidant defense; Ferroptosis; Jawed vertebrates; Myelin; foxo1a.


Conflict of interest statement

Declaration of competing interest The authors have declared that no conflict of interest exists.

Figures

Fig. 1
Fig. 1
Phylogenetic tree of divergence times and expansion of gene families. A: Evolutionary analysis of FoxO divergence times, showing the distribution of FoxO gene families in different species. foxo1a is highly conserved among jawed vertebrates, and its first appearance in the vertebrate genome coincides with the emergence of jawed vertebrates. B: Analysis of gene family expansion, with a significant expansion of the FoxO gene family. C: Distribution of FoxO gene family members on zebrafish chromosomes. D: Synteny analysis between zebrafish and lamprey. E: Phylogenetic tree of the FoxO family proteins. F: Early expression of the zebrafish foxo1a gene.
Fig. 2
Fig. 2
Spatiotemporal Expression and mutant Establishment of Zebrafish foxo1a A: Single-cell RNA sequencing data of early zebrafish development, (a) high temporal resolution single-cell RNAseq time course, covering embryogenesis and early larval development. (b) UMAP projection of single-cell transcriptomes colored by selected major tissues. (c) foxo1a single-cell RNA data during early development. B: Early developmental single-cell data of foxo1b, olig2, mbp, plpa, gfap and s100b. C: Schematic diagram of foxo1a mutant establishment. D: Schematic diagram of the foxo1a mutant target. The deletion of 8bp (AGCTCCGC) in the first exon results in a frameshift mutation. E: HRMA of the foxo1a gene, sequencing chromatograms for genotyping wild-type, foxo1a heterozygous, and homozygous mutants.
Fig. 3
Fig. 3
Mutant of the foxo1a gene leads to abnormal development of the telencephalon, oligodendrocytes, and myelin in zebrafish, as well as abnormal development of astrocytes and behavioral abnormalities. A: Dorsal view of the brains of control and foxo1a−/− larvae, the red coil indicates the position of the telencephalon. B: Expression of olig2 fluorescent protein in the brains of control and foxo1a−/− groups, with reduced fluorescence in the foxo1a−/− group, scale bar = 100 μm C: Representative transmission electron micrographs of myelin in control and foxo1a−/− larvae, the yellow arrow indicates the location of the myelin, scale bar = 100 nm D: In situ hybridization of olig2 and mbp in control and foxo1a−/− groups. E: qRT-PCR analysis of olig2, mbp, and plpa gene expression in oligodendrocytes of control and foxo1a−/− zebrafish larvae, N = 6, t-test, ∗p < 0.05, ∗∗p < 0.01, ∗∗∗p < 0.001, ∗∗∗∗p < 0.0001 F: In situ hybridization of gfap in control and foxo1a−/− groups. G: Expression of gfap and s100b genes in astrocytes of control and foxo1a−/− zebrafish larvae.,N = 6, t-test, ∗p < 0.05, ∗∗p < 0.01, ∗∗∗p < 0.001, ∗∗∗∗p < 0.0001 H: Comparison of glutamine synthetase activity in control and foxo1a−/− zebrafish larvae, N = 6, t-test, ∗p < 0.05, ∗∗p < 0.01, ∗∗∗p < 0.001, ∗∗∗∗p < 0.0001 I: Schematic of the light-dark alternation behavior experiment, where the Viewpoint tool observes zebrafish for 90 min under normal daylight, followed by minute-by-minute light-dark alternations, and records the distance moved by control and foxo1a−/− zebrafish larvae every 10 min.
Fig. 4
Fig. 4
Deletion of the foxo1a gene leads to abnormal antioxidant systems in the zebrafish brain and ferroptosis occurs in the zebrafish brain. A: ROS fluorescence images of the brains of control group and foxo1a−/− group zebrafish larvae, scale bar = 100 μm B: (a) The effect of antioxidant enzyme activity in the brain tissue of control group and foxo1a−/− group zebrafish larvae, including SOD activity, CAT activity, GSH activity and MDA content. N = 6, t-test, ∗p < 0.05, ∗∗p < 0.01, ∗∗∗p < 0.001, ∗∗∗∗p < 0.0001. (b) IBR calculation radar chart of antioxidant enzyme activity in the brain tissue of control group and foxo1a−/− group zebrafish larvae. N = 6, data are expressed as mean ± SD. C: Iron ion fluorescence images of the brains of control group and foxo1a−/− group zebrafish larvae, scale bar = 100 μm. D: qRT-PCR detection of changes in oxidative stress-related mRNA expression (sod, cat, ho1, gpx4 and nrf2) in the brain tissue of control group and foxo1a−/− group zebrafish larvae. N = 6, t-test, ∗p < 0.05, ∗∗p < 0.01, ∗∗∗p < 0.001, ∗∗∗∗p < 0.0001. E: qRT-PCR detection of changes in ferroptosis-related gene mRNA expression of hamp1, tfr1, dmt1, slc7a11 and nmdar in the brain tissue of control group and foxo1a−/− group zebrafish larvae. N = 6, t-test, ∗p < 0.05, ∗∗p < 0.01, ∗∗∗p < 0.001, ∗∗∗∗p < 0.0001. F: (a) Flow cytometry detection of apoptosis in the brains of control group and foxo1a−/− group zebrafish larvae. (b) The number and proportion of early apoptotic, late apoptotic, and necrotic cells in the brains of control group and foxo1a−/− group zebrafish larvae, t-test, ∗p < 0.05, ∗∗p < 0.01.
Fig. 5
Fig. 5
Overexpression of foxo1a rescues oligodendrocytes, reduces ROS levels, and alleviates ferroptosis. A: Fluorescent expression of olig2 in the brains of zebrafish larvae receiving empty vector and overexpressing foxo1a, scale bar = 100 μm B: Expression of olig2, mbp, plpa, gfap, and s100b oligodendrocyte-related genes in mutants receiving empty vector and overexpressing foxo1a, N = 6, t-test, ∗p < 0.05, ∗∗p < 0.01, ∗∗∗p < 0.001, ∗∗∗∗p < 0.0001. C: ROS fluorescence in the brains of zebrafish larvae receiving empty vector and overexpressing foxo1a, scale bar = 100 μm. D: qRT-PCR detection of antioxidant-related gene expression (sod, cat, ho1, gpx4 and nrf2) in the brain tissues of zebrafish larvae receiving empty vector and overexpressing foxo1a, N = 6, t-test, ∗p < 0.05, ∗∗p < 0.01, ∗∗∗p < 0.001, ∗∗∗∗p < 0.0001. E: Fluorescence images of iron ions in the brains of zebrafish larvae receiving empty vector and overexpressing foxo1a, scale bar = 100 μm F: qRT-PCR detection of changes in mRNA expression of ferroptosis-related genes (hamp1, tfr1, dmt1, slc7a11 and nmdar) in the brain tissues of zebrafish larvae receiving empty vector and overexpressing foxo1a, N = 6, t-test, ∗p < 0.05, ∗∗p < 0.01, ∗∗∗p < 0.001, ∗∗∗∗p < 0.0001. G: Effects of antioxidant enzyme activity in zebrafish larvae brain tissues, (a) IBR calculated star map of antioxidant enzyme activity in the brain tissues of control group and foxo1a−/− group zebrafish larvae. (b) SOD activity, CAT activity, GSH activity and MDA content. N = 6, t-test, ∗p < 0.05, ∗∗p < 0.01, ∗∗∗p < 0.001, ∗∗∗∗p < 0.0001. H: (a) Western blotting was used to detect changes in GPX4, HO-1, and SLC7A11 proteins in the brain tissue of the injection of the empty carrier wild-type zebrafish, the injection of the empty carrier mutant zebrafish, and the overexpression of foxo1a mutant zebrafish. MT represents the foxo1a mutant, (b) followed by normalization for relative protein quantification, oneway ANOVA with Tukey's post-hoc test, ∗p < 0.05, ∗∗p < 0.01, ∗∗∗p < 0.001, ∗∗∗∗p < 0.0001.
Fig. 6
Fig. 6
Transcription factor foxo1a regulates the transcription of the slc7a11 gene, protects oligodendrocytes, enhances antioxidant capacity, and reduces ferroptosis. A: Prediction of transcription factor binding sites. (a) Schematic diagram of the binding of the foxo1a transcription factor to DNA structure. (b) Calculation of the relative importance (RI) score of heavy atoms within a symmetrical helix range of 5A (represented by sphere sizes: maximum 1, minimum 0) (normalized to the maximum value between atoms). (c) DeepPBS output binding specificity score. (d) Base selection intensity at the promoter sites of target genes bound by the foxo1a gene. Purple indicates competitive mutations where the competition is stronger than the WT competitor, while white indicates weaker competitor mutations. B: (a) Analysis diagram of the specific binding sites of foxo1a on the slc7a11 gene promoter. (b) pGL3 and pC3.1 represent the circular pGL3-basic plasmid and the circular pcDNA3.1 (+) plasmid, respectively. The slc7a11 gene promoter sequence was homologously recombined with the linearized pGL plasmid to construct the reporter plasmid pGL-slc7a11. The full-length CDS sequence of foxo1a was homologously recombined with the linearized pcDNA3.1 (+) plasmid to construct the expression plasmid pC3.1-foxo1a. The Rluc-expressing pRL-TK plasmid was co-transfected in each group to characterize transfection efficiency. The Arabic numerals near the x-axis indicate different treatment groups. Different letters indicate significant differences (P < 0.05). (c) Fragmentation deletion experiment on the transcriptional regulation of the slc7a11 gene by the transcription factor foxo1a. Pink triangles (△) indicate the predicted binding sites of the foxo1a transcription factor by DeepPBS software. Three black horizontal lines represent the length of the promoter sequences in the reporter plasmid. They were obtained by homologous recombination of the fragmented pGL3-basic plasmid with different lengths of promoter sequences from the slc7a11 gene. Different letters indicate significant differences (P < 0.05). C: Representative transmission electron microscopy images of myelin in mutant zebrafish larvae injected with empty plasmid and in mutants overexpressing slc7a11. MT represents foxo1a mutant zebrafish.Yellow arrows indicate the location of the myelin, scale bar = 100 nm. D: Injecting null mutant, overexpressing slc7a11 mutant, overexpressing foxo1a mutant zebrafish then knocking down slc7a11 again, Olig2 fluorescent expression, MT represents foxo1a mutant zebrafish, scale bar = 100 μm E: Injecting empty vector mutants, overexpressing slc7a11 mutants, overexpressing foxo1a mutants in zebrafish followed by knockdown of slc7a11, ROS fluorescence expression, MT represents foxo1a mutant zebrafish, scale bar = 100 μm F: Injection of empty vector mutant, overexpression of slc7a11 mutant, and overexpression of foxo1a mutant zebrafish followed by knockdown of slc7a11 in larvae brain olig2, mbp, plpa, gfap and s100b oligodendrocyte-related gene expression. MT represents foxo1a mutant zebrafish, N = 6, oneway ANOVA with Tukey's post-hoc test, ∗p < 0.05, ∗∗p < 0.01, ∗∗∗p < 0.001, ∗∗∗∗p < 0.0001 G: Injecting empty vector mutants, overexpressing slc7a11 mutants, overexpressing foxo1a mutants and then knocking down slc7a11 in zebrafish larvae brain tissue, examining the expression of antioxidant-related genes sod, cat, ho1, gpx4 and nrf2. MT represents foxo1a mutant zebrafish, N = 6, oneway ANOVA with Tukey's post-hoc test, ∗p < 0.05, ∗∗p < 0.01, ∗∗∗p < 0.001, ∗∗∗∗p < 0.0001. H: (a) Injection of empty vector foxo1a mutant, overexpression of slc7a11 mutant, overexpression of foxo1a mutant followed by knockdown of slc7a11 on antioxidant enzyme activity in zebrafish larvae brain tissue: SOD activity, CAT activity, GSH activity and MDA content. MT represents foxo1a mutant zebrafish, N = 6, oneway ANOVA with Tukey's post-hoc test, ∗p < 0.05, ∗∗p < 0.01, ∗∗∗p < 0.001, ∗∗∗∗p < 0.0001. (b) IBR calculated the star plot of antioxidant enzyme activity in the brain tissue of zebrafish larvae injected with empty vector mutants, overexpressing slc7a11 mutants, and overexpressing foxo1a mutants with slc7a11 knockdown. MT represents foxo1a mutant zebrafish.
Fig. 7
Fig. 7
Application of foxo1a in the CuSO4-induced demyelination model. A: Network molecular analysis results. (a) Venn diagram showing the number of common targets between foxo1a and CuSO4. (b) KEGG and GO enrichment analysis of common targets. B: olig2 fluorescence expression in the brains of zebrafish larvae from the control group and the overexpressed foxo1a group under CuSO4 treatment, scale bar = 100 μm C: mRNA expression levels of sod, cat, ho1, gpx4, nrf2, olig2, and slc7a11 in the brain tissue of zebrafish larvae from the control group and the overexpressed foxo1a group under CuSO4 treatment, N = 6, t-test, ∗p < 0.05, ∗∗p < 0.01, ∗∗∗p < 0.001, ∗∗∗∗p < 0.0001. D: Protein sequence alignment of foxo1a. E: Structural analysis of representative proteins from the foxo1a family. F: (a) pGL3 and pC3.1 represent the circular pGL3-basic plasmid and circular pcDNA3.1 (+) plasmid, respectively. The SLC7A11 gene promoter sequence was homologously recombined with the linearized pGL plasmid to construct the reporter plasmid pGL-SLC7A11. The full-length CDS sequence of FOXO1 was homologously recombined with the linearized pcDNA3.1 (+) plasmid to construct the expression plasmid pC3.1-FOXO1. The pRL-TK plasmid expressing rluc was co-transfected in each group to characterize transfection efficiency. The Arabic numerals near the x-axis indicate different treatment groups. Different letters indicate significant differences (P < 0.05). (b) Analysis diagram of the FOXO1-specific binding site on the SLC7A11 gene promoter. (c) Fragment deletion experiment of the transcriptional regulation of the SLC7A11 gene by transcription factor FOXO1. The pink triangles (△) represent FOXO1 transcription factor binding sites predicted by DeepPBS software. The four black horizontal lines represent the lengths of the promoter sequences in the reporter plasmids. They were obtained by homologous recombination of pGL3 basic plasmid fragments with SLC7A11 gene promoter sequences of different lengths. Different letters indicate significant differences (P < 0.05). G: (a) In human oligodendrocytes, the expression of SLC7A11 protein in the control group, the H2O2 model group, and the H2O2 model group with overexpressed FOXO1 was evaluated (b) the relative quantification of the SLC7A11 protein was performed using normalization, oneway ANOVA with Tukey's post-hoc test, ∗p < 0.05, ∗∗p < 0.01, ∗∗∗p < 0.001, ∗∗∗∗p < 0.0001. H: In human oligodendrocytes, the relative expression of SLC7A11 mRNA in the control group, H2O2 model group, and H2O2 model group overexpressing FOXO1, oneway ANOVA with Tukey's post-hoc test, N = 6 ∗ p < 0.05, ∗∗p < 0.01, ∗∗∗p < 0.001, ∗∗∗∗p < 0.0001. I: In human oligodendrocytes, the ROS levels in the control group, the H2O2 model group, and the H2O2 model group overexpressing FOXO1, oneway ANOVA with Tukey's post-hoc test, N = 6∗ p < 0.05, ∗∗p < 0.01, ∗∗∗p < 0.001, ∗∗∗∗p < 0.0001.

Similar articles

References

    1. Thompson J.N. Evolutionary ecology and the conservation of biodiversity. Trends Ecol. Evol. 1996;11(7):300–303. doi: 10.1016/0169-5347(96)20048-5. - DOI - PubMed
    1. Blanchet S., Fargeot L., Raffard A. Phylogenetically-conserved candidate genes unify biodiversity-ecosystem function relationships and eco-evolutionary dynamics across biological scales. Mol. Ecol. 2023;32(16):4467–4481. doi: 10.1111/mec.17043. - DOI - PubMed
    1. Shapiro J.A. No genome is an island: toward a 21st century agenda for evolution. Ann. N. Y. Acad. Sci. 2019;1447(1):21–52. doi: 10.1111/nyas.14044. - DOI - PubMed
    1. Zhu Y.A., Li Q., Lu J., Chen Y., Wang J., Gai Z., Zhao W., Wei G., Yu Y., Ahlberg P.E., Zhu M. The oldest complete jawed vertebrates from the early Silurian of China. Nature. 2022;609(7929):954–958. doi: 10.1038/s41586-022-05136-8. - DOI - PubMed
    1. Vandenbroucke T.R.A., Emsbo P., Munnecke A., Nuns N., Duponchel L., Lepot K., Quijada M., Paris F., Servais T., Kiessling W. Metal-induced malformations in early Palaeozoic plankton are harbingers of mass extinction. Nat. Commun. 2015;6(1):7966. doi: 10.1038/ncomms8966. - DOI - PMC - PubMed

LinkOut - more resources