. 2025 Sep:85:103767.
doi: 10.1016/j.redox.2025.103767. Epub 2025 Jul 14.

Mechano-activated connexin hemichannels mediate intercellular glutathione transport and support lens redox homeostasis

Affiliations

Mechano-activated connexin hemichannels mediate intercellular glutathione transport and support lens redox homeostasis

Guangyan Wang et al. Redox Biol. 2025 Sep.

Abstract

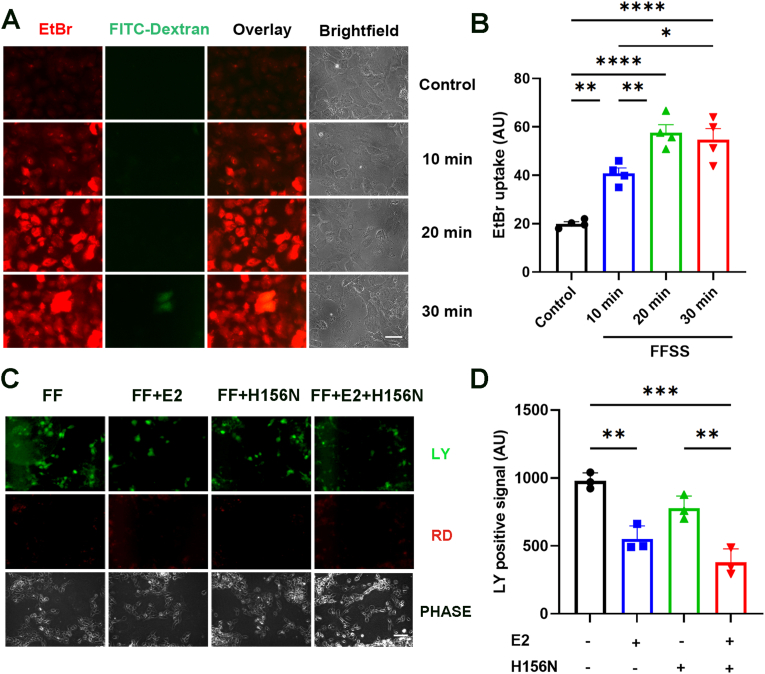
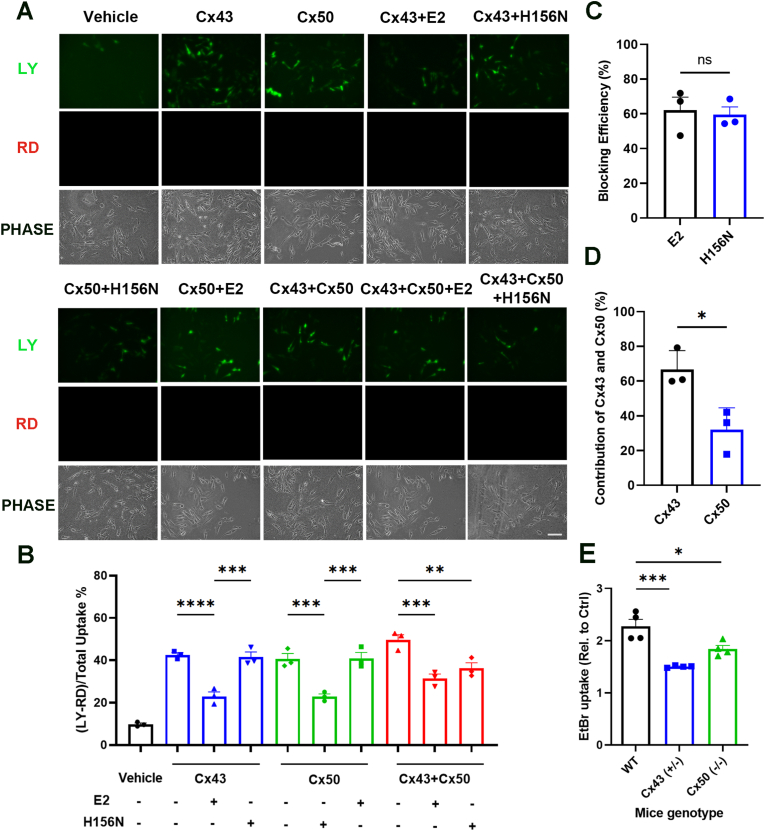
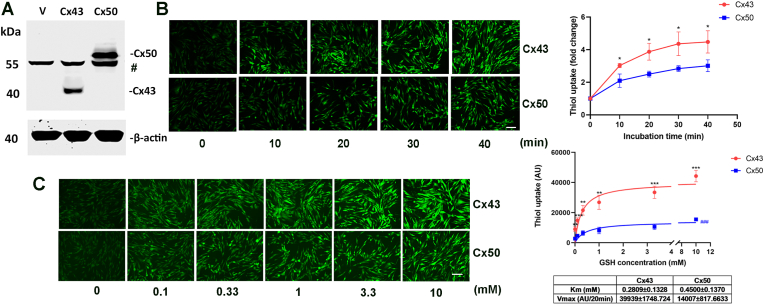
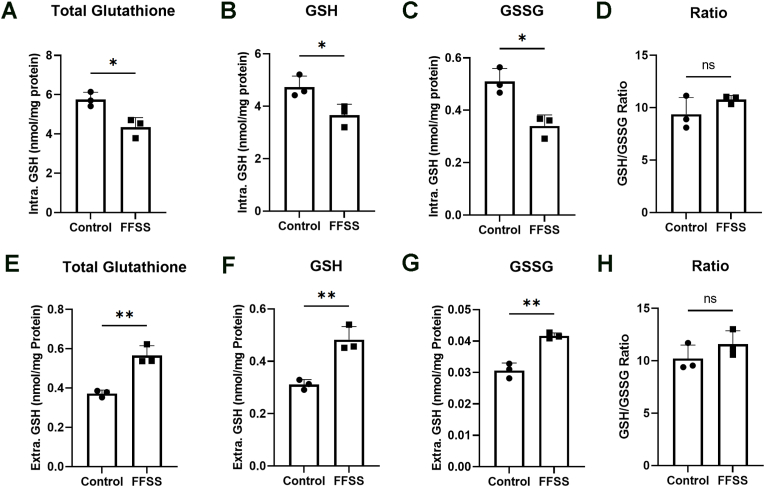
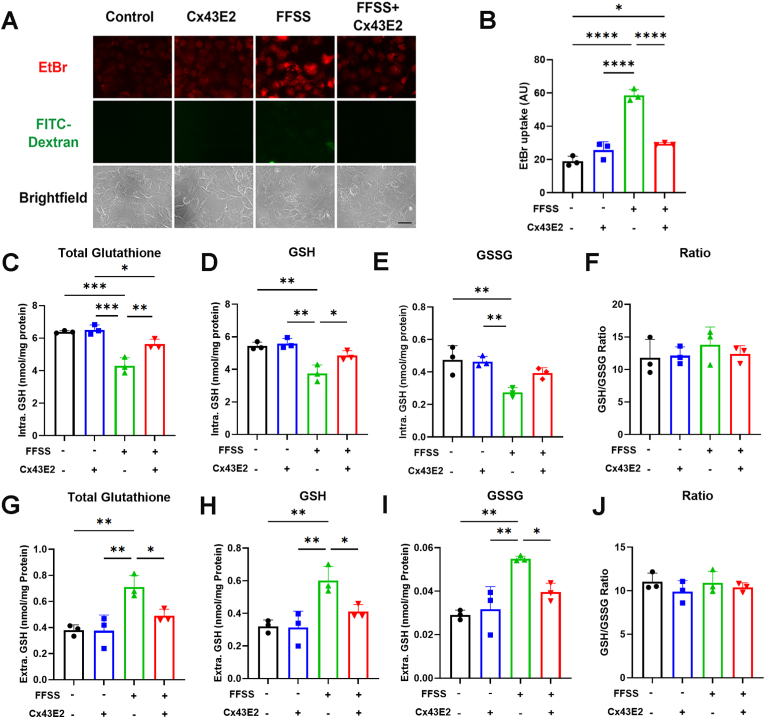
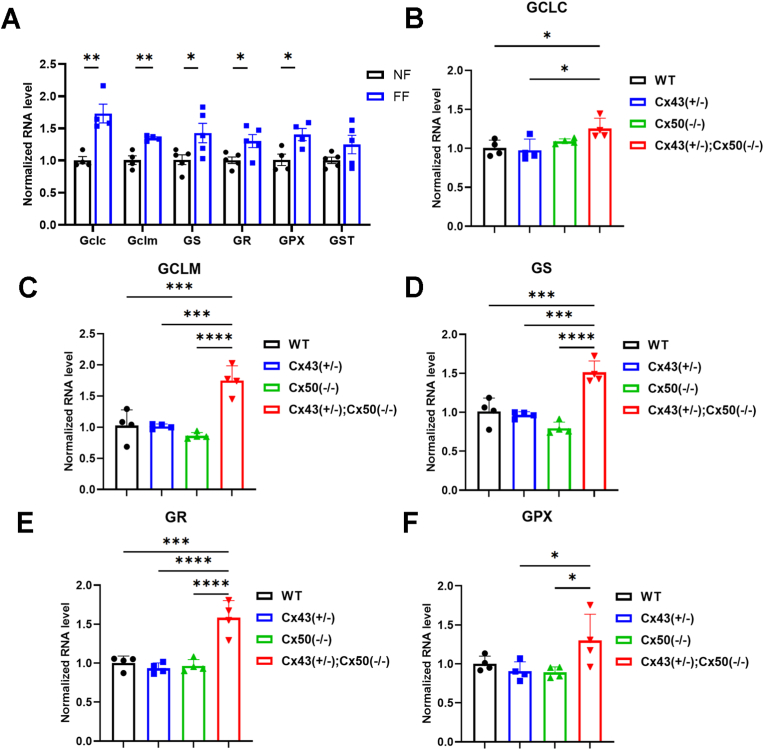
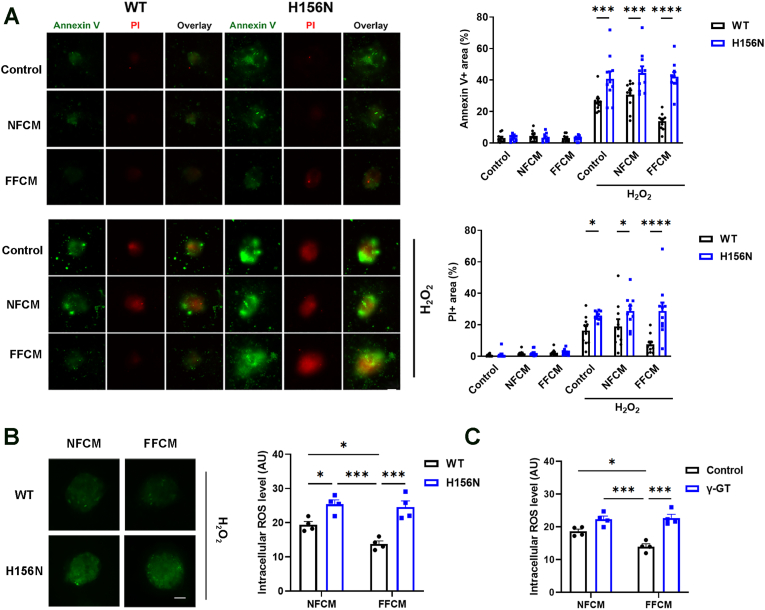
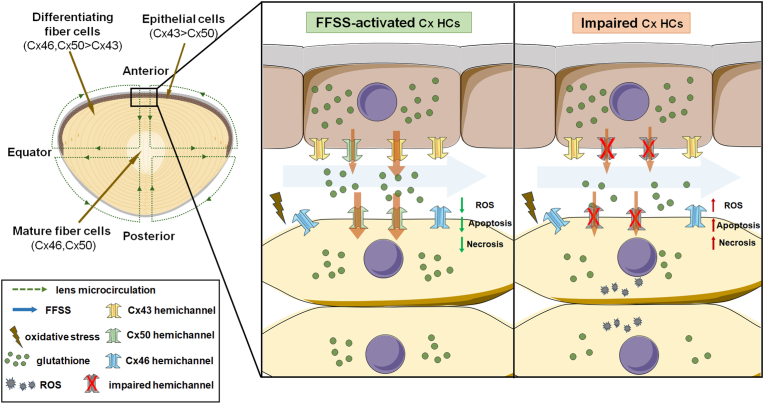
Redox homeostasis and transparency in the ocular lens are closely associated with the distribution of the antioxidant reduced glutathione (GSH). While the synthesis and recycling of GSH have been well characterized, the mechanisms governing its intercellular transport within the lens remain largely elusive. Here, we identified a GSH transport pathway mediated by connexin (Cx) hemichannels in both lens epithelial and fiber cells that has not been fully characterized previously. Through a combination of fluid flow shear stress (FFSS) stimulation, in vitro and ex vivo models, and gene knockout mouse models, we demonstrate that Cx43 and Cx50 hemichannels in lens epithelial cells facilitate GSH efflux in response to mechanical stimuli. Notably, Cx43 hemichannels exhibited higher opening efficiency and greater GSH transport capacity than Cx50 hemichannels under FFSS. The extracellular GSH released from epithelial cells was then taken up by activated Cx50 hemichannels in fiber cells under FFSS, effectively reducing oxidative stress and promoting cell survival. This intercellular relay of GSH between epithelial and fiber cells via mechanosensitive Cx hemichannels suggests a novel mechanism for regulating redox balance within the lens. This pathway may be essential for preserving lens homeostasis and offers new insight into lens physiology and potential therapeutic strategies for preventing or delaying cataract formation.

Keywords: GSH; Hemichannels; Lens; Redox homeostasis.


Conflict of interest statement

Declaration of competing interest Declarations of interest for all authors: none.

Figures

Fig. 1
Fig. 1
Mechanical stimulation induces connexin hemichannel opening in primary embryonic chick lens epithelial cells (CLCs). (A) CLCs were subjected to FFSS or maintained under static conditions, followed by EtBr/FITC-dextran dye uptake assays. Representative images show EtBr-fluorescence (indicative of hemichannel activity) and FITC-dextran (∼10 kDa) fluorescence (control for nonspecific uptake in membrane leaky or dying cells). Scale bar: 100 μm. (B) Quantification of EtBr uptake in CLCs was performed using NIH ImageJ by analyzing the mean fluorescence intensity of EtBr. Data represent the mean ± SEM (n = 5). ∗P < 0.05, ∗∗P < 0.01; ∗∗∗∗P < 0.0001 (one-way ANOVA). (C) Primary CLCs were pretreated with the Cx43E2 antibody or infected with high-titer RCAS(A) containing Cx50H156 N to inhibit Cx43 or Cx50 hemichannel activity, respectively. Cells were then exposed to FFSS for 30 min, followed by incubation with 0.4 % LY/RD dye for 10 min. Representative images of dye uptake are shown. Scale bar: 100 μm. (D) LY uptake levels were quantified by multiplying the mean fluorescence intensity by the percentage of LY-positive cells among all cells, then subtracting the number of LY/RD double-positive cells from the total LY-positive cells. Data represent mean ± SEM (n = 3).∗∗P < 0.01, ∗∗∗P < 0.001 (one-way ANOVA).
Fig. 2
Fig. 2
Cx43 hemichannels exhibit a higher transport capacity than Cx50 hemichannels under mechanical stimulation in cells expressing exogenous Cx43 or Cx50 and mouse lens explants. (A) CEF cells were infected with high-titer RCAS(A) vehicle (V) or recombinant RCAS(A) containing Cx43, Cx50, Cx50H156 N, or co-infected with RCAS(A) containing Cx43/Cx50 or Cx43/Cx50H156 N. Cells were then exposed to FFSS for 30 min, followed by incubation with 0.4 % LY/RD (∼10 kDa) for 10 min. Representative images show LY uptake (red) and RD exclusion (green). Scale bar: 100 μm. (B) LY-positive cells were quantified by subtracting background signal from LY/RD double-positive cells. Data represent mean ± SEM (n = 3). Significant differences between hemichannel-inhibited and corresponding non-inhibited groups within single and double connexin-expressing cell groups are indicated by asterisks. ∗∗P < 0.01, ∗∗∗P < 0.001, ∗∗∗∗P < 0.0001 (one-way ANOVA). (C) Hemichannel blocking efficiency was calculated based on LY/RD uptake results in cells expressing single connexin groups. (D) The contributions of Cx43 and Cx50 were assessed using data from both single and double connexin-expressing cell groups. The formulas used to generate the data in panels (C) and (D) are provided in the Materials and Methods. Data represent mean ± SEM (n = 3). ∗P < 0.05 (unpaired t-test). (E) Lens explants from WT, Cx43(±), and Cx50(−/−) mice were cultured and subjected to EtBr/FITC-dextran uptake, with or without mechanical stimulation induced by dropping assay. EtBr uptake was quantified and presented by fold change in mean fluorescence intensity of EtBr fluorescence after dye dropping, compared to the control. FITC-dextran was used to exclude nonspecific uptake in membrane leaky or dying cells. Data represent mean ± SEM (n = 4). ∗P < 0.05, ∗∗∗P < 0.001 (one-way ANOVA).
Fig. 3
Fig. 3
Cx43 hemichannels exhibit a higher capacity for GSH uptake than Cx50 hemichannels under mechanical stimulation. (A) CEF cells were infected with high-titer RCAS(A) vehicle (V) or recombinant RCAS(A) containing Cx43 or Cx50. Cells membrane extracts were immunoblotted with anti-flag antibody. The relative band intensities of Cx43 or Cx50 were quantified relative to β-actin and used to normalize the results of the GSH uptake assay. The band marked with # indicates a non-specific band. (B) CEF cells were subjected to FFSS for 30 min, treated with 1 mM GSH for varying durations, and then incubated with 10 μM Thiol Tracker™ for 30 min. GSH uptake was quantified by fluorescence mean intensity. The data were analyzed using unpaired t-test (n = 3). ∗P < 0.01, comparing GSH uptake between Cx43 and Cx50 at each time point (unpaired t-test). (C) CEF cells were exposed to FFSS for 30 min, treated with various concentrations of GSH for 20 min, and incubated with 10 μM ThiolTracker™ for 30 min. GSH uptake after FFSS was quantified by fluorescence mean intensity. The data were analyzed using the Michaelis-Menten equation and fitted with non-linear regression analysis (n = 3). The maximum velocity (Vmax, AU/20 min) and the Michaelis constant (Km, mM) are shown under the graph. ∗∗P < 0.01, ∗∗∗P < 0.001, comparing Cx43 and Cx50 at each GSH concentration (unpaired t-test); ###P < 0.001, comparing Vmax values (unpaired t-test).
Fig. 4
Fig. 4
FFSS promotes glutathione transport in embryonic chick lens cells through the activation of connexin hemichannels. Subculture embryonic chick lens epithelial cells were exposed to FFSS or maintained under static conditions for 2 h. (AD) After treatment, CM were collected and extracellular GSH concentrations were determined using the GSH/GSSG Ratio Detection Assay Kit, with results calibrated to protein concentration. Total glutathione (A) and reduced GSH (B) were quantified; GSSG (C) and GSH/GSSG ratio were calculated (D). (EH) After treatment, cells were collected, lysed, and deproteinized for intracellular glutathione concentration determination using the GSH/GSSG Ratio Detection Assay Kit, with results calibrated to protein concentration. Total glutathione (E) and reduced GSH (F) were quantified; GSSG (G) and GSH/GSSG ratio were calculated (H). (n = 3) ∗P < 0.05, ∗∗P < 0.01 (unpaired t-test).
Fig. 5
Fig. 5
FFSS promotes glutathione transport in HLE-B3 cells through the activation of connexin 43 hemichannels. (A) HLE-B3 cells were pretreated with or without the Cx43E2 antibody and then subjected to FFSS or maintained under static conditions, followed by EtBr/FITC-dextran dye uptake assays. Representative images show EtBr fluorescence and FITC-dextran fluorescence. Scale bar: 100 μm. (B) EtBr dye uptake was quantified using NIH ImageJ by analyzing mean fluorescence intensity. Data represent mean ± SEM (n = 5). ∗P < 0.05, ∗∗∗∗P < 0.0001 (one-way ANOVA). (CJ) HLE-B3 cells were pretreated with the Cx43E2 antibody to inhibit Cx43 hemichannel activity. Cells were then exposed to FFSS or maintained under static conditions for 2 h. (C–F) CM was collected, and extracellular glutathione concentrations were measured using the GSH/GSSG Ratio Detection Assay Kit, with results calibrated to protein concentration. Total glutathione (C) and reduced GSH (D) were quantified, while GSSG (E) and the GSH/GSSG ratio were calculated (F). (GJ) After treatment, cells were collected, lysed, and deproteinized for intracellular glutathione concentration determination using the GSH/GSSG Ratio Detection Assay Kit, with results calibrated to protein concentration. Total glutathione (G) and reduced GSH (H) were measured, while GSSG (I) and GSH/GSSG ratio (J) were calculated (n = 4). ∗P < 0.05, ∗∗P < 0.01, ∗∗∗P < 0.001 (one-way ANOVA).
Fig. 6
Fig. 6
Regulation of glutathione synthesis and metabolism enzymes in embryonic chick lens epithelial cells under FFSS and connexin-deficient mice. (A) Primary CLCs were subjected to FFSS or maintained under static conditions for 30 min. After FFSS, cells were incubated for an additional 4 h before RNA extraction. The expression levels of genes related to glutathione synthesis and metabolism were assessed by qPCR. (n = 4–5). ∗P < 0.05, ∗∗P < 0.01, (unpaired t-test). (B) Lens capsular tissues were isolated from WT, Cx43(±), Cx50KO, and Cx43(±); Cx50KO mice for RNA extraction. The expression levels of genes related to glutathione synthesis and metabolism were assessed by qPCR (n = 3). ∗P < 0.05, ∗∗∗P < 0.001, ∗∗∗∗P < 0.0001 (one-way ANOVA). GCLC: Glutamate-Cysteine Ligase Catalytic Subunit; GCLM: Glutamate-Cysteine Ligase Modifier Subunit; GS: Glutathione Synthetase; GR: Glutathione Reductase; GPX: Glutathione Peroxidase; GST: Glutathione S-Transferase.
Fig. 7
Fig. 7
CM collected from FFSS-treated lens epithelial cells protects lens fiber cells against H2O2-induced intracellular ROS accumulation and apoptosis through Cx50 hemichannels. Differentiated primary lens fiber cells (lentoids) expressing exogenous Cx50 or the Cx50H156 N mutant were exposed to FFSS for 30 min before incubation with CM collected from HLE-B3 cells, followed by treatment with or without 500 μM H2O2 for 4 h. (A) Cell apoptosis and necrosis were measured using the Dead Cell Apoptosis Kit with FITC-Annexin V and PI (n = 4). ∗P < 0.05, ∗∗∗P < 0.001, ∗∗∗∗P < 0.0001 (two-way ANOVA). (B) Intracellular ROS levels were detected using dihydrorhodamine 123 (DHR-123) and quantified by mean fluorescence intensity. (n = 3). Scale bar: 50 μm ∗P < 0.05, ∗∗P < 0.01, ∗∗∗P < 0.001 (two-way ANOVA). (C) CM collected from HLE-B3 cells was preincubated with 0.1 unit/ml of γ-glutamyl transpeptidase (γ-GT) for 30 min before treating differentiated primary fiber lens (lentoids). Intracellular ROS levels were assessed using DHR-123 and quantified by mean fluorescence intensity (n = 3). ∗P < 0.05, ∗∗∗P < 0.001 (two-way ANOVA).
Fig. 8
Fig. 8
An illustration of glutathione transport between lens epithelial and fiber cells mediated by connexin hemichannels activated by fluid shear stress. The left panel provides an overview of lens structure, highlighting the regional distribution and expression patterns of connexin subtypes. The right panel shows a magnified view of the epithelial–fiber cell interface, illustrating the release of intracellular GSH from lens epithelial cells into the extracellular space via mechanically activated Cx hemichannels, and its subsequent uptake by fiber cells. This mechanism protects fiber cells from oxidative stress and accumulation of ROS induced by hydrogen peroxide.

Similar articles

References

    1. Böhm E.W., Buonfiglio F., Voigt A.M., Bachmann P., Safi T., Pfeiffer N., Gericke A. Oxidative stress in the eye and its role in the pathophysiology of ocular diseases. Redox Biol. 2023;68 - PMC - PubMed
    1. Giblin F.J. Glutathione: a vital lens antioxidant. J. Ocul. Pharmacol. Therapeut. 2000;16:121–135. - PubMed
    1. Lou M.F. Thiol regulation in the lens. J. Ocul. Pharmacol. Therapeut. 2000;16:137–148. - PubMed
    1. Ganea E., Harding J.J. Glutathione-related enzymes and the eye. Curr. Eye Res. 2006;31:1–11. - PubMed
    1. Umapathy A., Donaldson P., Lim J. Antioxidant delivery pathways in the anterior eye. BioMed Res. Int. 2013;2013 - PMC - PubMed

LinkOut - more resources