. 2025 Jul 15;6(7):102238.
doi: 10.1016/j.xcrm.2025.102238.

Metabolic fingerprinting enables rapid, label-free histopathology in gastric cancer diagnosis and prognostic prediction

Affiliations

Metabolic fingerprinting enables rapid, label-free histopathology in gastric cancer diagnosis and prognostic prediction

Fei Teng et al. Cell Rep Med. .

Abstract

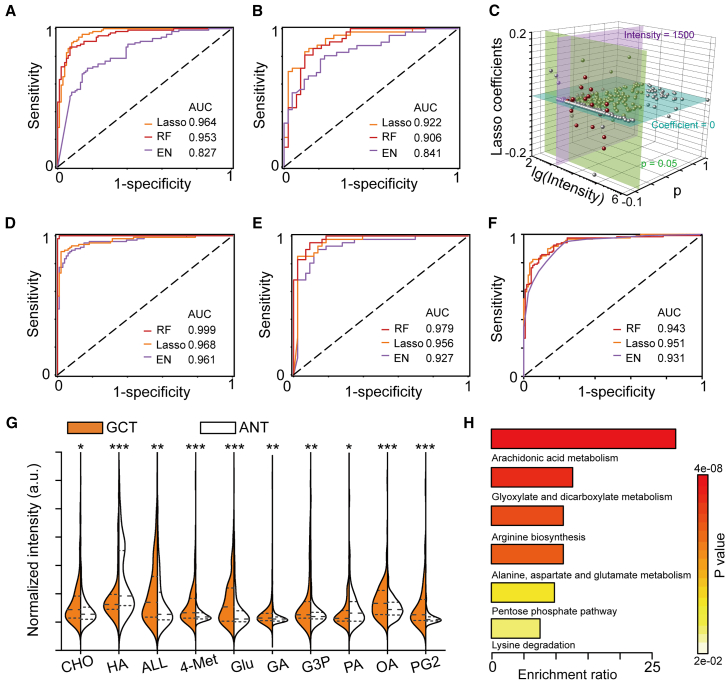
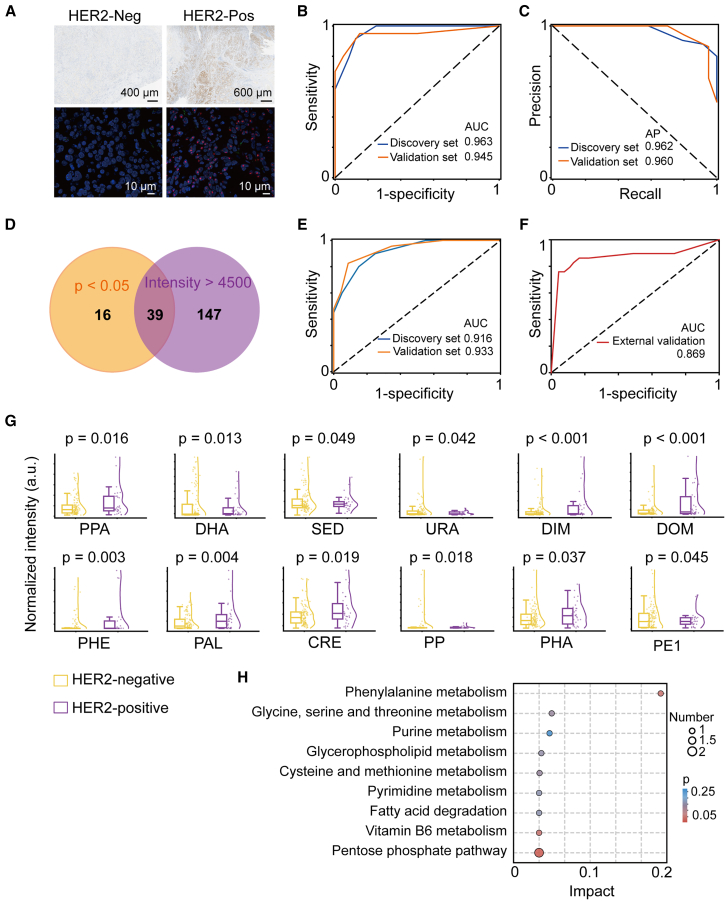
Histopathological evaluation is a cornerstone of cancer identification but often involves time-consuming labeling processes (∼days per sample) and experience-dependent interpretation. Herein, we introduce a rapid (∼40 min per sample) and label-free histopathological method based on metabolic fingerprinting of tissue using nanoparticle-enhanced laser desorption/ionization mass spectrometry. Applied to gastric cancer (GC, n = 284 paired tissue), this approach distinguishes malignant from benign tissues (area under the curve [AUC] of 0.979), identifies tumor subtypes (AUC of 0.963), and assesses prognosis (p < 0.05) without specialized pathologists. External validation on 238 samples from an independent cohort confirmed its robustness. This method advances histopathological analysis, offering potential for scalable clinical use.

Keywords: diagnosis; gastric cancer; metabolic biomarkers; pathology; prognosis; tissue.


Conflict of interest statement

Declaration of interests The authors declare competing financial interests. Both the technology and the method of detecting bio-samples are patented by the authors.

Figures

None
Graphical abstract
Figure 1
Figure 1
Schematic of the metabolic fingerprinting of tissue microarrays assisting in histopathological evaluation for both diagnosis and prognosis (A) TMAs (including gastric cancer tissue [GCT] and adjacent normal tissue [ANT) cores]) were employed for the extraction of tissue metabolic fingerprints (TMFs). (B) The extracted tissue metabolites were loaded onto microarray chips following matrix printing. (C) TMF database was constructed based on the original mass spectra of the tissue samples recorded by NPELDI-MS. Subsequently, the TMFs were analyzed for GC diagnosis by machine learning. In parallel, a prognostic prediction model for GC survival analysis was constructed.
Figure 2
Figure 2
Feasibility of NPELDI-MS for formalin-fixed paraffin-embedded tissue metabolic analysis (A) The optimized metabolic profiling workflow for FFPE tissues, including tissue deparaffinization, metabolite extraction, and sample loading. (B) The total ion count (TIC) in metabolites extracted from FFPE tissues (n = 3) using three different deparaffinization methods, including non-deparaffinization, xylene deparaffinization, and 70°C heating deparaffinization methods. Error bars denote mean ± SD. (C) The TIC in metabolites extracted from FFPE tissues (n = 3) using four typical extractants, including extractant A (methanol/H2O, 30/70, v/v), extractant B (methanol/H2O, 80/20, v/v), extractant C (methanol/H2O/acetonitrile, 70/15/15, v/v/v), and extractant D (methanol/H2O/acetonitrile, 60/10/30, v/v/v). Error bars denote mean ± SD. (D) The coefficients of variation (CVs) for samples in five independent tests of three samples showing high reliability of the platform for further metabolic analysis. (E and F) (E) Pearson correlation coefficients (0.86–0.94) between FFPE and frozen samples and (F) the cosine similarity scores of the mass spectrum (0.88–0.94) demonstrated the robust metabolic characterization.
Figure 3
Figure 3
Characterization of TMFs based on TMA (A) Schematic of the construction of TMFs. Initially, tissues from the TMA were histopathologically examined and categorized as either GCT or ANT. Subsequently, the optimized metabolic profiling workflow was employed for the extraction of metabolites from the TMA tissues, facilitating subsequent mass spectrometry detection. (B) Representative mass spectra of tissue samples from the GCT (upper) and ANT groups (bottom). (C) Heatmap depicted TMFs for 284 tissue sample cores collected from the TMA, encompassing 335 m/z signals for each sample after data preprocessing. The color scale was processed by logarithmic correction. (D) Frequency distribution of similarity scores in the GCT (upper) and ANT groups (bottom) revealed that over 90% of samples exhibited similarity scores exceeding 0.8 in both groups. (E and F) (E) The unsupervised t-distributed stochastic neighbor embedding (t-SNE) map visualization and (F) principal-component analysis (PCA) score plot of TMFs from 284 samples, with colors indicating group annotations, demonstrated a certain degree of overlap between the two groups. The colored ellipses show the 95% confidence intervals for each group.
Figure 4
Figure 4
Construction of a TMF-based diagnostic model (A and B) Receiver operating characteristic (ROC) curves for GC diagnosis based on TMFs, with an area under the curve (AUC) of (A) 0.827–0.964 for the discovery set and (B) 0.841–0.922 for the validation set. (C) Screening criteria for feature selection and metabolic biomarker panel construction, including p < 0.05, mean intensity > 1,500, and lasso coefficient ≠ 0. (D and E) ROC curves for GC diagnosis based on the selected features, with AUCs of (D) 0.961–0.999 for the discovery set and (E) 0.927–0.979 for the validation set. (F) ROC curves for GC diagnosis based on the selected features, with AUCs of 0.931–0.951 in the independent external verification dataset. (G) The violin plot illustrated the differential expression of 10 metabolites between the GCT group (orange) and ANT group (white), with p values indicated on top of each plot (∗ indicated p < 0.05, ∗∗ indicated p < 0.01, and ∗∗∗ indicated p < 0.001). Specifically, 8 metabolites, including choline (CHO), allysine (ALL), 4-methylcatechol (4-Met), glutamic acid (Glu), gentisic acid (GA), glyceraldehyde 3-phosphate (G3P), oleic acid (OA), and prostaglandin G2 (PG2), were upregulated (p < 0.05), while 2 metabolites, hydroxypyruvic acid (HA) and palmitoleic acid (PA), were downregulated (p < 0.05) in the GCT group compared to the ANT group. (H) The pathways differentially regulated in the GCT group include arachidonic acid metabolism; glyoxylate and dicarboxylate metabolism; alanine, aspartate, and glutamate metabolism; arginine biosynthesis; pentose phosphate pathway; and lysine degradation (p < 0.05 and impact factor > 0.1).
Figure 5
Figure 5
Development of the TMF-based subtyping model in GC (A) Immunohistochemical staining and fluorescence in situ hybridization (FISH) images showing HER2-negative (HER2-Neg) and HER2-positive (HER2-Pos) GC tissues. (B) Receiver operating characteristic (ROC) curves for GC subtyping based on TMFs, with an area under the curve (AUC) of 0.963 (95% CI: 0.917–1.000) in the discovery set t and 0.945 (95% CI: 0.867–1.000) in the validation set. (C) Precision-recall (PR) curves, with an average precision (AP) of 0.962 for the discovery set and 0.960 for the validation set, reflected the precision and recall balance of the model for the differentiation between HER2-negative and HER2-positive. (D) Screening criteria for feature selection and metabolic biomarker panel construction, including p < 0.05, mean intensity > 4,500. (E) ROC curves for differentiation between HER2-negative and HER2-positive based on the biomarkers, with an AUC of 0.916 for the discovery set and 0.933 for the validation set. (F) ROC curves for GC diagnosis based on the selected features, with AUC of 0.869 in the independent external verification dataset. (G) The differential expression of 12 metabolites between the HER2-negative group (yellow) and HER2-positive group (purple) is illustrated, with p values displayed above each plot. Specifically, the HER2-positive group showed elevated levels of several metabolites, including phosphohydroxypyruvic acid (PPA), N, N-dimethylsphingosine (DOM), phenylethylamine (PHE), palmitoylcarnitine (PAL), dimethylethanolamine (DIM), creatinine (CRE), and 2-oxo-3-hydroxy-4-phosphobutanoic acid (HPA), in contrast to the HER2-negative group. Conversely, metabolites such as dehydroascorbic acid (DHA), sedoheptulose (SED), ursocholic acid (URA), phosphoribosyl pyrophosphate (PP), and prostaglandin E1 (PE1) exhibited decreased abundance. The boxplots represent the mean, median, and lower/upper quartiles, with whiskers indicating the inner fences. (H) Pathway analysis of differentially expressed metabolites between HER2-positive and HER2-negative GC groups.
Figure 6
Figure 6
Proteomic analysis of GC tissue (A) Protein abundance of each sample. (B) Principal-component analysis (PCA) plot of proteomic data from GCT and ANT. The plot illustrated the separation of the two tissue types based on their protein expression profiles, indicating distinct proteomic signatures associated with cancer. The colored ellipses show the 95% confidence intervals for each group. (C) Volcano plot representing the differential expression of proteins between GCT and ANT. (D) Kyoto Encyclopedia of Genes and Genomes pathway analysis based on proteomic data, highlighting significantly altered metabolic pathways in GCT (p < 0.05), with the pentose phosphate pathway overlapping with the metabolomic data. (E) Diagram of the pentose phosphate pathway (PPP) and the abundance of the key enzymes. Error bars denote mean ± SD (n = 58 patients per group). Key enzymes in the pathway were labeled in red italics, including ribose-5-phosphate isomerase (RPI), transketolase (TKT), and glucose-6-phosphate dehydrogenase (G6PD). Black arrows indicate the upregulation of these enzymes. The upregulation of the metabolite glyceraldehyde 3-phosphate (G3P) identified in the pathway was shown with brown arrows.∗∗∗ indicates p < 0.001. (F) Representative immunohistochemical (IHC) staining images of RPI, TKT, and G6PD. The scale bar was 100 μm. (G) Quantified IHC results indicating higher expression levels of RPI, TKT, and G6PD in GCT compared to ANT. The boxplots represent the mean, median, and lower/upper quartiles. ∗ indicates p < 0.05, ∗∗ indicates p < 0.01, and ∗∗∗ indicates p < 0.001
Figure 7
Figure 7
Development of a prognostic model for gastric cancer survival prediction (A) Workflow for developing the prognostic model to calculate tissue metabolic prognostic (TMP) scores. (B–D) Overall survival time and TMP scores for each patient. Specifically, the high-TMP group comprised 50 observations with 36 events in the discovery set and 21 observations with 17 events in the independent external verification set, whereas the low-TMP group consisted of 49 observations with 26 events in the discovery set and 22 observations with 9 events in the independent external verification set. Kaplan-Meier curves for the overall survival of patients in the low-TMP group (orange line) and high-TMP group (green line) with p < 0.05 by log rank test in the (C) discovery set and (D) validation set.

References

    1. Shmatko A., Ghaffari Laleh N., Gerstung M., Kather J.N. Artificial intelligence in histopathology: enhancing cancer research and clinical oncology. Nat. Cancer. 2022;3:1026–1038. doi: 10.1038/s43018-022-00436-4. - DOI - PubMed
    1. Hölscher D.L., Bouteldja N., Joodaki M., Russo M.L., Lan Y.-C., Sadr A.V., Cheng M., Tesar V., Stillfried S.V., Klinkhammer B.M., et al. Next-Generation Morphometry for pathomics-data mining in histopathology. Nat. Commun. 2023;14:470. - PMC - PubMed
    1. Brimo F., Schultz L., Epstein J.I. The value of mandatory second opinion pathology review of prostate needle biopsy interpretation before radical prostatectomy. J. Urol. 2010;184:126–130. doi: 10.1016/j.juro.2010.03.021. - DOI - PubMed
    1. Elmore J.G., Longton G.M., Carney P.A., Geller B.M., Onega T., Tosteson A.N.A., Nelson H.D., Pepe M.S., Allison K.H., Schnitt S.J., et al. Diagnostic concordance among pathologists interpreting breast biopsy specimens. JAMA. 2015;313:1122–1132. doi: 10.1001/jama.2015.1405. - DOI - PMC - PubMed
    1. Cubillos-Ruiz A., Guo T., Sokolovska A., Miller P.F., Collins J.J., Lu T.K., Lora J.M. Engineering living therapeutics with synthetic biology. Nat. Rev. Drug Discov. 2021;20:941–960. - PubMed