. 2025 Aug;644(8078):960-968.
doi: 10.1038/s41586-025-09352-w. Epub 2025 Jul 16.

Temperature-related hospitalization burden under climate change

Affiliations

Temperature-related hospitalization burden under climate change

Shujie Liao et al. Nature. 2025 Aug.

Abstract

Climate change has markedly increased adverse effects on human health and economic growth1-3. However, few studies have differentiated the impacts of extreme temperatures at the city level and analysed the future implications for human health under various climate change scenarios4-6. Here we leverage data on historical relationships among six kinds of climate-sensitive diseases (CSDs) and associated hospitalizations and temperatures across 301 cities (more than 90% of all cities) and more than 7,000 hospitals in China, and use a nonlinear distributed lag model. This study projects hospitalization risks associated with extreme temperatures through to the year 2100 and develops the hospitalization burden economic index to assess the burden under three carbon emission scenarios across cities. Five dimensions, including spatial distribution, disease categories, population age groups, future time horizons and carbon emission development pathways, have been evaluated. Historical data indicate a higher incidence of temperature-related risks among the CSDs in northwestern and southwestern China. Notably, gestation-related disease risks are associated with increased vulnerability to extreme heat in specific regions. The projections show that under current thermal conditions without adaptations, the excess hospitalizations from extreme heat will reach 0.6, 3.8 and 5.1 million by 2100 under the low-, middle- and high-emission scenarios, respectively. These findings highlight the need for targeted mitigation strategies to reduce uneven climate-related hospitalization risks and economic burdens while accounting for differences in city geography, extreme temperatures, population groups and carbon emission development pathways.


Conflict of interest statement

Competing interests: The authors declare no competing interests.

Figures

Fig. 1
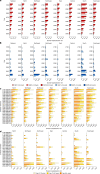
Fig. 1. The impact of temperature on hospitalization.
a,b, RR of extreme heat (a) and cold (b) for hospital admissions at the 95th and 5th percentile temperatures across 295 cities in China over 2021–2023. The RR of hospitalization associated with extreme heat and cold across Chinese cities is shown, stratified by six kinds of CSD categories: circulatory diseases; respiratory diseases; genitourinary diseases; endocrine, nutritional and metabolic diseases; psychiatric diseases; and GRDs (including pregnancy, childbirth and puerperium-related conditions). The cut-out of islands is the South China Sea Islands. The data for the basis map were sourced from the Standard Map Service Platform (http://bzdt.ch.mnr.gov.cn) supervised by the Ministry of Natural Resources of China. The approval number of the basemap is 2023 (2767). The grey areas on the map indicate regions with no data. c, Age differences in the RR of extreme heat compared with extreme cold across 21 provincial capital cities in different regions. The risk associated with extreme heat (95th percentile) and extreme cold (5th percentile) is shown. d, Estimated results of the associations between different temperature effects (with 95% confidence interval) and hospitalization. Data are presented as regression coefficients with 95% confidence intervals based on regression analyses with varying sample sizes: north (n = 27,894), northeast (n = 36,961), east (n = 81,475), south (n = 37,552), central (n = 44,943), southwest (n = 40,748), northwest (n = 47,750), and national (n = 319,469) observations. *P < 0.1, **P < 0.05, ***P < 0.01.
Fig. 2
Fig. 2. Future changes in the frequency of extreme heat and extreme cold temperature events.
a, The annual frequency of extreme heat events. b, The annual frequency of extreme cold events.
Fig. 3
Fig. 3. Excess hospitalization risk in regions related to extreme heat and cold under the T1 threshold calculation for each future year (2030–2100).
a,b, Excess hospitalization risk of future extreme heat events (a) and extreme cold events (b) under three emission scenarios. c,d, Future excess hospitalization risk from extreme heat (c) and extreme cold (d) across three age groups under three emission scenarios.
Fig. 4
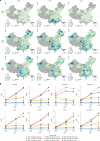
Fig. 4. Future excess heat-related hospitalization medical burden.
a, The HBEI of heat-related hospitalizations in China in the years 2030, 2070 and 2100, reflecting the proportion of excess hospitalization costs due to extreme temperatures relative to the total GDP. The grey areas on the map indicate regions with no data. b, Heat-attributable HBEI across three age groups and multiple regions.
Extended Data Fig. 1
Extended Data Fig. 1. Disease differences in the relative risk of extreme heat versus extreme cold in cities in different regions.
RRs of hospital admissions at the 95th (a) and 5th (b) percentile temperatures for five different disease categories—circulatory, respiratory, endocrine/metabolic, psychiatric, and genitourinary diseases—across 21 provincial capital cities in China. The top panel displays the RRs of extremely high temperatures (95th percentile), whereas the bottom panel shows the RRs of extremely low temperatures (5th percentile). Each point represents the estimated RRs for a specific disease category, providing a detailed analysis of how extreme temperatures impact hospital admissions for different health conditions.
Extended Data Fig. 2
Extended Data Fig. 2. Sex differences in the relative risk of extreme heat versus extreme cold in cities in different regions.
The vertical axis of the figure is RRs. The figure presents RRs of hospital admissions at the 95th (a) and 5th (b) percentile temperatures for males and females across 21 provincial capital cities selected from the seven geographic regions in China. Each point represents the estimated RRs for males and females, allowing for comparisons between sexes and across different cities.
Extended Data Fig. 3
Extended Data Fig. 3. Sex differences in the relative risks of extreme heat versus extreme cold across cities.
Relative risks of hospital admission for males under extreme heat (a) versus extreme cold (b) and females under extreme heat (c) versus extreme cold (d) in Chinese cities.
Extended Data Fig. 4
Extended Data Fig. 4. Relative risks of extreme heat versus extreme cold in 21 provincial capitals.
Relative risks of hospitalization at the 95th percentile (extreme heat) and 5th percentile (extreme cold) temperatures for each city grouped by region.
Extended Data Fig. 5
Extended Data Fig. 5. Hospital admissions across temperature percentiles by age group.
The x-axis represents temperature percentiles, with lower percentiles (colder temperatures) on the left and higher percentiles (warmer temperatures) on the right. The y–axis shows the number of hospital admissions, with different age groups distinguished by color.
Extended Data Fig. 6
Extended Data Fig. 6. Impact of temperature on hospital admission for gestation–related diseases (GRDs).
Geographic distribution of extreme temperature–associated hospitalization risks for GRDs across Chinese cities, showing extreme heat (a) and cold (b) patterns. (a) GRDs thermal risk demarcation line for extreme heat, where cities north of this threshold (red dashed line) (~31°N) present elevated relative risks for GRDs hospitalizations. (b) GRDs thermal risk demarcation line of extreme cold, with cities south of this threshold (blue dashed line) (~39°N) demonstrating increased cold–associated risk.
Extended Data Fig. 7
Extended Data Fig. 7. Projected temperature trends over time in China.
Future temperature change trends across different regions under three emission scenarios.
Extended Data Fig. 8
Extended Data Fig. 8. Future temperature thresholds.
Future temperature thresholds across different regions are calculated via three evaluation methods for extreme temperatures, a for heat and b for cold.
Extended Data Fig. 9
Extended Data Fig. 9. Future excess hospitalization risks attributed to temperatures under T0.
(a) Heat-related temperatures and (b) cold-related temperatures.T0, above 27.5 °C and below 12.5 °C.
Extended Data Fig. 10
Extended Data Fig. 10. Future excess hospitalization risks attributed to temperatures under T2.
(a) Heat-related temperatures and (b) cold-related temperatures.T2, temperature thresholds change annually, assuming a trend of temperature adaptation.
Extended Data Fig. 11
Extended Data Fig. 11. Future regional excess hospitalization costs and GDP (Unit: RMB, T1, no adaptation).
a represents the excess heat–related costs, and b represents the GDP under different carbon emission scenarios.
Extended Data Fig. 12
Extended Data Fig. 12. Relationship between HBEI and hospital availability under extreme heat across three emission scenarios.
Number of Hospitals represents the total number of hospitals in each city, while Number of Class III Hospitals refers to tertiary hospitals, which provide more comprehensive and higher-quality medical care.
Extended Data Fig. 13
Extended Data Fig. 13. Excess hospitalizations attributable to extremely hot and cold temperatures across different regions.
Here, the unit label on the y-axis uses “K” to denote thousands, whereas “M” denotes millions.

References

    1. Carleton, T. A. & Hsiang, S. M. Social and economic impacts of climate. Science353, aad9837 (2016). - PubMed
    1. Campbell-Lendrum, D., Neville, T., Schweizer, C. & Neira, M. Climate change and health: three grand challenges. Nat. Med.29, 1631–1638 (2023). - PubMed
    1. Wong, C. Climate change is also a health crisis — these 3 graphics explain why. Nature624, 14–15 (2023). - PubMed
    1. Rising, J., Tedesco, M., Piontek, F. & Stainforth, D. A. The missing risks of climate change. Nature610, 643–651 (2022). - PubMed
    1. Gasparrini, A. et al. Mortality risk attributable to high and low ambient temperature: a multicountry observational study. Lancet386, 369–375 (2015). - PMC - PubMed

MeSH terms

LinkOut - more resources