. 2025 Jul 16;15(1):25812.
doi: 10.1038/s41598-025-10947-6.

Evaluating the impact of denoising diffusion MRI data on tractometry metrics of optic tract abnormalities in glaucoma

Affiliations

Evaluating the impact of denoising diffusion MRI data on tractometry metrics of optic tract abnormalities in glaucoma

Daiki Taguma et al. Sci Rep. .

Abstract

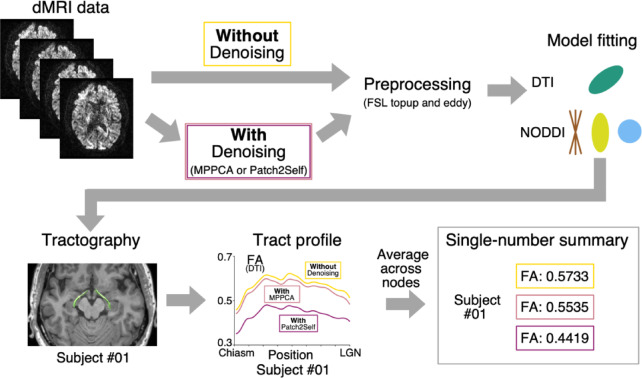
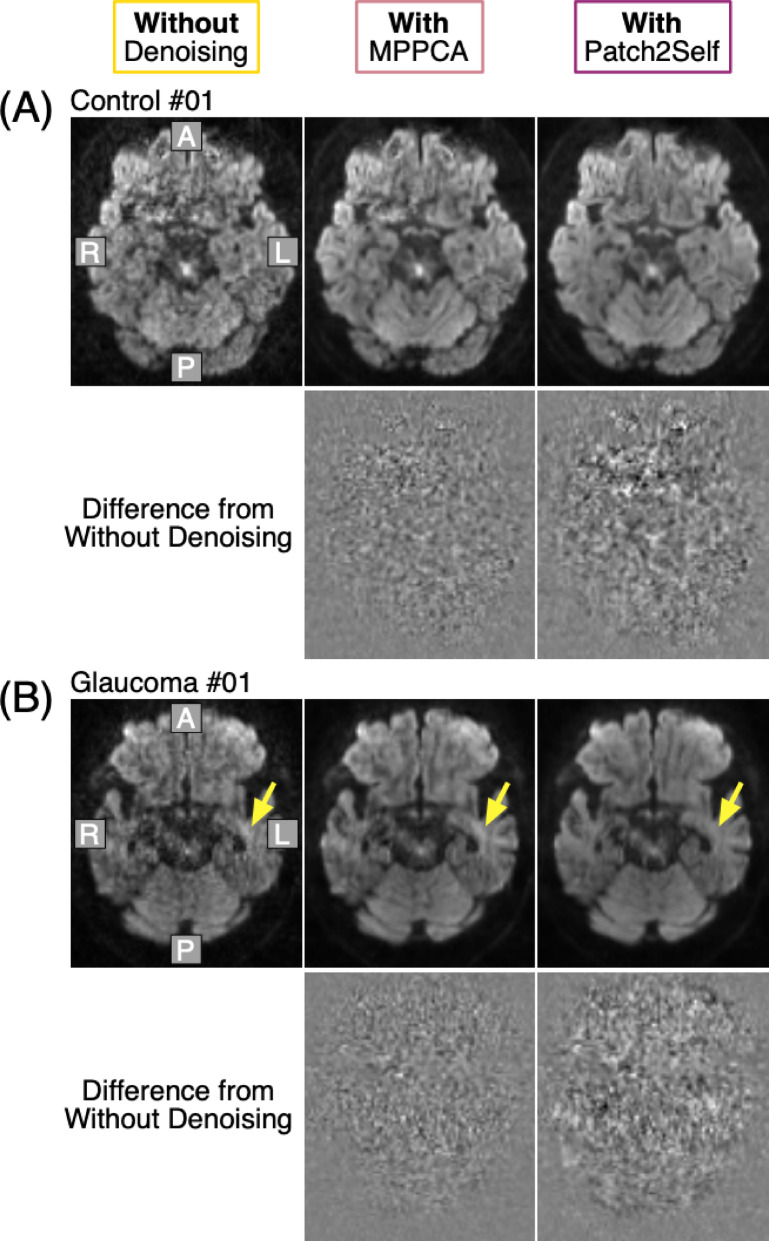
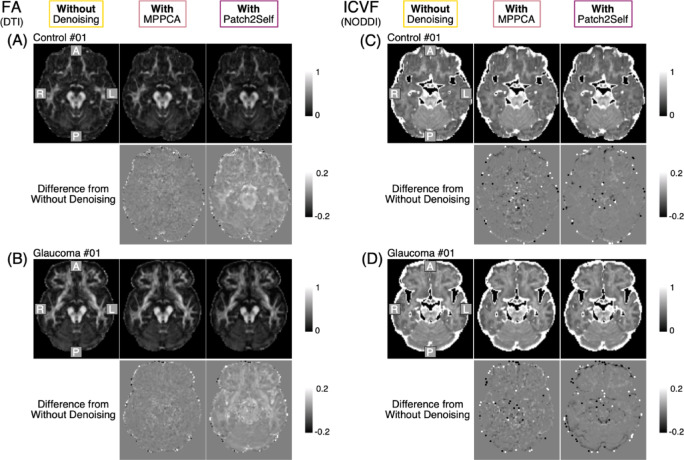
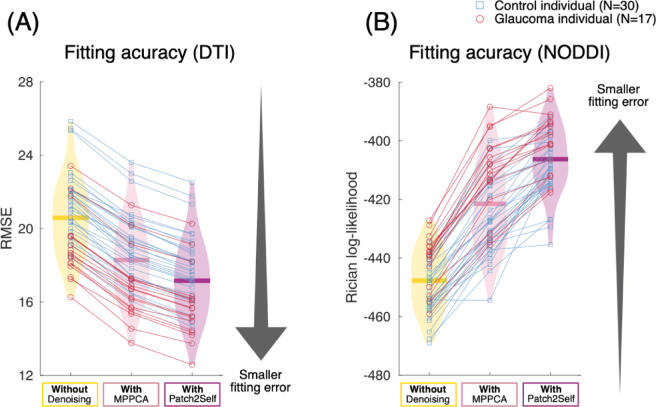
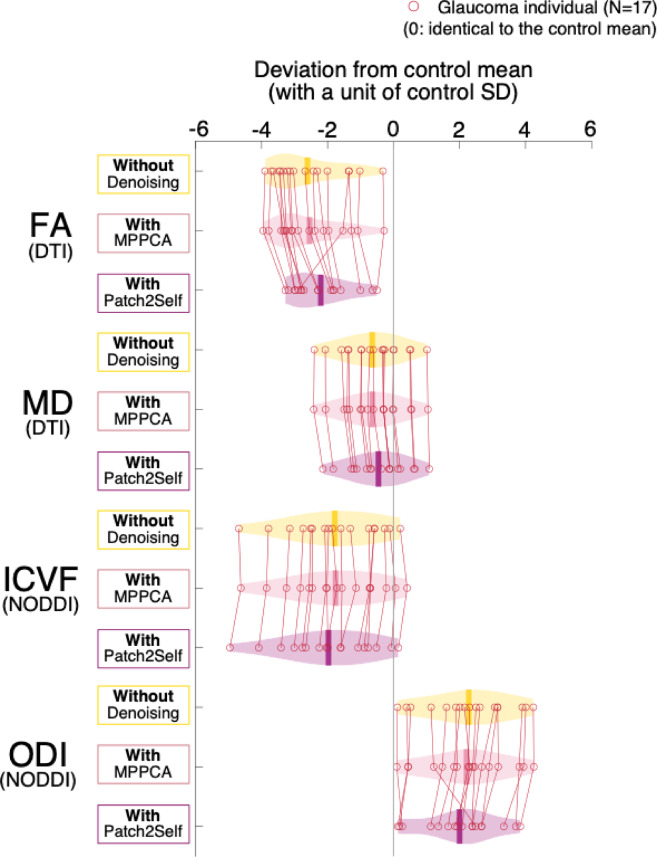
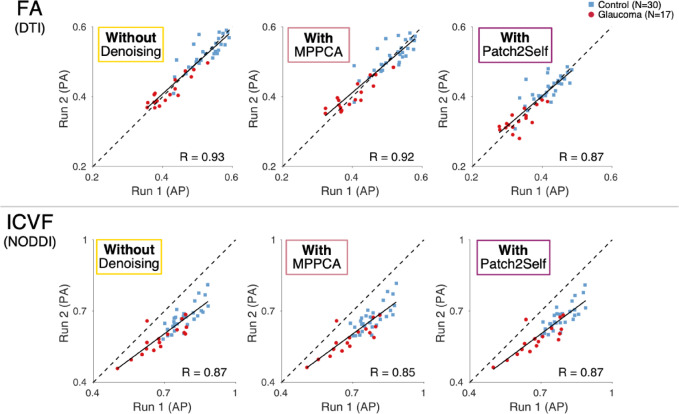
Diffusion MRI (dMRI)-based tractometry is a non-invasive neuroimaging method for evaluating white matter tracts in living humans, capable of detecting abnormalities caused by disorders. However, measurement noise in dMRI data often compromises the signal quality. Several denoising methods for dMRI have been proposed, but the extent to which denoising affects tractometry metrics of white matter tissue properties associated with disorders remains unclear. We evaluated how denoising affects tractometry along the optic tract (OT) in patients with glaucoma. Because glaucoma damages retinal ganglion cells, the OT in patients with glaucoma is likely to exhibit tissue abnormalities. Therefore, we examined dMRI data from patients with glaucoma to evaluate how two widely used denoising methods (MPPCA and Patch2Self) affect tractometry metrics regarding the expected tissue changes in the OT. We found that denoising affected the appearance of diffusion-weighted images, increased the estimated signal-to-noise ratio, and reduced residuals in voxelwise model fitting. However, denoising had a limited impact on the differences in tractometry metrics of the OT between patients with glaucoma and controls. Moreover, we found no evidence that denoising improved the reproducibility of tractometry. These findings suggest that the current denoising methods have a limited impact when used together with a tractometry framework.

Keywords: Denoising; Diffusion MRI; Glaucoma; Optic tract; Tractometry; White matter.


Conflict of interest statement

Declarations. Competing interests: The authors declare no competing interests.

Figures

Fig. 1
Fig. 1
Schematic diagram of the data processing pipeline for dMRI-based tractometry approaches. In common practice, after acquiring dMRI data (left top panel), researchers may apply denoising algorithms on the dMRI dataset. We compared the analysis results with (purple) and without denoising (yellow) while keeping the subsequent processing procedure the same. dMRI data are then typically preprocessed to correct for susceptibility- and eddy-current distortions,. After preprocessing, researchers fit voxelwise diffusion models (diffusion tensor imaging, DTI; neurite orientation and dispersion imaging, NODDI) to dMRI data in each voxel to quantify white matter microstructural properties. Tractography is used to identify a white matter tract of interest (in this study, the optic tract; green in the left bottom panel). Researchers can then calculate a tract profile,, which is a summary of voxelwise measurements along the tract (bottom middle figures). Finally, these tract profiles were averaged along the spatial position along the tract to obtain a single-number summary per subject, for each metric and tract. We compared these metrics per subject between data with and without denoising.
Fig. 2
Fig. 2
Diffusion-weighted images with and without denoising in representative subjects (A a healthy control, B a patient with glaucoma). The top panel depicts diffusion-weighted images in an axial section (left, image without denoising; middle, image with MPPCA; right, image with Patch2Self). The bottom panel depicts difference maps between data without denoising and data with one of the denoising methods (MPPCA and Patch2Self). Letters in the image denote image orientation (A: anterior, P: posterior, L: left, R: right). Yellow arrows in panel B depict the location of white matter regions with high signal intensity in a diffusion-weighted image without denoising; the signal intensity is reduced after applying Patch2Self.
Fig. 3
Fig. 3
Impact of denoising on parameter maps estimated using DTI and NODDI in representative subjects (A, C a healthy control; B, D a patient with glaucoma). The top panels depict parameter maps calculated by DTI (A, B) and NODDI (C, D) in an axial section (left, image without denoising; middle, image with MPPCA; right, image with Patch2Self). This axial section is identical to that in Fig. 2. The bottom panels depict difference maps between data without denoising and data with one of the denoising methods (MPPCA and Patch2Self). Letters in the top left image of each panel denote image orientation (A: anterior, P: posterior, L: left, R: right).
Fig. 4
Fig. 4
Comparison of the estimated SNR on low b-value images along the OT between data with and without denoising. (A) The OT (green) of a representative subject (Control #01) overlaid on an axial section of the T1-weighted image. Letters in the image denote image orientation (A: anterior, P: posterior, L: left, R: right). (B) Comparison of the estimated SNR on low b-value data between data without denoising (yellow) and data with MPPCA. The vertical axis represents the estimated SNR. Blue squares depict data from individual control subjects whereas purple dots depict data from individual patients with glaucoma. Data points connected by lines were acquired from identical subjects. Thick horizontal lines in the violin plot represent the mean across subjects, whereas the widths of the shadowed areas represent the approximate frequency of data points.
Fig. 5
Fig. 5
Comparison of voxelwise model fitting in the OT between dMRI data with and without denoising. (A) Fitting of the diffusion tensor model (diffusion tensor imaging, DTI). The vertical axis represents the fitting error of the DTI quantified by the root mean square error (RMSE) for dMRI data with and without denoising (MPPCA and Patch2Self) in the OT, where a lower RMSE corresponds to a smaller error. Open squares/circles depict the data of individual subjects (blue square, controls; red circle, patients with glaucoma). Data points connected among different conditions (without denoising, with MPPCA, and with Patch2Self) by lines are data acquired from identical subjects. Thick horizontal lines in the violin plot represent the mean across subjects, whereas the widths of the violin plot represent the approximate frequency of data points in each condition and RMSE. (B) Fitting of the neurite orientation dispersion and density imaging (NODDI). The vertical axis depicts the fitting error of the NODDI quantified by the Rician log-likelihood for dMRI data with and without denoising in the OT. A higher Rician log-likelihood indicates smaller error. The other conventions are the same as those used in panel A.
Fig. 6
Fig. 6
Comparison of dMRI measurements to identify tissue property differences between patients with glaucoma and controls in the OT among data with and without denoising (MPPCA and Patch2Self). The horizontal axis represents the data of each dMRI-based metric (FA, MD, ICVF, and ODI) in patients with glaucoma normalized to the control mean. The unit of the horizontal axis indicates how much the data of patients with glaucoma deviated from the control mean (0) with a unit of the control standard deviation. The individual dots represent data of each patient with glaucoma, and dots connected by lines indicate data of identical subjects. Thick horizontal lines in the violin plot represent the mean among patients with glaucoma, whereas the widths of the violin plot represent the approximate frequency of data points in each metric and dataset (yellow, data without denoising; magenta, data with MPPCA; purple, data with Patch2Self).
Fig. 7
Fig. 7
Scan-rescan reliability of tractometry along the OT using two metrics (top, FA; bottom, ICVF) in data without and with denoising (left: data without denoising; middle, data with MPPCA; right, data with Patch2Self). The horizontal axis shows measurements in Run 1 (acquired with anterior-to-posterior [AP] phase encoding direction), whereas the vertical axis represents measurements in Run 2 (acquired with posterior-to-anterior [PA] phase encoding direction). Each dot represents data from individual subjects (blue squares, controls; red circles, patients with glaucoma). Solid lines indicate regression lines, while dotted lines represent identity lines.

Similar articles

References

    1. Ramrattan, R. S. et al. Prevalence and causes of visual field loss in the elderly and associations with impairment in daily functioning: the Rotterdam Study. Arch. Ophthalmol.119, 1788–1794 (2001). - PubMed
    1. McCarty, C. A., Nanjan, M. B. & Taylor, H. R. Vision impairment predicts 5 year mortality. Br. J. Ophthalmol.85, 322–326 (2001). - PMC - PubMed
    1. Iwase, A., Suzuki, Y., Araie, M. & Tajimi Study Group. Characteristics of undiagnosed primary open-angle glaucoma: the Tajimi Study. Ophthalmic Epidemiol.21, 39–44 (2014). - PubMed
    1. Gupta, N. & Yücel, Y. H. What changes can we expect in the brain of glaucoma patients? Surv. Ophthalmol.52 (Suppl 2), S122–S126 (2007). - PubMed
    1. Jones, D. K., Travis, A. R., Eden, G., Pierpaoli, C. & Basser, P. J. PASTA: Pointwise assessment of streamline tractography attributes. Magn. Reson. Med.53, 1462–1467 (2005). - PubMed

LinkOut - more resources