A comprehensive machine learning for high throughput Tuberculosis sequence analysis, functional annotation, and visualization
- PMID: 40670587
- PMCID: PMC12267406
- DOI: 10.1038/s41598-025-98654-0
A comprehensive machine learning for high throughput Tuberculosis sequence analysis, functional annotation, and visualization
Abstract
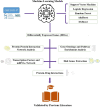
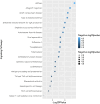
With human guidance, computers now use machine learning (ML) in artificial intelligence (AI) to learn from data, detect trends, and make predictions. Software can adapt and improve with new information. Imaging scans leverage pattern recognition to predict outcomes, diagnose disorders, and suggest treatments. Tuberculosis (TB) remains the most common bacterial disease affecting humans. The World Health Organisation reported that in 2022, 1.3 million people died from tuberculosis, with the death rate potentially reaching 66% if proper treatment isn't provided. We trained ML-supervised algorithms like XG Boost, Logistic Regression, Random Forest Classifier, Ad- aBoost, and Support Vector Machine to help classify TB patients from large RNA-sequence count data. Such algorithms provided prediction accuracies of 0.963, 0.739, 0.773, 0.866, and 0.866 sequentially. This article highlights feature importance techniques using the ML model, XGBoost, with the highest prediction accuracy of 0.963, identifying significant genes in TB RNA sequence count data. Using key machine learning features, we here identified 20 pathways, 24 gene ontologies, 20 hub genes, and 22 drugs. Next, we applied advanced computational techniques, including pathway analysis, GO, hub-protein and protein-protein interactions (PPI), transcriptomic and miRNA interactions, and drug-protein interactions, to help analyze 100 highly expressed genes.
Keywords: Bioinformatics; DEGs; Gene ontology; Hub gene; ML; PPIs; Potential drug; TB.
© 2025. The Author(s).
Conflict of interest statement
Declarations. Competing interests: The authors declare no competing interests. Ethics approval and consent to participate: Not applicable. Ethical consideration: Not applicable. Consent for publication: Not applicable.
Figures


References
-
- Karim, M. R. et al. Explainable ai for bioinformatics: Methods, tools and applications. Brief. Bioinform.24(5), bbad236 (2023). - PubMed
-
- Kaisar, S. & Chowdhury, A. Integrating oversampling and ensemble-based machine learning techniques for an imbalanced dataset in dyslexia screening tests. ICT Express8(4), 563–568 (2022).
-
- Bagcchi, S. WHO’s global tuberculosis report 2022. The Lancet Microbe4(1), e20 (2023). - PubMed
MeSH terms
LinkOut - more resources
Full Text Sources
Medical

