. 2025 Aug;26(8):1267-1274.
doi: 10.1038/s41590-025-02202-x. Epub 2025 Jul 16.

Mitochondrial respiration is necessary for CD8+ T cell proliferation and cell fate

Affiliations

Mitochondrial respiration is necessary for CD8+ T cell proliferation and cell fate

Elizabeth M Steinert et al. Nat Immunol. 2025 Aug.

Abstract

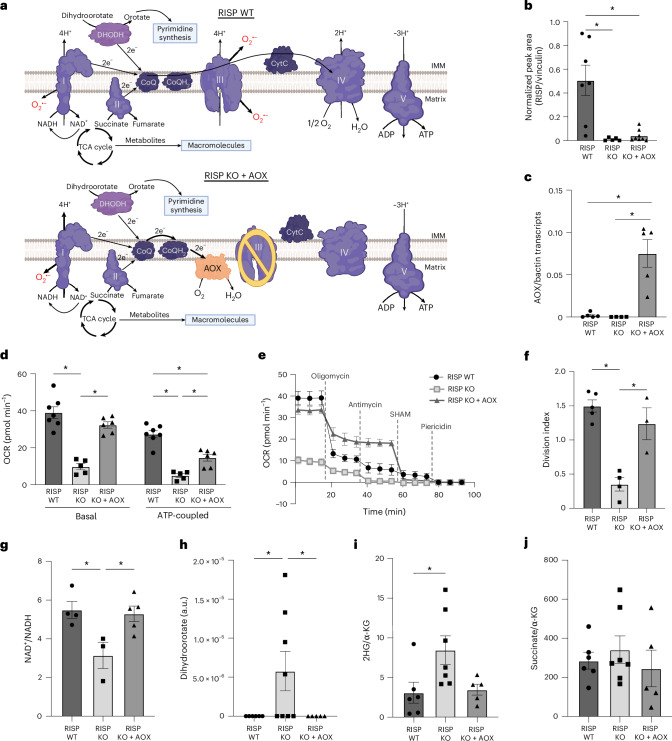
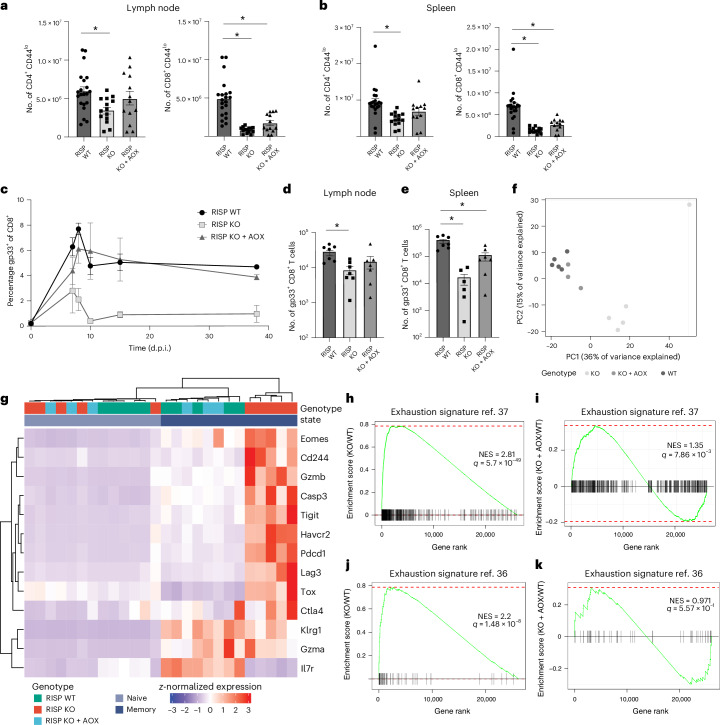
Mitochondrial electron transport chain (ETC) function is linked to the generation of ATP, signaling molecules including reactive oxygen species (ROS), pyrimidines and tricarboxylic acid cycle metabolites1. Mitochondrial electron transport is required for T cell proliferation2-4. However, which mitochondrial ETC functions are necessary for each dynamic state of CD8+ T cell responses is unknown. Here we report that impairing mitochondrial complex III function, which diminishes respiration, proton pumping linked to ATP production and superoxide production, decreases peripheral naive numbers, antigen-induced CD8+ T cell proliferation and memory formation. Acute stimulation of mitochondrial complex III-deficient CD8+ T cells induced an exhausted-like phenotype. Expression of Ciona intestinalis alternative oxidase (AOX) in mitochondrial complex III-deficient CD8+ T cells restores respiration without generating ROS or proton pumping, and rescues proliferation and the exhausted phenotype but not naive or memory formation. Thus, T cell development, proliferation and memory formation have distinct requirements for mitochondrial complex III ROS.


Conflict of interest statement

Competing interests: M.S. is a shareholder in a start-up company founded to develop therapeutics based on AOX. The other authors declare no competing interests.

Figures

Fig. 1
Fig. 1. AOX expression in the absence of mitochondrial complex III function restores mitochondrial respiration and in vitro T cell proliferation.
a, Schematic of WT (top) or RISP KO + AOX (bottom) ETC as in mice with Cre-driven recombination of floxed Uqcrfs1 (RISPfl/fl) and lox-stop-lox AOX (AOXLSL) expression. be, Isolated CD8+ T cells of the indicated genotypes were activated in vitro for 48 h then collected for RISP protein normalized to vinculin (b), AOX mRNA expression by qPCR (c), antimycin- and piericidin-corrected basal and ATP-coupled OCR (d), and antimycin, piericidin and SHAM-corrected OCR tracing (e). f, Isolated CD8+ T cells from indicated genotypes were labeled with Cell Trace Violet and anti-CD3ε/CD28 bead + IL-2, stimulated for 96 h then analyzed for the division index. gj, Isolated CD8+ T cells of the indicated genotypes were activated in vitro, then collected for NAD+/NADH measurements (g), or metabolomics (hj) measuring dihydroorotate (h), 2-hydroxygluterate (2HG) over α-ketogluterate (α-KG) ratio (i), or succinate over α-KG ratio (j). All data points represent individual mice as biological replicates: n = 7 WT, n = 5 KO, n = 8 KO + AOX (b); n = 5 WT, n = 4 KO, n = 5 KO + AOX (c); n = 6 WT, n = 5 KO, n = 6 KO + AOX (d,e); n = 5 WT, n = 4 KO, n = 3 KO + AOX (f); n = 4 WT, n = 3 KO, n = 6 KO + AOX (g); n = 6 WT, n = 7 KO, n = 5 KO + AOX (hj). Data are means ± s.e.m., *P < 0.05. Statistical tests for b, c and fj are one-way ANOVA with Tukey’s multiple-comparison test and for d are two-way ANOVA with Tukey’s multiple-comparison test. P values are: *P = 0.0018 WT/KO, *P = 0.001 WT/KO + AOX (b); *P = 0.0007 WT/KO + AOX, *P = 0.001 KO/KO + AOX (c); *P = < 0.0001 basal WT/KO, *P = < 0.0001, KO/KO + AOX, *P = < 0.0001, coupled WT/KO, *P = 0.0005, WT/KO + AOX, *P = 0.0149, KO/KO + AOX (d); *P = < 0.0001 WT/KO, *P = < 0.0001 KO/KO + AOX (f); *P = 0.0255 WT/KO, *P = 0.0319 KO/KO + AOX (g); *P = 0.0026 WT/KO, *P = 0.0052 KO/KO + AOX (h); *P = 0.0407 WT/KO (i). Panel a created using BioRender.com.
Fig. 2
Fig. 2. Mitochondrial respiration is required for CD8+ T cell proliferation in vivo.
a,b, CD4-Cre RISPfl/fl AOXLSL mice of indicated genotypes were harvested for direct ex vivo quantification from pooled peripheral lymph nodes (a) or spleen (b). ck, CD4-Cre RISPfl/fl AOXLSL mice of indicated genotypes were infected with LCMV Armstrong and gp33 tetramer-positive cells were tracked over time in peripheral blood (c) then isolated at >40 days post-infection (d.p.i.) for quantification from pooled peripheral lymph nodes (d), quantification from spleen (e) and sorted along with a polyclonal naive CD8+ T cell control population from the same mice from pooled spleen and lymph nodes for RNA-seq (fk). f, PCA of gp33 tetramer-positive cells from each genotype. g, Heatmap of selected significantly differentially regulated exhaustion genes. hk, Sorted gp33 tetramer-positive cells analyzed for enrichment of published exhaustion gene expression profiles KO/WT (h) and KO + AOX/WT (i) from Utzschneider et al. and KO/WT (j) and KO + AOX/WT (k) from Wherry et. al. (j,k). NES, Normalized enrichment score. All data points represent individual mice as biological replicates: n = 21 WT, n = 14 KO, n = 13 KO + AOX (a); n = 21 WT, n = 14 KO, n = 12 KO + AOX (b); n = 9 WT, n = 6 KO, n = 6 KO + AOX (c); n = 7 WT, n = 7 KO, n = 7 KO + AOX (d); n = 7 WT, n = 7 KO, n = 7 KO + AOX (e); n = 5 WT, n = 5 KO, n = 3 KO + AOX (fk). Data are means ± s.e.m. *P < 0.05, statistical tests are one-way ANOVA with Tukey’s multiple comparisons test (LN CD4+ *P = 0.0205 WT/KO, LN CD8+ *P = < 0.0001 WT/KO, *P = < 0.0001 WT/KO + AOX (a); spleen CD4+ *P = 0.0022 WT/KO, spleen CD8+ *P = < 0.0001 WT/KO, spleen CD8+ *P = 0.0001 WT/KO + AOX (b); *P = 0.0154 WT/KO (d); *P = 0.0002 WT/KO, *P = 0.002 WT/KO + AOX (e)).
Fig. 3
Fig. 3. Mitochondrial respiration is required for CD8+ T cell memory differentiation in vivo.
a–j, Congenically marked P14 CD8+ T cells from CD4-Cre RISPfl/fl AOXLSL mice of the indicated genotype were adoptively transferred into naive mice which were then infected with LCMV Armstrong, evaluated by flow cytometry over time in peripheral blood (PBL) (a). Results after 7 d.p.i. in PBL (b), 45 d.p.i. in PBL (c) or isolated for quantification 65 d.p.i. from spleen (d) or pooled peripheral lymph nodes (LNs) (e). P14 phenotype and function were further evaluated by flow cytometry, gated on P14 representative flow plots from PBL 30 d.p.i. (f), over time from PBL (g), by restimulating splenocytes 30 d.p.i. with gp33 peptide for 4 h (h), or from spleen 30 d.p.i. (i) and from spleen 7 d.p.i. (j). All data points represent individual mice as biological replicates: n = 7 WT, n = 6 KO, n = 6 KO + AOX (ad); n = 7 WT, n = 5 KO, n = 6 KO + AOX (e); n = 5 WT, n = 3 KO, n = 4 KO + AOX (f,g); n = 5 WT, n = 3 KO, n = 5 KO + AOX (h,i); n = 3 WT, n = 3 KO, n = 3 KO + AOX (j). Data are means ± s.e.m., *P < 0.05. The statistical tests for bg, i and j are one-way ANOVA with Tukey’s multiple-comparison test and for h two-way ANOVA with Tukey’s multiple-comparison test (*P = 0.0007 WT/KO, *P = 0.0011 KO/KO + AOX (b); *P = 0.0262 WT/KO (c); *P = 0.0382 WT/KO (d); top % KLRG1+CD127 day 7, *P = 0.0018 WT/KO, *P = < 0.0001 KO/KO + AOX, *P = 0.04 WT/KO + AOX, day 15 *P = 0.0023 WT/KO, *P = 0.0194 KO/KO + AOX, day 21 *P = 0.0122 WT/KO, day 30 *P = < 0.0001 WT/KO, *P = 0.0175 KO/KO + AOX, *P = 0.0011 WT/KO + AOX; bottom % KLRG1CD127+ day 15 *P = 0.0006 WT/KO, *P = 0.0107 KO/KO + AOX, day 21 *P = 0.0053 WT/KO, *P = 0.0293 KO/KO + AOX, day 30 *P = < 0.0001 WT/KO, *P = 0.0028 KO/KO + AOX, *P = 0.0003 WT/KO + AOX (g); *P = 0.0058 WT/KO, 0.0439 KO/KO + AOX (h); day 30 PD-1 *P = 0.0361 WT/KO, LAG3 *P = 0.0361 WT/KO, TCF1 *P = 0.0251 WT/KO (i); day 7 PD-1 *P = 0.0255 WT/KO, *P = 0.0306 WT/KO + AOX, LAG3 *P = 0.0121 WT/KO and TIM3 *P = 0.0208) (j). gMFI, geometric mean fluorescence intensity.
Fig. 4
Fig. 4. Mitochondrial complex III-deficient CD8+ T cells adopt exhaustion-like fate in the absence of chronic antigen stimulation.
a,b, Splenic CD8+ T cells from CD4-Cre RISPfl/fl AOXLSL mice of indicated genotypes activated overnight with anti-CD3ε/CD28 beads + IL-2, then analyzed for pathway enrichment from gene set enrichment analysis (GSEA). Expression profiles were compared against the Molecular Signatures Database (MSigDb) Hallmark dataset v.0.3 with the addition of published exhaustion gene expression profiles from Utzschneider et al. and Wherry et al., as well as the ISR from Wong et al. (a); TOX expression (b). ce, Splenic CD8+ T cells from CD4-Cre RISPfl/fl AOXLSL mice of indicated genotypes stimulated in vitro for memory formation, experimental schematic (c), then analyzed by flow cytometry representative histograms (d) and mean fluorescence intensity of indicated markers (e). f, Splenic P14 CD8+ T cells enriched from CD4-Cre RISPfl/fl AOXLSL mice of indicated genotypes and stimulated in vitro before adoptive transfer into MC38-gp33 tumor-bearing mice 5 d after subcutaneous tumor administration, with tumors measured over time. All data points represent individual mice as biological replicates: n = 7 WT, n = 6 KO, n = 7 KO + AOX (a,b); n = 4 WT, n = 5 KO, n = 5 KO + AOX (e); n = 5 WT, n = 5 KO, n = 5 KO + AOX (f). Data in e and f are means ± s.e.m. *P < 0.05. The statistical test in e is one-way ANOVA with Tukey’s multiple-comparison test. In b, the boxplot limits represent the interquartile range (IQR) with a center line at the median and the statistical test is Wald’s test with false recovery rate correction. The whiskers represent the largest point within 1.5× the IQR. All points are overlaid with jittering (TOX *P = 0.0036 WT/KO, *P = 0.036 KO/KO + AOX, PD1 *P = 0.0001 WT/KO, *P = 0.0012 KO/KO + AOX, TIM3 *P = 0.0176 WT/KO, TCF7 *P = < 0.0001 WT/KO, *P = < 0.0001 KO/KO + AOX, Gzmb *P = 0.0139 WT/KO, *P = 0.0224 KO/KO + AOX, % CD62L *P = < 0.0001 WT/KO, *P = < 0.0001 WT/KO + AOX, *P = 0.0112 KO/KO + AOX (e)). max., maximum. Illustration in c created using BioRender.com.
Extended Data Fig. 1
Extended Data Fig. 1. Characterization of complex III deficient CD8+ T cells from CD4-Cre RISPfl/fl AOXLSL mice.
Isolated CD8+ T cells from CD4-Cre RISPfl/fl AOXLSL mice of indicated genotypes were activated in vitro for 48 hr then collected for (a) ECAR or (b) TMRE and MitoTracker Green staining for flow cytometry. GSEA of naïve CD8 T cells from (c) RISP KO/WT genotypes or (d) RISP KO + AOX/WT genotypes. Expression profiles were compared against the Molecular Signatures Database (MSigDb) ‘Hallmark’ dataset v0.3 with the addition of published exhaustion gene expression profiles from Utzschneider NatImmuno 2020 (ref. ) and Wherry Immunity 2007 (ref. ), as well as the integrated stress response from Wong eLife 2019 (ref. ) (a gift from C. Sidrauski at the Calico Life Sciences). All data points represent individual mice as biological replicates. a. n = 2 WT, n = 2 KO, n = 2 KO + AOX; b. n = 4 WT, n = 4 KO, n = 4 KO + ; c-d. n = 4 WT, n = 5 KO, n = 3 KO + AOX. For a-b. data are means ± s.e.m, *P < 0.05 and statistical test in b. is two-way ANOVA with Tukey’s multiple comparisons test.
Extended Data Fig. 2
Extended Data Fig. 2. T cell defects in naïve CD4-Cre RISPfl/fl AOXLSL mice.
Naïve CD4-Cre RISPfl/fl AOXLSL mice were used for direct ex vivo quantification by flow cytometry (a) of indicated populations from thymus, (b) percent of indicated naïve T cells that are apoptotic from pooled peripheral lymph nodes or (c) spleen (d) total indicated T cells from lymph nodes or spleen, (e) Percent of total T cell populations that express CD44 from lymph nodes or spleen, (f) percent of total T cell populations that are apoptotic by annexin V staining from lymph node or spleen. All data points represent individual mice as biological replicates, a. n = 20 WT, n = 13 KO, n = 10 KO + AOX; b-c. n = 8 WT, n = 7 KO, n = 6 KO + AOX; d. Lymph nodes n = 25 WT, n = 15 KO, n = 11 KO + AOX; Spleen n = 24 WT, n = 15 KO, n = 10 KO + AOX; e. Lymph nodes n = 21 WT, n = 15 KO, n = 13 KO + AOX; Spleen n = 21 WT, n = 14 KO, n = 12 KO + AOX; f. n = 8 WT, n = 7 KO, n = 6 KO + AOX. Data are means ± s.e.m, *P < 0.05, statistical tests are one-way ANOVA with Tukey’s multiple comparisons test, (d. CD4 LN *P = < 0.0376 WT/KO; CD8 LN *P = < 0.0001 WT/KO, *P = 0.0001 WT/KO + AOX; CD4+ Spleen *P = 0.0095 WT/KO, CD8+ Spleen *P = < 0.0001 WT/KO, *P = 0.0009 WT/KO + AOX; e. CD8+ LN *P = 0.0006 WT/KO; CD8+ Spleen *P = 0.163 KO/KO + AOX, *P = < 0.0001 WT/KO).
Extended Data Fig. 3
Extended Data Fig. 3. Gene expression of gp33+ memory CD8 T cells from CD4-Cre RISPfl/fl AOXLSL mice > 40 days after LCMV infection.
CD4-Cre RISPfl/fl AOXLSL mice of RISP WT, KO and KO + AOX genotypes were infected with LCMV Armstrong, and gp33 tetramer positive cells were sorted from spleen and lymph node for RNAseq along with a naïve CD8+ T cell control population from the same mice, (a) experimental strategy (b) isolated gp33 tetramer positive cells and polyclonal naïve cells from the same mice, heatmaps of all significantly differentially expressed genes among expression of all genes measured (c) GSEA of memory CD8 T cells from RISP KO/WT genotypes. Expression profiles were compared against the Molecular Signatures Database (MSigDb) ‘Hallmark’ dataset v0.3 with the addition of published exhaustion gene expression profiles from Utzschneider et. al. and Wherry et. al., as well as the integrated stress response from Wong eLife 2019 (ref. ) (a gift from C. Sidrauski at the Calico Life Sciences). (d) boxplots of selected genes from RNA-seq analysis. All data points represent individual mice as biological replicates, b-d. n = 4 WT, n = 5 KO, n = 3 KO + AOX. In d box plots, box limits represent the interquartile range with a center line at the median. Whiskers represent the largest point within 1.5× interquartile range. All points are overlaid with jittering. Statistical tests on boxplots are Wald test with FDR correction. Illustrations in a created using BioRender.com.
Extended Data Fig. 4
Extended Data Fig. 4. Gzmb-CreERT2 enables post-activation deletion of mitochondrial complex III (QPC) and AOX expression.
Gzmb-CreERT2 QPCfl/fl AOXLSL (a) experimental strategy, (b) diagram of gene recombination timing (c–h) Naïve mice were fed tamoxifen chow for 2 weeks before congenically marked P14 CD8+ T cells from Gzmb-CreERT2 QPCfl/fl AOXLSL mice of indicated genotypes were adoptively transferred by i.v. injection the day before infection with LCMV. P14 were (c) analyzed overtime in PBL or analyzed at day 7 post infection (d) from PBL, (e) for quantification from spleen, or (f) for quantification from pooled peripheral lymph nodes. P14 CD8+ T cells were sorted from pooled lymph nodes and spleen on day 7 post infection for RNAseq (g) and compared to established effector T cell profiles from Wherry et. al. (h) boxplots of gene expression for selected genes. All data points represent individual mice as biological replicates. c. n = 11 WT, n = 15 KO, n = 15 KO + AOX; d. n = 11 WT, n = 15 KO, n = 15 KO + AOX; e-f. n = 4 WT, n = 5 KO, n = 4 KO + AOX; g-h. n = 5 WT, n = 4 KO, n = 4 KO + AOX. Data in c-f are means ± s.e.m, *P < 0.05, and statistical tests for d-f are one-way ANOVA with Tukey’s multiple comparisons test. In h box plots, box limits represent the interquartile range with a center line at the median. Whiskers represent the largest point within 1.5× interquartile range. All points are overlaid with jittering. Statistical tests on boxplots are Wald test with FDR correction. (d. *P = < 0.0001 WT/KO, *P = < 0.0001 KO/KO + AOX, *P = < 0.0001 WT/KO + AOX; e. *P = 0.0038 WT/KO). Illustrations in a and b created using BioRender.com.
Extended Data Fig. 5
Extended Data Fig. 5. Gp33-specific CD8 T cell (P14) adoptive transfer and LCMV infection viral titers and Sox2Cre AOX recipients.
(a) Congenically marked P14 CD8+ T cells from CD4-Cre RISPfl/fl AOXLSL mice of indicated genotypes were adoptively transferred by i.v. injection the day before infection with LCMV Armstrong infection, and serum was collected on days 7, 15, 21 and 30 post infection for focus forming assay to determine viral titer. Serum from a mouse infected with LCMV Armstrong 4 days prior was used as a positive control. A horizontal dotted line is placed at 10^4 to indicate PFU limit of detection of the focus forming assay as previously described56. (b) Sox2-Cre AOXLSL mice were used as AOX globally expressing naïve recipients, which were fed tamoxifen chow for 2 weeks before congenically marked P14 CD8+ T cells from Gzmb-CreERT2 QPCfl/fl AOXLSL mice of indicated genotypes were adoptively transferred by i.v. injection the day before infection with LCMV and the P14 were followed in blood to determine if complex III deficient AOX expressing P14 were able to form normal memory populations in an AOX expressing mouse. All data points represent individual mice as biological replicates. a. day 4 endogenous control n = 5; day 7 n = 5 WT, n = 5 KO, n = 5 KO + AOX; day 15 n = 3 WT, n = 5 KO, n = 5 KO + AOX; day 21 n = 3 WT, n = 4 KO, n = 4 KO + AOX,;day 30 n = 5 WT, n = 5 KO, n = 5 KO + AOX; b. n = 5 WT, n = 4 KO, n = 5 KO + AOX. Data are means ± s.e.m, *P < 0.05, statistical test in a. is two-way ANOVA with Tukey’s multiple comparisons test. (a. D7*P = 0.0002 WT/KO, *P = 0.0015 WT/KO + AOX.).
Extended Data Fig. 6
Extended Data Fig. 6. CD4-Cre RISPfl/fl AOXLSL P14 adoptive transfer and LCMV Clone 13 infection.
CD4-Cre RISPfl/fl AOXLSL P14 were adoptively transferred into naïve C57bl6/J mice prior to infection with LCMV Clone 13 then isolated for phenotypic evaluation by flow cytometry (a) from spleen 15 days post infection, representative flow plots (b) quantification of indicted populations from 15 or 24 days post infection spleens or (c) gMFI of indicated markers at the indicated timepoints post infection from spleen. control All data points represent individual mice as biological replicates. b. n = 5 WT, n = 6 KO,; c. n = 3 WT, n = 3 KO. Data are means ± s.e.m, *P < 0.05, statistical test is one-way ANOVA (b. %TEX *P = 0.0118 WT/KO; c. D8 PD1 *P = 0.0142 WT/KO, D24 Gzmb *P = 0.0119 WT/KO).
Extended Data Fig. 7
Extended Data Fig. 7. Basic Gating Strategy Used in Flow Cytometry Analysis.
a, Basic flow cytometric gating strategy for the identification of CD8+ T cells for quantification and phenotypic analysis.

References

    1. Chakrabarty, R. P. & Chandel, N. S. Beyond ATP, new roles of mitochondria. Biochemist44, 2–8 (2022). - PMC - PubMed
    1. Sena, L. A. et al. Mitochondria are required for antigen-specific T cell activation through reactive oxygen species signaling. Immunity38, 225–236 (2013). - PMC - PubMed
    1. Tarasenko, T. N. et al. Cytochrome c oxidase activity is a metabolic checkpoint that regulates cell fate decisions during T cell activation and differentiation. Cell Metab.25, 1254–1268.e7 (2017). - PMC - PubMed
    1. Chen, X. et al. Succinate dehydrogenase/complex II is critical for metabolic and epigenetic regulation of T cell proliferation and inflammation. Sci. Immunol.7, eabm8161 (2022). - PMC - PubMed
    1. Brand, K., Williams, J. F. & Weidemann, M. J. Glucose and glutamine metabolism in rat thymocytes. Biochem. J.221, 471–475 (1984). - PMC - PubMed

MeSH terms

LinkOut - more resources