

Shared pathogenic mechanisms linking obesity and idiopathic pulmonary fibrosis revealed by bioinformatics and in vivo validation
- PMID: 40670650
- PMCID: PMC12267603
- DOI: 10.1038/s41598-025-12046-y
Shared pathogenic mechanisms linking obesity and idiopathic pulmonary fibrosis revealed by bioinformatics and in vivo validation
Abstract
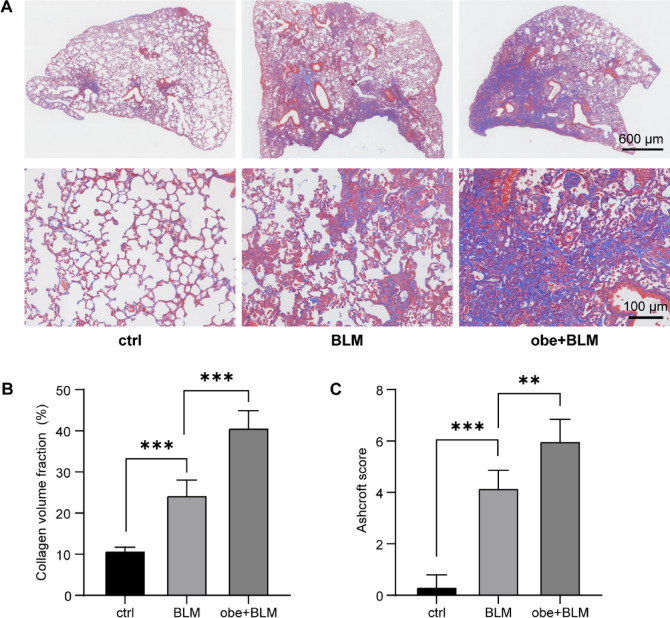
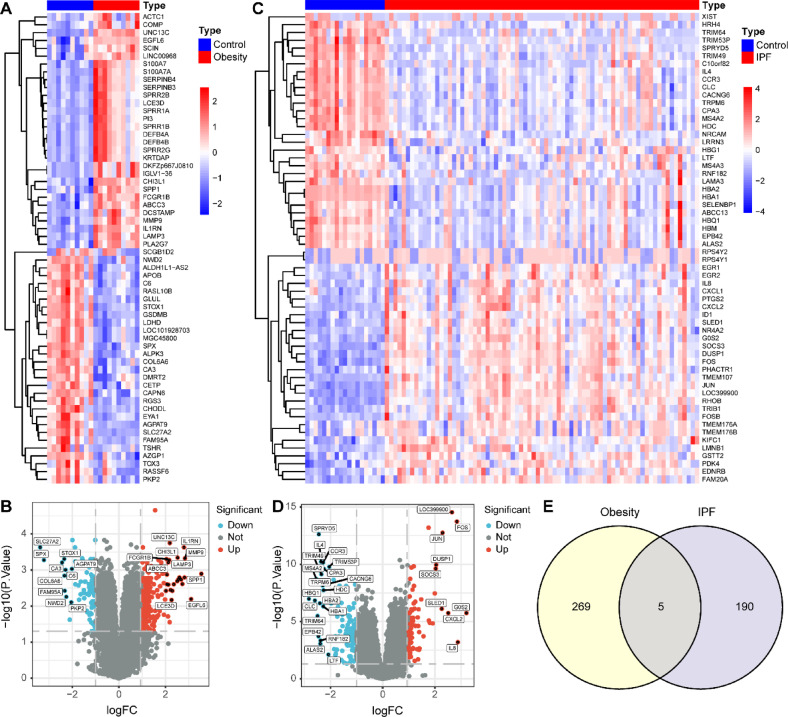
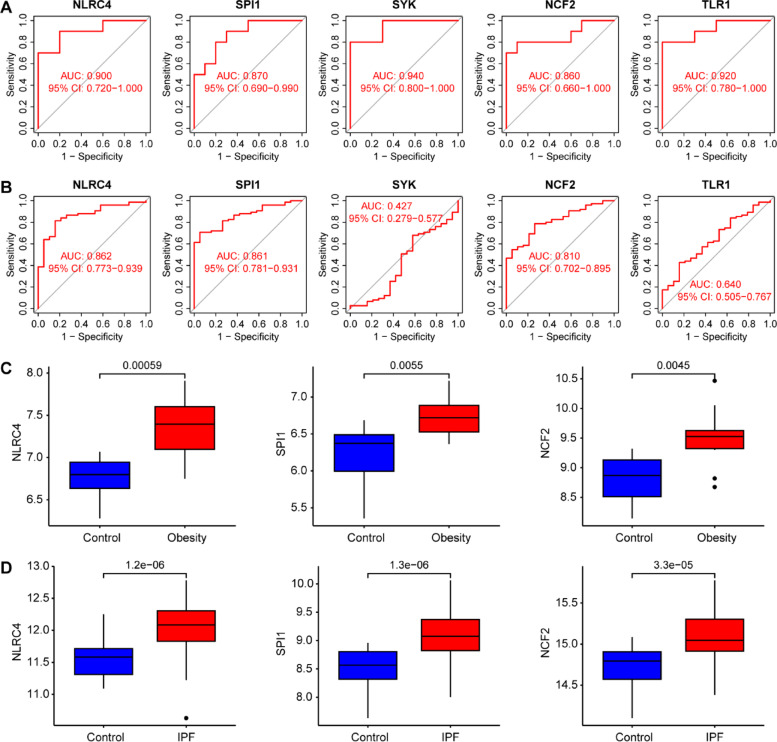
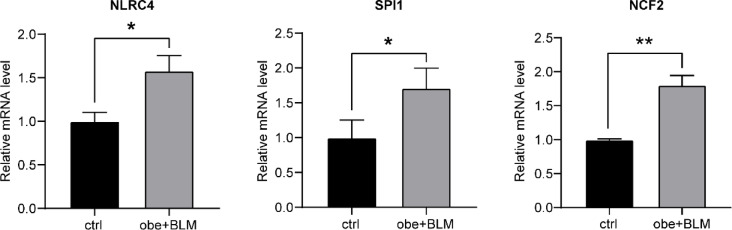
Previous studies have suggested a potential correlation between obesity and idiopathic pulmonary fibrosis (IPF). This study aimed to elucidate pathogenic pathways connecting obesity and IPF and identify diagnostic biomarkers for obesity-related pulmonary fibrosis. Obesity and IPF datasets were obtained through the Gene Expression Omnibus (GEO) database. Differential expression analysis and weighted gene co-expression network analysis (WGCNA) were used to identify shared genes for obesity and IPF. Functional enrichment (GO/KEGG), protein-protein interaction (PPI) networks, and machine learning algorithms were applied to screen hub genes, validated by ROC curves. High-fat diet (HFD)-induced obese mice with bleomycin-induced pulmonary fibrosis underwent histological assessment and qRT-PCR validation. Molecular docking evaluated flavonoid binding to hub genes. We identified 128 shared genes between obesity and IPF, predominantly enriched in immune and inflammatory pathways. Machine learning prioritized three hub genes (NLRC4, SPI1, and NCF2), validated by ROC analysis (AUC > 0.7). In animal model, these genes exhibited significant upregulation, correlating with exacerbated fibrosis. Molecular docking highlighted strong binding affinities (-6.3 to -9.6 kcal/mol) between dietary flavonoids and hub targets. Immune-inflammatory dysregulation links obesity and IPF via NLRC4, SPI1, and NCF2. These genes serve as diagnostic biomarkers and therapeutic targets, with flavonoids showing intervention potential. Our findings advance mechanistic insights into obesity-related pulmonary fibrosis.
Keywords: Bioinformatic analysis; Flavonoids; Idiopathic pulmonary fibrosis; Machine learning; Obesity.
© 2025. The Author(s).
Conflict of interest statement
Declarations. Competing interests: The authors declare no competing interests. Ethics approval and consent to participate: The data used in this paper are publicly available, ethically approved.
Figures


Similar articles
-
Molecular mechanisms of efferocytosis imbalance in the idiopathic pulmonary fibrosis microenvironment: from gene screening to dynamic regulation analysis.Biol Direct. 2025 Jul 15;20(1):83. doi: 10.1186/s13062-025-00658-3. Biol Direct. 2025. PMID: 40665394 Free PMC article.
-
Exploring ABHD5 as a Lipid-Related Biomarker in Idiopathic Pulmonary Fibrosis: Integrating Machine Learning, Bioinformatics, and In Vitro Experiments.Inflammation. 2025 Jun;48(3):1176-1192. doi: 10.1007/s10753-024-02107-1. Epub 2024 Jul 24. Inflammation. 2025. PMID: 39046603
-
Cellular senescence-related gene signatures in idiopathic pulmonary fibrosis: insights from bioinformatics.Front Immunol. 2025 Jun 10;16:1557848. doi: 10.3389/fimmu.2025.1557848. eCollection 2025. Front Immunol. 2025. PMID: 40557159 Free PMC article.
-
Identification of core genes in the extracellular matrix and the regulatory mechanisms of the immune microenvironment in idiopathic pulmonary fibrosis using WGCNA and machine learning methods.PLoS One. 2025 Aug 26;20(8):e0330725. doi: 10.1371/journal.pone.0330725. eCollection 2025. PLoS One. 2025. PMID: 40857336 Free PMC article.
-
Machine learning identifies lipid-associated genes and constructs diagnostic and prognostic models for idiopathic pulmonary fibrosis.Orphanet J Rare Dis. 2025 Jul 10;20(1):354. doi: 10.1186/s13023-025-03876-0. Orphanet J Rare Dis. 2025. PMID: 40640934 Free PMC article.
References
-
- Moss, B. J., Ryter, S. W. & Rosas, I. O. Pathogenic mechanisms underlying idiopathic pulmonary fibrosis. Annu. Rev. Pathol.17, 515–546 (2022). - PubMed
-
- King, T. E. et al. A phase 3 trial of Pirfenidone in patients with idiopathic pulmonary fibrosis. N Engl. J. Med.370, 2083–2092 (2014). - PubMed
-
- Blüher, M. Obesity: global epidemiology and pathogenesis. Nat. Rev. Endocrinol.15, 288–298 (2019). - PubMed
MeSH terms
Grants and funding
LinkOut - more resources
Full Text Sources
Medical
