. 2025 Oct;133(6):795-808.
doi: 10.1038/s41416-025-03088-0. Epub 2025 Jul 16.

Single-cell spatial analysis with Xenium reveals anti-tumour responses of CXCL13 + T and CXCL9+ cells after radiotherapy combined with anti-PD-L1 therapy

Affiliations

Single-cell spatial analysis with Xenium reveals anti-tumour responses of CXCL13 + T and CXCL9+ cells after radiotherapy combined with anti-PD-L1 therapy

Shunsuke A Sakai et al. Br J Cancer. 2025 Oct.

Abstract

Background: The standard treatment for unresectable non-small cell lung cancer (NSCLC) is anti-PD-L1 therapy combined with chemoradiotherapy (anti-PD-L1-CRT). Although some patients achieve complete cancer eradication and cure, more than half of patients retain persistent cancer cells. Our research aimed to unravel the nuanced mechanisms involved in both immune attack and evasion induced by anti-PD-L1-CRT with single cell spatial transcriptome.

Methods: Xenium is a cutting-edge single-cell spatial analysis tool that enables pathology-based and single-cell analyses while preserving spatial information. In our study, we used Xenium to identify the tumour microenvironment (TME), immune dynamics, and residual cancer cells at the single-cell level following treatment with anti-PD-L1-CRT.

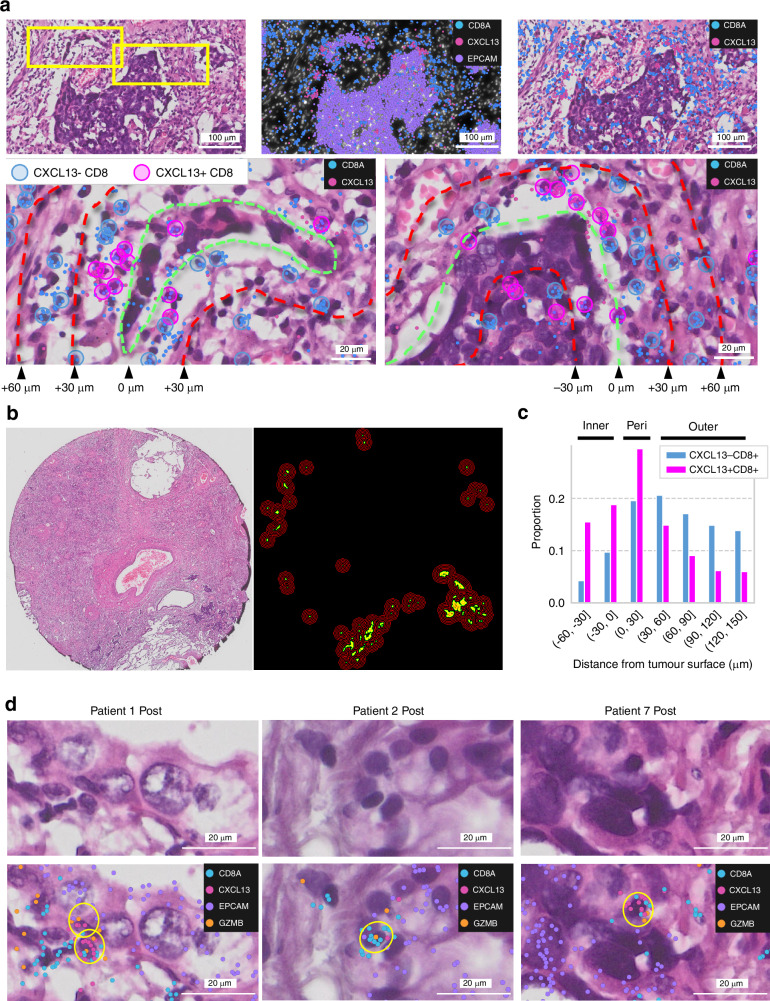
Results: Posttreatment alterations included a significant increase in CXCL9+ cells and CXCL13 + T cells, particularly around tumour cells. Additionally, we discovered that CXCL13 + T cells directly impact cancer cells in the posttreatment environment. Moreover, we identified clusters of immune-cold cancer cells posttreatment, revealing their activation of DNA repair pathways and high proliferative capacity. The novel spatial analysis tool Xenium enabled identification of the immune environment at the single-cell level following treatment with anti-PD-L1-CRT, elucidating its characteristics.

Conclusions: These findings suggest potential advancements in developing new treatments to improve posttreatment immune responses and address resistance challenges.


Conflict of interest statement

Competing interests: M.N. reports personal fees from AstraZeneca and a research grant from illumina, outside the submitted work. T.K. received research grant from Roche Diagnostics K.K. outside of this work. M.T. has received honorarium and lecture fees from Johnson & Johnson Japan, AstraZeneca KK, Eli Lilly Japan, Chugai Pharmaceutical CO., LTD, Taiho Pharma, Medtronic Japan, Ono Pharmaceutical CO., LTD, MSD, Bristol-Myers Squibb KK, Novartis, Amgen KK, and Daiichi-Sankyo. Additionally, M.T. has been involved in consulting or advisory roles with AstraZeneca KK, Chugai Pharmaceutical CO., LTD, MSD, and Novartis, and has received research grants and engaged in commissioned research (e.g., clinical trials) from Boehringer-Ingelheim Japan, MSD, AstraZeneca KK, Ono Pharmaceutical CO., LTD, MSD, Bristol-Myers Squibb KK, Novartis, Eli Lilly Japan, and MiRXES. T.M. has received honorarium and lecture fees from AstraZeneca KK, Chugai Pharmaceutical CO., LTD, Ono Pharmaceutical CO., LTD, and Bristol-Myers Squibb KK, MSD, Boehringer Ingelheim, Taiho, Eli-Lilly, Novartis, Amgen, Takeda, Kyorin and receieved research grant from AstraZeneca, Chugai, Boeringer Ingelheim, Pfizer, Taiho, MSD, Ono, Bridge Biopharma and Natera. A.H. has received honorarium and lecture fees from AstraZeneca KK, Chugai Pharmaceutical CO., LTD, Ono Pharmaceutical CO., LTD, and Bristol-Myers Squibb KK. Additionally, A.H. has been involved in consulting or advisory roles with AstraZeneca KK and has received research grants and engaged in commissioned research (e.g., clinical trials) from AstraZeneca KK. J.S. received honorarium and lecture fees from Johnson & Johnson Japan, Chugai Pharmaceutical CO., LTD, Taiho Pharma, Medtronic Japan, and Intuitive Japan. Ethics approval and consent to participate: Ethical approval was obtained from the ethics committee of National Cancer Center Japan (Protocol Number: 2022-407). The study was conducted in accordance with the principles of the Declaration of Helsinki.

Figures

Fig. 1
Fig. 1. Evaluation of tissues and Xenium analysis after treatment with anti-PD-L1 combined with chemoradiotherapy.
a Characteristics of the tissue samples used in this study. The cell number indicates the number of cells that can be analysed with Xenium. Posttreatment histology revealed stable disease (SD), major pathological response (MPR), and complete response (CR). b Representative HE staining image of pre- and posttreatment tumours. Cancer cells were delineated via HE staining (yellow line). c, d Representative images of HE staining, cell clustering and gene expression. After each cell line was distinguished and utilizing 302 gene expression patterns, pretreatment cells were categorized into 11 clusters, and posttreatment cells were classified into 22 clusters. Each cluster was classified as epithelial (KRT5 + , CDH1 + ), CAF (COL1A1 + ), myeloid (CD68 + , CD163 + ), LYM (lymphocyte, CD3E + , CD4 + , CD8 + ), plasma (POU2AF1 + ), or U.C. (dead cells or unclassified cells).
Fig. 2
Fig. 2. Characterization of gene expression profiles of cells in tissue samples obtained following combined treatment with anti-PD-L1 antibodies and chemoradiotherapy.
a Workflow of the analysis in this study. b, c The number of cells in the total field analysed before (Patients 1, 2, and 7) and after (Patients 1, 3, 7 and 8) surgery. Positivity was defined as ≥2 or above. In all pre-post comparisons, a statistically significant difference was observed (P < 0.05, Student’s t-test). d The number of white blood cells (WBCs) and lymphocytes in the plasma. Pre: plasma within 2 weeks before treatment; Post: plasma within 2 weeks after resection. e Bar plot illustrating differences in the density of mRNA expression per cell area between pretreatment (Patient 1: 1029 cells, Patient 3: 1248 cells, and Patient 7: 340 cells) and posttreatment (Patient 1: 1502 cells, Patient 2: 1059 cells, and Patient 7: 1049). The x-axis indicates the effect size (Cohen’s d), and the y-axis indicates each gene with significant changes in expression (Welch’s t test, P < 0.05). f Confirmation of gene expression through Xenium Explorer. g Heatmap with dendrogram illustrating differences in the density of gene expression between manually delineated intertumoural, ≤20 μm, ≤70 μm, and ≤120 μm regions. The x-axis indicates each delineated region, and the y-axis indicates 302 genes in the Xenium I lung panel. h Merged images of gene expression and HE staining.
Fig. 3
Fig. 3. Single-cell spatial transcriptome analysis revealed characteristics of CXCL9+ and CXCL13+ cells that accumulated among cancer cells after anti-PD-L1 combination therapy.
a Treatment, tissue, genotype, response, and number of cells expressing CXCL9, CXCL13, CD274, CTLA4, ICOS, IDO1, LAG3, CXCL5, and CXCL14. b Peripheral tumour gene expression of CXCL13 and CXCL9 in Patient 7. Posts 1-4 show residual cancer cells, and post 5 shows only accumulated lymphocytes. c CXCL13 and CXCL9 expression in Patient 7 pre, Patient 8 post, and Patient 11 posttissue. d Bubble chart with a colour scale showing the expression level and proportion of cell marker genes and ICI target genes in CXCL13+ and CXCL9+ cells using in situ Xenium data for Patient 7. The x-axis indicates the cells, the y-axis indicates each marker gene, the colour scale indicates the z score of the mean number of positive cells for each marker gene, and the circle size indicates the proportion of positive cells for each marker gene. e CXCL13 + CD8 + T cells coexpressing exhaustion marker genes on tumour cells. f CD8 + T cells coexpressing exhaustion marker genes on tumour cells. f CD68− and CD163+ myeloid cells coexpressing CXCL9.
Fig. 4
Fig. 4. CXCL13 + CD8 + T cells accumulate in posttreatment cancer tissue and directly act on cancer cells.
a Localization of CXCL13 − CD8 + T cells and CXCL13 + CD8 + T cells in Patient 7. The regions enclosed by the yellow rectangle in the upper row are shown in the lower row. The green dashed lines are the tumour surface, and the yellow dashed lines are the contour lines at 30 µm intervals. b Image shows the tumour surfaces (green) and contours (red) at 30 µm intervals (−60 to 150 μm) in two areas in Patient 7. c Bar plot shows the proportions of CXCL13 + CD8 + T cells and CXCL13 − CD8 + T cells in each region. d CXCL13 + CD8 + T cells expressing GZMB were near or inside the tumour in Patients 1, 2, and 7.
Fig. 5
Fig. 5. CXCL13 + CD8 + T cells accumulate via the CXCL16CXCR6 axis and trigger the IFNG pathway.
a Bubble chart with a colour scale showing the average expression level and proportion of genes associated with receptors in CXCL13 − CD8 + , CXCL13 + CD8 + , CXCL9 − CD68 + , CXCL9 + CD68+ and CXCL9 − CD68+ cells according to gene expression data for Patient 7. The x-axis indicates the cell type, the y-axis indicates the marker gene, the colour scale indicates the z score of the mean number of positive cells for each marker gene, and the circle size indicates the proportion of positive cells for each marker gene for each type of cell. b, c Bubble chart of genes associated with humoral immunity and regulators in CXCL13 − CD8 + , CXCL13 + CD8 + , CXCL9- CD68 + , CXCL9 + CD68 + , CXCL9 − CD68 + , CD274 − EPCAM + , and CD274 + EPCAM+ cells. d CXCL13 + CD8 + T cells coexpress IFNG, and CXCL9 and CXCL10 expression is found near these cells. e Heatmaps indicating spatial enrichment of the IFN-mediated signalling pathway (log-adjusted P value) and expression levels of CXCL13, CXCL9, and CXCL10 (normalized count). The values below the heatmaps are the Pearson correlation coefficients between expression levels and enrichment of IFN-mediated signalling pathways. f Models of cell‒cell interactions in the tumour environment.
Fig. 6
Fig. 6. Characterization of immunologically hot and cold cancer cells after anti-PD-L1 combined with chemoradiotherapy.
a Image of HE staining of mixed hot and cold tumours. b, c Violin plot of genes whose expression significantly differed (p < 0.05; Welch’s t test) between hot and cold tumours in Patient 7. The y-axis shows the density of gene expression per cell area (μm2). Genes are shown separately based on their categorization as hot, cold, or ICI-targetable genes. d Confirmation of gene expression through Xenium Explorer.

References

    1. Galluzzi L, Buqué A, Kepp O, Zitvogel L, Kroemer G. Immunogenic cell death in cancer and infectious disease. Nat Rev Immunol. 2017;17:97–111. - PubMed
    1. Reits EA, Hodge JW, Herberts CA, Groothuis TA, Chakraborty M, Wansley EK, et al. Radiation modulates the peptide repertoire, enhances MHC class I expression, and induces successful antitumor immunotherapy. J Exp Med. 2006;203:1259–71. - PMC - PubMed
    1. Bando H, Tsukada Y, Ito M, Yoshino T. Novel immunological approaches in the treatment of locally advanced rectal cancer. Clin Colorectal Cancer. 2022;21:3–9. - PubMed
    1. Zhu X, Cao Y, Liu W, Ju X, Zhao X, Jiang L, et al. Stereotactic body radiotherapy plus pembrolizumab and trametinib versus stereotactic body radiotherapy plus gemcitabine for locally recurrent pancreatic cancer after surgical resection: an open-label, randomised, controlled, phase 2 trial. Lancet Oncol. 2021;22:1093–102. - PubMed
    1. Weiss J, Sheth S, Deal AM, Grilley Olson JE, Patel S, Hackman TG, et al. Concurrent definitive immunoradiotherapy for patients with stage III-IV head and neck cancer and cisplatin contraindication. Clin Cancer Res. 2020;26:4260–7. - PMC - PubMed

MeSH terms

LinkOut - more resources