. 2025 Aug;28(8):1622-1634.
doi: 10.1038/s41593-025-01992-5. Epub 2025 Jul 16.

Evidence for trans-synaptic propagation of oligomeric tau in human progressive supranuclear palsy

Affiliations

Evidence for trans-synaptic propagation of oligomeric tau in human progressive supranuclear palsy

Robert I McGeachan et al. Nat Neurosci. 2025 Aug.

Abstract

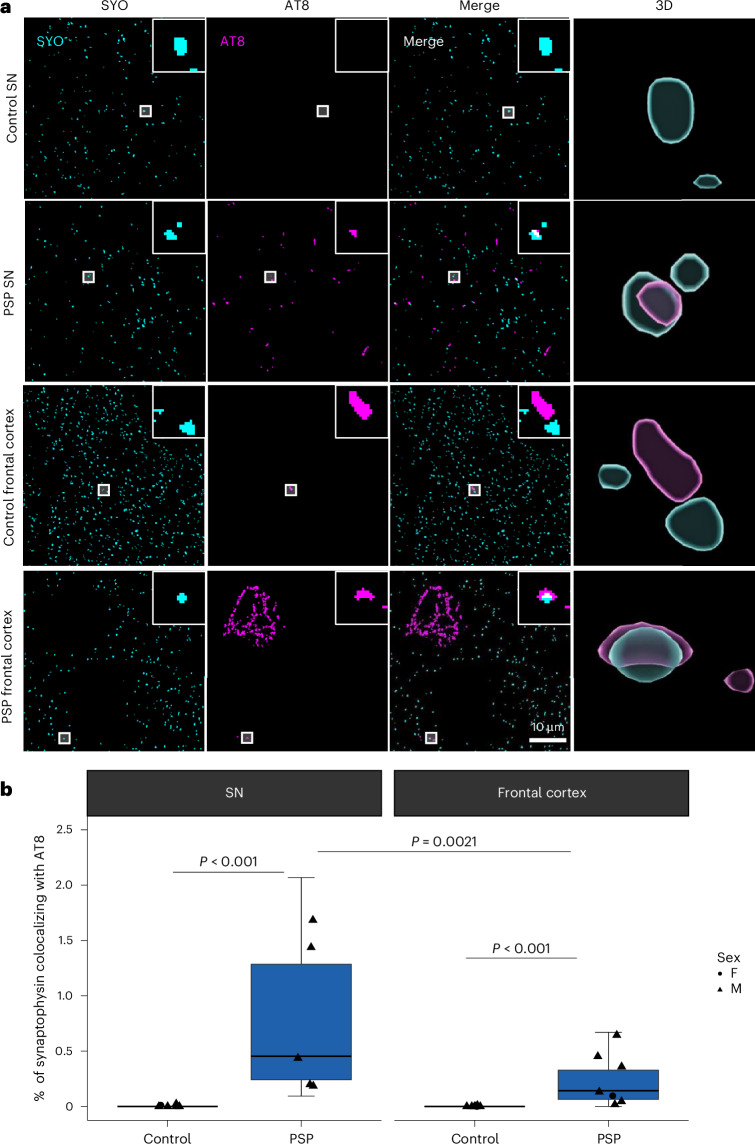
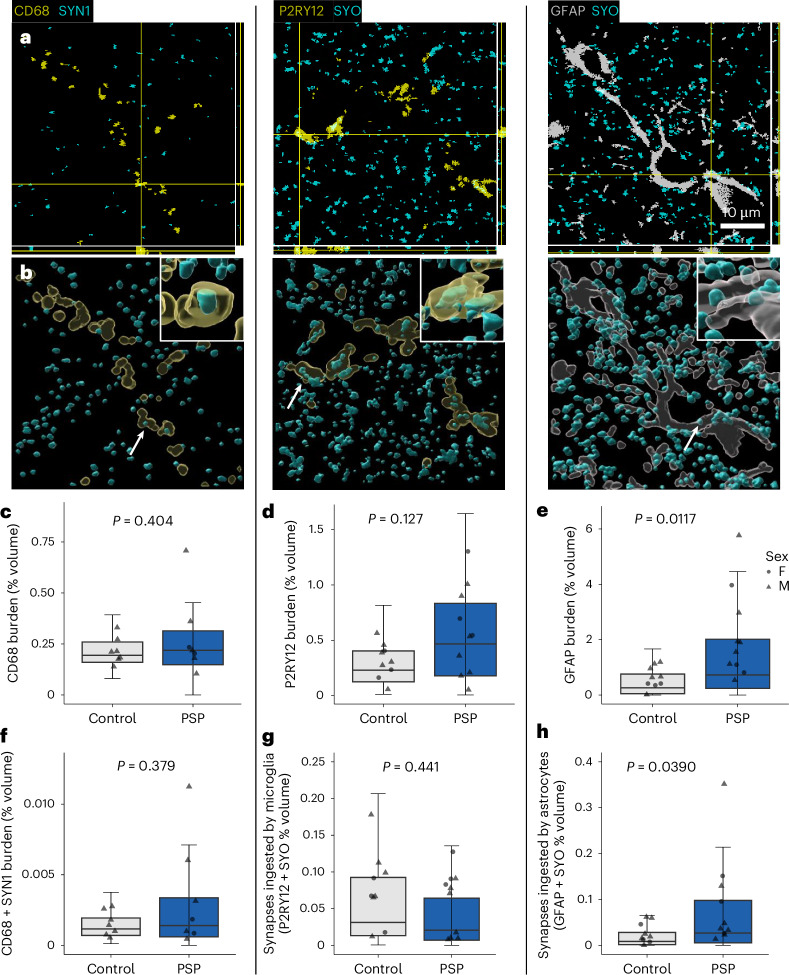
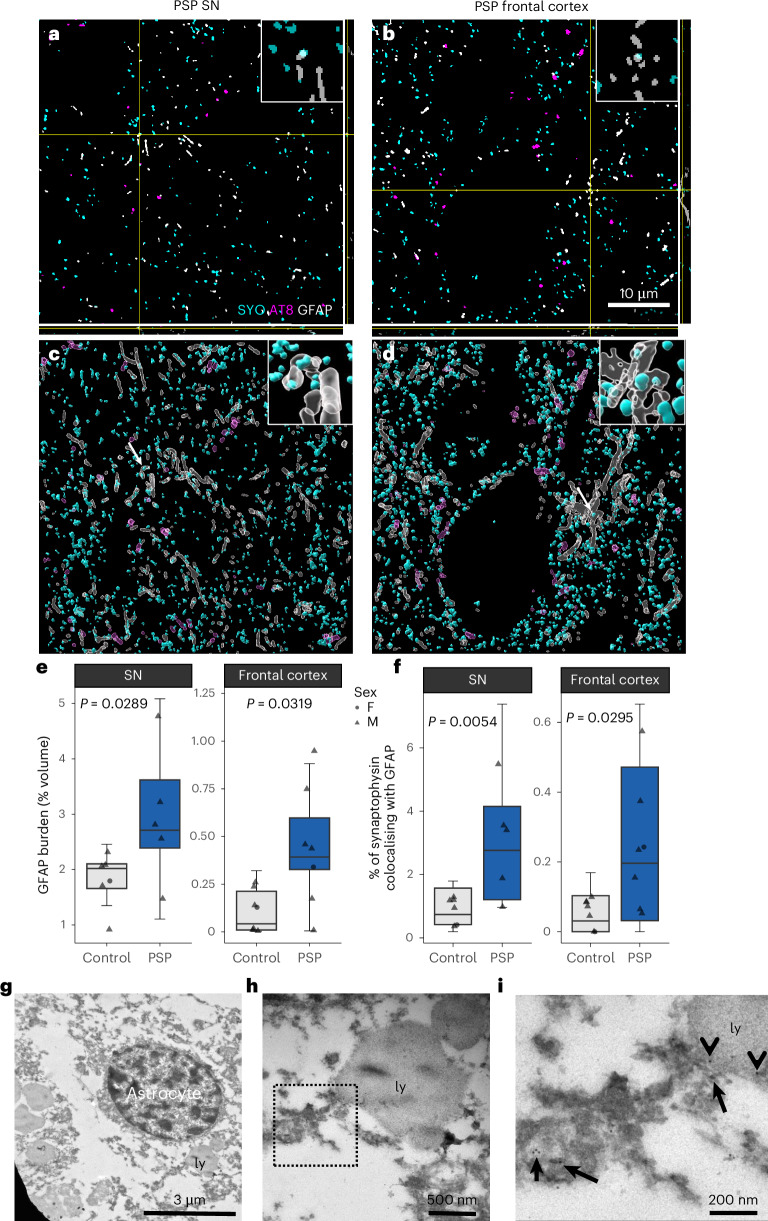
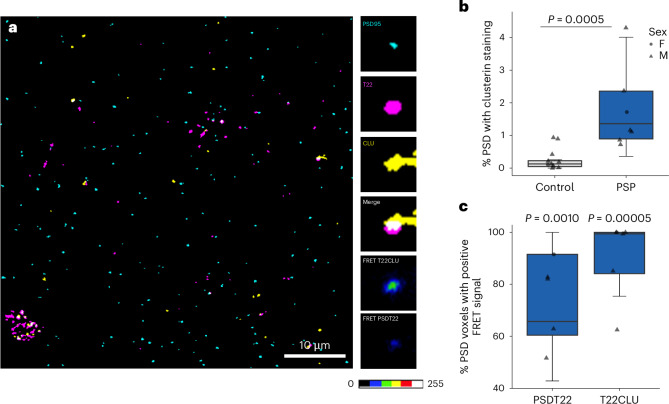
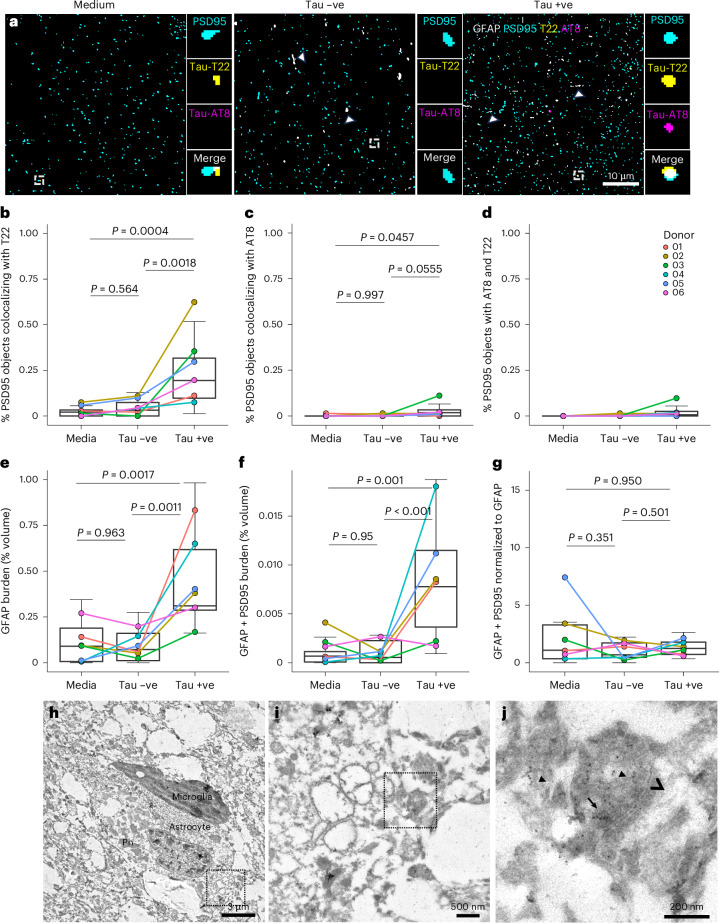
In the neurodegenerative disease progressive supranuclear palsy (PSP), tau pathology progresses through the brain in a stereotypical spatiotemporal pattern, and where tau pathology appears, synapses are lost. We tested the hypothesis that pathological tau contributes to synapse loss and may spread through the brain by moving from presynapses to postsynapses. Using postmortem PSP brain samples and a living human brain slice culture model, we observe pathological tau in synaptic pairs and evidence that oligomeric tau can enter live human postsynapses. Proteomics revealed increased clusterin in synapses in PSP, and super-resolution imaging showed clusterin colocalized with tau in synapses in close enough proximity to be binding partners, which may mediate tau spread. Accumulation of tau in synapses correlated with synapse loss, and synaptic engulfment by astrocytes was observed, suggesting that astrocytes contribute to synapse loss. Together, these data indicate that targeting synaptic tau is a promising approach to treat PSP.


Conflict of interest statement

Competing interests: T.L.S.-J. is a scientific advisory board member of Scottish Brain Sciences, Cognition Therapeutics and Race Against Dementia, and has received consulting fees or honoraria from Jay Therapeutics, Sanofi, AbbVie, Merck and Eisai. M.T. is an employee of Scottish Brain Sciences. The other authors declare no competing interests.

Figures

Fig. 1
Fig. 1. Phospho-tau accumulates within presynaptic terminals in PSP.
a, Array tomography ribbons were immunostained for SYO (cyan) and phospho-tau Thr202, Ser205 (AT8, magenta). Single 70 nm segmented sections show representative staining in the SN and frontal cortex of control and PSP brains. Insets highlight colocalization between SYO and AT8. 3D reconstructions made using IMARIS. Scale bar = 10 μm. Large boxes = 50 μm × 50 μm. Insets = 2 μm × 2 μm. b, Quantification of colocalization shows an increase in the percentage of SYO puncta colocalizing with AT8 in PSP brain (n = 5 donors SN, 7 frontal cortex) compared to control (n = 6 SN, 7 frontal cortex). Within PSP brain, there are more SYO objects colocalizing with AT8 in the SN compared to the frontal cortex. Boxplots show the first quartile to third quartile (box) with the median marked, and whiskers show maximum and minimum values calculated from each image stack, excluding outliers (two image stacks per region per case were taken as technical replicates). Data points show case means (biological replicates). Data were Tukey transformed and analyzed with LMEM (~diagnosis × brain region + 1 | case, ANOVA after LMEM effect of disease F(1,11.58) = 74.587, P < 0.0001) with post hoc pairwise Tukey-corrected P values showing significant effect of disease in both SN (estimate = 0.760, 95% CI (0.561, 0.959), t(23.8) = 7.887, P < 0.0001) and frontal cortex (estimate = 0.557, 95% CI (0.377, 0.738), t(19.5) = 5.918, P < 0.0001). Within PSP cases, the proportion of AT8-positive synapses is higher in the SN than the frontal cortex (estimate = 0.242, 95% CI (0.0932, 0.390), t(25.3) = 3.293, P = 0.0021). F, female; M, male.
Fig. 2
Fig. 2. Indirect evidence for trans-synaptic spread and synaptotoxicity of oligomeric tau.
ad, A single 70 nm segmented section of PSP frontal cortex, immunostained for presynapses (SYO, cyan), postsynapses (PSD95, yellow) and oligomeric tau (T22, magenta). Scale bar = 10 µm. Oligomeric tau is seen in presynapses (b), postsynapses (c) and in both the presynapse and postsynapse of a synaptic pair (d). Boxes = 2 µm × 2 µm, 3D reconstructions made using IMARIS. ej, Boxplots show the first quartile to third quartile (box) with the median marked, and whiskers show maximum and minimum values excluding outliers calculated from each image stack (two to three image stacks per case were taken as technical replicates). Data points show case means (n = 6 control, 7 PSP biological replicates). Data were Tukey transformed and analyzed with LMEMs (variable ~ diagnosis + 1 | case), and Tukey-corrected post hoc comparisons were performed. Quantification shows that in PSP frontal cortex there is an increase in the percentage of presynapses (e, estimate = 0.429, 95% CI (0.234, 0.624), t(10.7) = 4.85, P = 0.0005), postsynapses (f, estimate = 0.606, 95% CI (0.332, 0.88), t(10.6) = 4.89, P = 0.0005) and synaptic pairs colocalizing with oligomeric tau (g, estimate = 0.3, 95% CI (0.077, 0.522), t(8.9) = 3.052, P = 0.0139). The percentage of presynapses (h) and postsynapses (i) with oligomeric tau negatively correlates with the density of presynapses and postsynapses, respectively (Pearson correlations pre—t(27) = −2.348, 95% CI (−0.6763, −0.0533); post—t(27) = −2.857, 95% CI (−0.7210, −0.1400)). Postsynapses that are paired to a presynapse with oligomeric tau are around 86 times more likely to colocalize with oligomeric tau than all paired postsynapses, regardless of whether the adjacent presynapse also colocalizes with tau (j, estimate = 27.7, 95% CI (6.54, 48.8), t(11.8) = 2.856, P = 0.0146). Values shown in the schematic in j are means per group. Schematic created with biorender.com. k, Validation of oligomeric tau in synapses by immunogold electron microscopy. In postmortem PSP frontal cortex, anti-oligomeric tau (T22) immunogold staining is positive within the cytoplasm (arrow), presynaptic vesicles (arrowhead), oligomer-like structures in postsynapses (asterisk) and at the synaptic cleft (dotted arrow). Scale bar = 200 nm.
Fig. 3
Fig. 3. Increased synaptic engulfment by astrocytes but not microglia in PSP frontal cortex.
a, Confocal microscopy of PSP frontal cortex stained with GFAP to label astrocytes (gray); CD68 or P2RY12 to label microglia (yellow); SYN1 or SYO (cyan) to label synapses. Orthogonal views are shown to demonstrate colocalization between synaptic protein and glia. Boxes = 50 μm × 50 μm. Scale bar = 10 μm. b, Three-dimensional reconstructions of image stacks. Insets show close-ups of the colocalizations highlighted by the arrow, which have been rotated along the z axis, to further demonstrate that synaptic protein is within glia. Three-dimensional reconstructions made in IMARIS. Large boxes = 50 μm × 50 μm, insets = 5 μm × 5 μm. ch, Quantitative analysis using linear mixed effects modeling on Tukey transformed data (variable ~ diagnosis + 1 | case) and post hoc Tukey-corrected pairwise comparisons reveals that there is no difference in the burden (percentage of volume of image stack occupied by staining) of CD68 (c, n = 7 PSP, 7 control cases with ten image stacks per case as technical replicates, estimate = 0.069, 95% CI (−0.1, 0.243), t(12) = 0.865, P = 0.404) or P2RY12 (d, n = 10 PSP, 9 control cases with ten image stacks per case as technical replicates, estimate = 0.131, 95% CI (−0.0411, 0.303), t(17) = 1.607, P = 0.127) in PSP frontal cortex when compared to control. Furthermore, there is no difference in the amount of colocalization between CD68 and SYN1 (f, n = 7 PSP, 7 control cases with ten image stacks per case as technical replicates, estimate = 0.0248, 95% CI (−0.0344, 0.084), t(12) = 0.913, P = 0.379) and P2RY12 and SYO (g, n = 10 PSP, 9 control cases with ten image stacks per case as technical replicates, estimate = 0.036, 95% CI (−0.133, 0.06), t(16.9) = 0.789, P = 0.441). There is an increase in GFAP burden (e, n = 10 PSP, 9 control cases with ten image stacks per case as technical replicates, estimate = 0.186, 95% CI (0.047, 0.325), t(16.8) = 2.826, P = 0.0117) and colocalization between GFAP and SYO (h, estimate = 0.127, 95% CI (0.00719, 0.247), t(16.9) = 2.238, P = 0.0390) in PSP frontal cortex when compared to control. Boxes show quartiles and medians calculated from each image stack. Whiskers show minima and maxima of stack values without outliers. Data points show case means.
Fig. 4
Fig. 4. Increased synaptic engulfment by astrocytes in PSP SN and frontal cortex demonstrated using array tomography and immunogold electron microscopy.
ad, A single 70 nm segmented array tomography section with orthogonal views of the image stack (a,b), and 3D reconstructions (c,d) of PSP SN (a,c) and frontal cortex (b,d) immunostained for presynapses (SYO, cyan), tau (AT8, magenta) and astrocytes (GFAP, gray). Arrows and insets show colocalization between synapses (SYO) and astrocytes (GFAP). Large boxes = 50 μm × 50 μm, scale bar = 10 μm. Small boxes = 5 μm × 5 μm. e,f, Array tomography image stacks were taken from PSP (n = 5 donors SN, 7 frontal cortex) and control (n = 6 SN, 7 frontal cortex). Two to three image stacks per region per case were taken as technical replicates. Boxplots show the first quartile to third quartile (box) with the median marked, and whiskers show maximum and minimum values calculated from each image stack, excluding outliers. Data points show case means (biological replicates). Data were analyzed with LMEMs (~diagnosis × brain region + 1 | case) with post hoc pairwise Tukey-corrected comparisons. Quantification reveals that in PSP SN and frontal cortex, there is astrogliosis (e, SN estimate = 0.334, 95% CI (0.039, 0.629), t(16.6) = 2.393, P = 0.0289; frontal cortex estimate = 0, 95% CI (0.0316, 0.601), t(14.1) = 2.382, P = 0.0319, square root transformed data LMEM ~ diagnosis × brain_region + 1 | case). Further in PSP, there is increased colocalization between presynapses (SYO) and astrocytes (GFAP; f, model run on Tukey transformed data, SN estimate = 0.360, 95% CI (0.116, 0.60), t(26.8) = 3.029, P = 0.0054, frontal cortex estimate = 0.243, 95% CI (0.026, 0.459), t(23.2) = 2.320, P = 0.0295). gi, Immunogold electron microscopy of human postmortem PSP frontal cortex with anti-SYO antibody labeled with 10 nm gold particles. Astrocytes were identified by ultrastructure (g) and often included lysosomes (ly). A higher magnification image of the astrocytic cytoplasm in the human brain (h) shows phagocytosed debris, including membranous structures abutting lysosomes. Higher magnification image (i) shows synaptic vesicle-containing structures (arrows) labeled for SYO with 10 nm gold in the astrocytic cytoplasm and gold particles in the lysosome (arrowheads). Scale bars = 3 µm (g), 500 nm (h) and 200 nm (i).
Fig. 5
Fig. 5. Proteomics analysis identifies dysregulated synaptic proteins.
a,b, Volcano plots highlighting the results of proteomic analysis comparing synaptic enriched fractions from PSP and control SN (a) and frontal cortex (b). DEPs were defined as P < 0.05 and a 20% change in protein level. Downregulated proteins are shown in red. Upregulated proteins are shown in blue. Proteins that were not differentially expressed are highlighted in gray. SynGO analysis was conducted on the synaptic enriched fraction preparations from the SN (b,c) and frontal cortex (d,e). c,d, In the SN, there are very few upregulated proteins (c) and a substantial loss of presynaptic and postsynaptic proteins (d). e,f, In the frontal cortex, there are similar numbers of upregulated (e) and downregulated (f) proteins.
Fig. 6
Fig. 6. Oligomeric tau is close enough to clusterin to be a binding partner within postsynapses in PSP brain.
a, A single 70 nm segmented array tomography section of PSP frontal cortex immunostained for oligomeric tau (T22, magenta), clusterin (CLU, yellow) and postsynapses (PSD95, cyan). Scale bar = 10 μm. Insets show colocalization and positive FRET signal between clusterin and oligomeric tau and oligomeric tau and PSD95 within a postsynapse. Scale bar for FRET images indicates intensity (0–255 a.u.). b, As predicted from the proteomics results, colocalization of clusterin and PSD95 was higher in PSP than in control (PSP, n = 7 control and n = 10 cases, two to four image stacks per case as technical replicates, LMEM on Tukey transformed data ~ diagnosis + (1 | case), Tukey-corrected post hoc pairwise comparison estimate = 0.646, 95% CI (0.323, 0.956), t(12.2) = 4.743, P = 0.0005). c, In PSP frontal cortex, PSD95 and T22 generate a FRET signal significantly different from 0 (one-sample t-test on means per case with μ = 0, t = 10.12, df = 4, Bonferroni-corrected P = 0.0010). Similarly, within postsynapses positive for both T22 and clusterin, these proteins generate a FRET signal (t(5) = 14.644, Bonferroni-corrected P = 0.00005), indicating these proteins are likely interacting within synapses. Boxes show the first quartile, median and third quartile of the stack data. Whiskers show minima and maxima without outliers. Data points show case means (females, circles; males, triangles).
Fig. 7
Fig. 7. PSP-derived tau induces astrogliosis, synaptic engulfment and colocalizes with postsynapses in living human brain slices.
a, Human brain slices were cultured for 72 h in either medium only, Tau −ve soluble PSP brain extract or Tau +ve extract. Slices were processed for array tomography and immunostained for postsynapses (PSD95, cyan), oligomeric tau (T22, yellow), phospho-tau Ser202, Thr205 (AT8, magenta) and astrocytes (GFAP, gray). Representative single 70 nm segmented sections are shown. Scale bar = 10 μm. Large boxes = 50 μm × 50 μm. Small boxes = 2 μm × 2 μm. Arrowheads show GFAP-positive astrocyte processes. Array tomography image stacks were taken from six human brain tissue donors (biological replicates), each treated with three conditions including two stacks (technical replicates) per condition, and Tukey-transformed data were analyzed using LMEMs (~treatment + 1|donor) followed by Tukey-corrected pairwise post hoc tests. bg, Quantification of colocalization shows that incubating in Tau +ve PSP extract causes an increase in the percentage of PSD95 puncta with oligomeric tau (b), compared to either slices cultured in medium (estimate = 0.5146, 95% CI (0.28, 075), t(9.56) = 6.07, P = 0.0004) or compared to Tau −ve PSP brain extract (estimate = 0.423, 95% CI (0.19, 0.66), t(9.56) = 4.91, P = 0.0018). There is a trend toward an increase with AT8 accumulation when incubated with the Tau +ve PSP extract (c), compared to slices cultured in medium alone (estimate = 0.138, 95% CI (0.003, 0.273), t(13.4) = 2.68, P = 0.0457) or compared to Tau −ve PSP extract (estimate = 0.133, 95% CI (0.003, 0.270), t(13.4) = 2.57, P = 0.0555). There was no difference in the percentage of PSD95 puncta containing both AT8 and T22 (d) when cultured with the Tau +ve PSP extract. Slices cultured with the Tau +ve extract show an increase in the percentage volume of the 3D image stack occupied by GFAP (e) compared to medium alone (estimate = 0.35, 95% CI (0.14, 0.56), t(13) = 4.48, P = 0.0017) or compared to tau-immunodepleted PSP extract treatment (estimate = 0.37, 95% CI (0.16, 0.58), t(13) = 4.69, P = 0.0011) and an increase in the colocalization of GFAP with PSD95 (f) compared to medium alone (estimate = 0.114, 95% CI (0.05, 0.18), t(12) = 4.75, P = 0.001) and compared to Tau −ve PSP extract (estimate = 0.122, 95% CI (0.06, 0.19), t(12) = 5.00, P < 0.001). However, when the colocalization between PSD95 and GFAP is normalized to the GFAP burden, there is no difference between groups (g). Boxplots show quartiles and medians calculated from each image stack; whiskers show minima and maxima without outliers. Data points refer to donor case means. hj, Immunogold electron microscopy of HBSC exposed to Tau +ve PSP extract, immunolabeled with anti-SYO antibody labeled with 10 nm gold particles. Astrocytes were identified by ultrastructure (h) and often included phagocytosed material (Ph). Higher magnification images (i,j) show SYO labeled with gold particles (arrows) opposed to a postsynaptic density (arrowhead) within the astrocyte cytoplasm. Scale bars = 3 µm (h), 500 nm (i) and 200 nm (j).
Extended Data Fig. 1
Extended Data Fig. 1. Increased phospho-tau Ser202, Thr205 in PSP substantia nigra and frontal cortex and validation of synaptic staining.
a, Representative images of cases with high and low tau burdens of formalin-fixed, paraffin-embedded slides from PSP and control frontal cortex and substantia nigra immunolabeled for phospho-tau Ser202, Thr205 with the AT8 antibody. Large box scale bar = 500 µm, Small box scale bar = 50 µm. Red arrows highlight tau/DAB staining. Black arrows highlight artifact or pigments that is not real tau/DAB staining. b, Quantification of AT8 staining identifies an increase in phospho-tau Ser202, Thr205 in PSP substantia nigra and frontal cortex compared to age and sex matched controls. Boxes show quartiles and medians calculated from each image; whiskers show maxima and minima excluding outliers. Data points show case means (females, circles; males, triangles, n = 9 PSP, 9 control cases frontal cortex, n = 10 control, 11 PSP cases substantia nigra, one slide per case per region imaged). Data were analyzed with linear mixed effects models (tau_burden ~ diagnosis × brain_region + 1 | case). P values were calculated from post hoc testing with Tukey correction for multiple comparisons. AT8 tau burden is higher in PSP substantia nigra (estimate = 0.642, 95% CI (0.36,0.924), t(32.1) = 4.638, p = 0.0001) and in frontal cortex (estimate = 0.806, 95% CI (0.506,1.107), t(33.7) = 5.453, p < 0.0001). c,d, Validation with immunogold electron microscopy that synaptophysin antibody labels presynaptic vesicles (10 nm gold-conjugated to secondary antibody indicated with arrows), which are opposed to electron dense post-synaptic densities (arrowheads) in both postmortem PSP brain tissue (c) and human brain slices (d). Scale bar = 200 nm.
Extended Data Fig. 2
Extended Data Fig. 2. Synaptic tau colocalises with synaptogyrin-3 in PSP frontal cortex.
a,b, Segmented array tomography images. Array tomography ribbons were stained for synaptophysin (cyan), synaptogyrin-3 (magenta) and tau (yellow). Representative images of maximum intensity z-projections of 5 serial sections are shown for a control (a) and a PSP case (b). The top row of each panel contains a 50 × 50 μm region of interest with a 10 μm scale bar, and the bottom rows contain a zoomed-in 10 × 10 μm region of interest with a 2 μm scale bar. The far-right column shows three-dimensional reconstructions of 5 serial sections. An arrow indicates a synapse containing tau in the PSP case. cf, Quantification of segmented array tomography images reveals increases in the percentage of synaptogyrin-3 puncta containing tau (c, ANOVA after linear mixed effects model on Tukey transformed data ~ diagnosis + (1 | case/block) estimate = 0.279, 95% CI (0.004, 0.553), t(11.68) = 2.25, p = 0.044), synaptophysin puncta containing tau (d, estimate = 0.206, 95% CI (0.000037, 0.413), F(11.1) = 5.0167, p = 0.047) and increased tau burden (e, estimate = 0.427, 95% CI (0.251, 0.603), F(17.1) = 32.789, p < 0.0001). Tau burden positively correlates with the percentage of synaptogyrin-3 puncta containing tau in PSP but not control cases (f). Boxes show quartiles and medians calculated from each image stack, and whiskers show minima and maxima excluding outliers (n = 7 control, 7 PSP cases, 1–2 blocks per case, 2–3 stacks per block, group comparison statistics with linear mixed effects model). Correlations with Pearson’s correlation test. Data points refer to case means (females, circles; males, triangles).
Extended Data Fig. 3
Extended Data Fig. 3. Evidence for the trans-synaptic spread of phospho-tau 202/205, augmented post-synaptic engulfment by astrocytes in PSP frontal cortex and electron microscopy validation of microglial ingestion by synapses.
ac, A 3D reconstruction of PSP frontal cortex, immunostained for pre-synapses (synaptophysin, cyan), post-synapses (PSD95, yellow), tau (AT8, magenta) and astrocytes (GFAP, gray; a). Tau (AT8) is seen to accumulate in synaptic pairs (b) and pre-synapses and post-synapses are seen within GFAP-positive astrocyte processes (c). 3D reconstructions in a and far-right panels of b and c were made using IMARIS. dh, Quantification shows that in PSP frontal cortex there is an increase in the percentage of pre-synapse (d, ANOVA after linear mixed effects model on Tukey transformed data ~ cohort + age + 1 | case, estimate = 0.519, 95% CI (0.305, 0.734), F(11) = 17.559, p < 0.0001), post-synapses (e, estimate = 0.565, 95% CI (0.268, 0.861), F(11) = 28.441, p = 0.002) and synaptic pairs (f, estimate = 0.32, 95% CI (0.137, 0.502), F(11) = 14.7803, p = 0.003) colocalizing with tau (AT8). Post-synapses that are paired to a pre-synapses with tau (AT8) are 67.1 times more likely to colocalize with tau (AT8) than all paired post-synapses, regardless of whether the adjacent pre-synapse also colocalizes with tau (g, estimate = 0.787, 95% CI (0.076, 1.5), F(21.649) = 39.885, p < 0.0001). There is also an increased colocalization between post-synapses (PSD95) and astrocytes (GFAP; h, estimate = 29.9, 95% CI (14.2, 45.6), F(11) = 5.939, p = 0.033). Boxes show quartiles and medians calculated from each image stack; whiskers show minima and maxima excluding outliers. Quantifications are from n = 7 PSP, 7 control cases with 2 image stacks per case as technical replicates. Data points show case means (biological replicates—females, circles; males, triangles). Schematic created with biorender.com. ik, Immunoelectron microscopy was used to confirm synaptic ingestion by microglia. Microglia were identified by ultrastructure, including dark nuclei (nuc). Higher power images of the microglial cytoplasm (j,k) show mitochondria (m) and cytoplasmic structures. Higher magnification images of synaptophysin labeled with 10 nm gold particles arrows in (k, inset shown in j) show synaptic vesicle-containing structures in the microglial cytoplasm. Scale bars = 3 μm in i, 500 nm in j and 200 nm in k.
Extended Data Fig. 4
Extended Data Fig. 4. Validation of enrichment of synaptic proteins in synaptic enriched fraction preparations.
ac, Western blot analysis reveals enriched synaptic proteins (synaptophysin and PSD95) and decreased nuclear protein (histone H3) in synaptic enriched fraction preparations. Membrane was probed with REVERT total protein stain (a), synaptophysin (SYO; b) and PSD95, histones H3 and GAPDH (c). SP, synaptic preparation; TH, total homogenate. d, Electron microscopy of synaptic preparations shows exclusion of cell bodies and enrichment of synapses. Scale bar left image = 1 μm; scale bar right image = 0.5 μm. e, Gene Ontology enrichment analysis using the R package ‘clusterProfiler’, setting = ‘cellular compartment’, was performed on DEPs between total homogenate and synaptic preparations and revealed an enrichment of synaptic proteins (e).
Extended Data Fig. 5
Extended Data Fig. 5. Differentially expressed proteins in total homogenates of PSP substantia nigra and frontal cortex.
a,b, Volcano plots highlighting the results of proteomic analysis comparing PSP and control substantia nigra total homogenate (a) and frontal cortex total homogenate (b). Differentially expressed proteins (DEPs) were defined as p value < 0.05 and a 20% change in protein level. Downregulated proteins are shown in red. Upregulated proteins are shown in blue. Proteins that were not differentially expressed are highlighted in gray. TH, total homogenate. c, Gene Ontology enrichment analysis using the R package ‘clusterProfiler’ (setting: ‘biological processes’) was performed on DEPs, highlighting that synaptic, metabolic and inflammatory pathways are altered in PSP. P value adjusted using Benjamini–Hochberg correction for multiple comparisons.
Extended Data Fig. 6
Extended Data Fig. 6. Characterization of oligomeric tau by electron microscopy.
a, Recombinant tau oligomers negatively stained with uranyl acetate and lead citrate form globular structures. b, Tau +ve PSP brain extract used for slice culture experiments was incubated on Formvar/carbon-coated nickel electron microscope grids, and T22 was used for immunogold labeling of oligomeric tau. This shows similar globular structures to recombinant tau oligomers and no fibrils, as expected for this soluble brain extract. Arrows indicate 10 nm gold particles labeling oligomers. Scale bar for a and b = 200 nm, insets = 150 × 150 nm. c, Overview of ultrastructure of postmortem PSP brain stained with T22 immunogold. Scale bar = 5 μm. d, Higher magnification image of PSP post-mortem brain stained with T22 immunogold showing that in addition to synaptic oligomeric tau shown in the main figures, we also observe globular oligomeric structures labeled with T22. Arrow indicates a globular oligomer labeled with 10 nm gold particles. Scale bar = 500 nm, inset = 500 × 500 nm. e, Imaging of a blood vessel lumen and red blood cell. f, Imaging of blank areas of the grid with only Formvar/nickel coating acts as a negative control for immunogold staining. Scale bars for e and f = 200 nm.
Extended Data Fig. 7
Extended Data Fig. 7. Alternative analyses assessing differences in density of synaptic colocalization.
Array tomography data presented in the main figures as the percentage of synapses containing tau are shown here as the density of tau-containing synapses, showing that on the order of 106 synapses per mm3 contain tau in both post-mortem brain and living human brain slice cultures challenged with PSP-derived tau. Synpatophysin-AT8 post-mortem data are from (n = 5 donors substantia nigra, 7 frontal cortex) compared to control (n = 6 substantia nigra, 7 frontal cortex). Two image stacks per region per case were taken as technical replicates. Density of AT8-positive synaptophysin puncta is significantly higher in PSP (ANOVA after linear mixed effects model on Tukey transformed data, F(10.7) = 22.864, p = 0.0006). Post hoc tests show increases in AT8-positive synaptophysin density in both substantia nigra (estimate = 47.3, 95% CI (27.93, 66.6), t(21.1) = 5.081, p < 0.0001) and frontal cortex (estimate = 27.3, 95% CI (9.33, 45.2), t(17) = 3.208, p = 0.005). Quantifications of synaptogyrin and T22 data are from the frontal cortex of n = 7 PSP, 7 control cases with 2 image stacks per case as technical replicates analyzed with a linear mixed effects model of Tukey-transformed data ~ diagnosis + 1 | case with post hoc Tukey-corrected tests. There is an increase in PSP in the density of synaptophsin objects colocalized with T22 (estimate = 70.2, 95% CI (37.7, 103), t(10.7) = 4.771, p = 0.0006), PSD95 puncta with T22 (estimate = 143, 95% CI (80.5, 206), t(10.6) = 5.047, p = 0.0004) and density of synaptic pairs with T22 in both pre and post (estimate = 3.84 × 10−7, 95% CI (9.44 × 10−9, 7.59 × 10−7), t(10.3) = 2.276, p = 0.043). Human slice cultures are from n = 6 human brain tissue donors, each treated with three conditions including two stacks (technical replicates) per condition. There is a significant effect of treatment on the density of objects consistent with T22 (ANOVA after linear mixed effects model on Tukey transformed data ~ treatment + 1 | donor, F(31.017) = 16.974, p < 0.00001) and AT8 (F(14.328) = 5.8542, p = 0.0247). Boxes show quartiles and medians calculated from each image stack; whiskers show minima and maxima excluding outliers. Data points show case means (biological replicates).

References

    1. Steele, J. C., Richardson, J. C. & Olszewski, J. Progressive supranuclear palsy: a heterogeneous degeneration involving the brain stem, basal ganglia and cerebellum with vertical gaze and pseudobulbar palsy, nuchal dystonia and dementia. Arch. Neurol.10, 333–359 (1964). - PubMed
    1. Kovacs, G. G. et al. Distribution patterns of tau pathology in progressive supranuclear palsy. Acta Neuropathol.140, 99–119 (2020). - PMC - PubMed
    1. Bigio, E. H. et al. Cortical synapse loss in progressive supranuclear palsy. J. Neuropathol. Exp. Neurol.60, 403–410 (2001). - PubMed
    1. Holland, N. et al. Synaptic loss in primary tauopathies revealed by [11C]UCB-J positron emission tomography. Mov. Disord.35, 1834–1842 (2020). - PMC - PubMed
    1. Kent, S. A., Spires-Jones, T. L. & Durrant, C. S. The physiological roles of tau and Aβ: implications for Alzheimer’s disease pathology and therapeutics. Acta Neuropathol.140, 417–447 (2020). - PMC - PubMed