. 2025 Aug;644(8078):1078-1087.
doi: 10.1038/s41586-025-09240-3. Epub 2025 Jul 16.

Ongoing genome doubling shapes evolvability and immunity in ovarian cancer

Andrew McPherson #  1   2 Ignacio Vázquez-García #  3   4   5   6   7 Matthew A Myers #  3   4 Duaa H Al-Rawi #  3   4   8 Matthew Zatzman #  3   4 Adam C Weiner  3   4   9 Samuel Freeman  3   4 Neeman Mohibullah  10 Gryte Satas  3   4 Marc J Williams  3   4 Nicholas Ceglia  3   4 Danguolė Norkūnaitė  3   4 Allen W Zhang  11 Jun Li  12   13 Jamie L P Lim  3 Michelle Wu  3   4 Seongmin Choi  3   4 Eliyahu Havasov  3   4 Diljot Grewal  3   4 Hongyu Shi  3 Minsoo Kim  3   4   9 Roland F Schwarz  14   15 Tom Kaufmann  15   16 Khanh Ngoc Dinh  5   17 Florian Uhlitz  3   4 Julie Tran  3   4 Yushi Wu  10 Ruchi Patel  10 Satish Ramakrishnan  10 DooA Kim  10 Justin Clarke  10 Hunter Green  18 Emily Ali  3   4   18 Melody DiBona  12   13 Nancy Varice  19 Ritika Kundra  20 Vance Broach  19 Ginger J Gardner  19 Kara Long Roche  19 Yukio Sonoda  19 Oliver Zivanovic  19   21 Sarah H Kim  19 Rachel N Grisham  8   22 Ying L Liu  8   22 Agnes Viale  20 Nicole Rusk  3   4 Yulia Lakhman  22   23 Lora H Ellenson  18 Simon Tavaré  5 Samuel Aparicio  24 Dennis S Chi  19 Carol Aghajanian  8 Nadeem R Abu-Rustum  19   25 Claire F Friedman  8   22 Dmitriy Zamarin  8   26 Britta Weigelt  18 Samuel F Bakhoum  12   13 Sohrab P Shah  27   28
Affiliations

Ongoing genome doubling shapes evolvability and immunity in ovarian cancer

Andrew McPherson et al. Nature. 2025 Aug.

Abstract

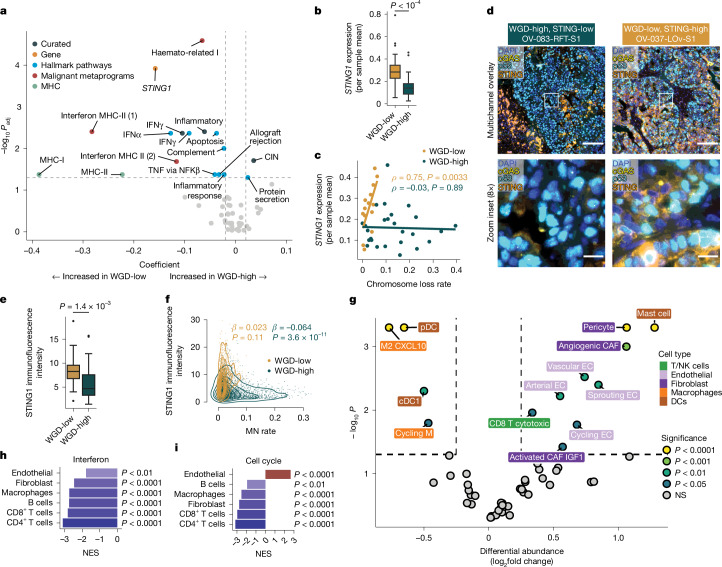
Whole-genome doubling (WGD) is a common feature of human cancers and is linked to tumour progression, drug resistance, and metastasis1-6. Here we examine the impact of WGD on somatic evolution and immune evasion at single-cell resolution in patient tumours. Using single-cell whole-genome sequencing, we analysed 70 high-grade serous ovarian cancer samples from 41 patients (30,260 tumour genomes) and observed near-ubiquitous evidence that WGD is an ongoing mutational process. WGD was associated with increased cell-cell diversity and higher rates of chromosomal missegregation and consequent micronucleation. We developed a mutation-based WGD timing method called doubleTime to delineate specific modes by which WGD can drive tumour evolution, including early fixation followed by considerable diversification, multiple parallel WGD events on a pre-existing background of copy-number diversity, and evolutionarily late WGD in small clones and individual cells. Furthermore, using matched single-cell RNA sequencing and high-resolution immunofluorescence microscopy, we found that inflammatory signalling and cGAS-STING pathway activation result from ongoing chromosomal instability, but this is restricted to predominantly diploid tumours (WGD-low). By contrast, predominantly WGD tumours (WGD-high), despite increased missegregation, exhibited cell-cycle dysregulation, STING1 repression, and immunosuppressive phenotypic states. Together, these findings establish WGD as an ongoing mutational process that promotes evolvability and dysregulated immunity in high-grade serous ovarian cancer.


Conflict of interest statement

Competing interests: B.W. reports grant funding by Repare Therapeutics paid to the institution, outside the scope of this paper, and employment of a direct family member at AstraZeneca. C.A. reports grants from Clovis, Genentech, AbbVie and AstraZeneca, and personal fees from Tesaro, Eisai/Merck, Mersana Therapeutics, Roche/Genentech, Abbvie, AstraZeneca/Merck and Repare Therapeutics, outside the scope of this paper. C.A. also reports clinical-trial funding to the institution from Abbvie, AstraZeneca and Genentech/Roche; participation on a data safety monitoring board or advisory board at AstraZeneca and Merck; unpaid membership of the GOG Foundation board of directors and the NRG Oncology board of directors. C.F.F. reports research funding to the institution from Merck, AstraZeneca, Genentech/Roche, Bristol Myers Squibb and Daiichi; uncompensated membership of a scientific advisory board for Merck and Genentech; and is a consultant for OncLive, Aptitude Health, Bristol Myers Squibb and Seagen, all outside the scope of this paper. D.S.C. reports membership of the medical advisory board of Verthermia Acquio and Biom’up, is a paid speaker for AstraZeneca and holds stock of Doximity, Moderna and BioNTech. D.Z. reports institutional grants from Merck, Genentech, AstraZeneca, Plexxikon and Synthekine, and personal fees from AstraZeneca, Xencor, Memgen, Takeda, Astellas, Immunos, Tessa Therapeutics, Miltenyi and Calidi Biotherapeutics. D.Z. holds a patent on the use of oncolytic Newcastle disease virus for cancer therapy. N.R.A.-R. reports grants to the institution from Stryker/Novadaq and GRAIL, outside the scope of this paper. R.N.G. reports funding from GSK, Novartis, Mateon Therapeutics, Corcept, Regeneron, Clovis, Context Therapeutics, EMD Serono, MCM Education, OncLive, Aptitude Health and Prime Oncology, outside the scope of this paper. S.F.B. owns equity in, receives compensation from and serves as a consultant and on the scientific advisory board and board of directors of Volastra Therapeutics. He also serves on the scientific advisory board of Meliora Therapeutics. S.P.S. reports research funding from AstraZeneca and Bristol Myers Squibb, outside the scope of this paper. Y.L.L. reports research funding from AstraZeneca, GSK/Tesaro, Artios Pharma and Tesaro Therapeutics, outside the scope of this paper. Y.L. reports serving as a consultant for Calyx Clinical Trial Solutions, outside the scope of this paper. All the remaining authors declare no competing interests.

Figures

Fig. 1
Fig. 1. WGD is a dynamic mutational process.
a, Overview of the MSK SPECTRUM cohort and specimen collection workflow, including numbers of patients, sites and samples processed by various means. H&E, haematoxylin and eosin; IF, immunofluorescence. b, Study design for analysing cellular ploidy and WGD in single cells using scWGS with the DLP+ protocol. The plot shows the classification of WGD multiplicity in cancer cells (0, 1 or 2 WGDs) using the fraction of the genome with major copy number (CN) ≥ 2 versus the mean allele CN difference; n = 30,260 cells. BAF, B-allele frequency; TCN, total copy number. c, Top, age at diagnosis, mutation signature, BRCA1/BRCA2 mutation status, and WGD class. Middle, distribution of cell ploidy of individual cells for each tumour, coloured by the number of WGDs. Bottom, percentage of WGDs, number of cells per patient, and fraction of cells in the minority WGD multiplicity state. Bottom right, illustrations of cell classifications. d, Heatmaps of total copy number (left) and allelic imbalance (right) for patient OV-045, with predicted WGD multiplicity and site of resection for each cell annotated. The 1×WGD population was downsampled from 1,857 to 200 cells for visualization, and the full 0×WGD and 2×WGD populations, numbering 18 and 44 cells, respectively, are shown. A-Hom, homozygous for haplotype A; A-gained, allelic imbalance with more copies of haplotype A (analogous for haplotype B); Balanced, equal copies of the two haplotypes.
Fig. 2
Fig. 2. Evolutionary timing of WGD events from SNVs.
a, Schematic of the approach for timing WGDs in SNV clones (Methods). cnLOH, copy-neutral loss of heterozygosity. b, Clone phylogenies and WGD timing for 18 patients (see Extended Data Fig. 4a for another 21 patients). Branch length shows the number of age-associated SNVs (C-to-T at CpG sites) assigned to each branch, adjusted for coverage-depth-related reduction in SNV sensitivity. Expanded WGD events are shown as triangles at the predicted location along WGD branches, coloured by relative timing. Branches are coloured by WGD multiplicity. Bar plots show, for each leaf, the fraction of cells in each WGD multiplicity and the fraction of cells from each anatomical site. OV-045 and OV-075 (starred) each harboured 0×WGD cells not captured in the doubleTime clone tree. The x axis is labelled with the SBMClone clone indices for each leaf. c, Variant allele frequency (VAF) of SNVs in two-copy LOH regions showing support for parallel versus shared WGD for patients OV-045 (left) and OV-025 (right). Each axis shows a different pair of clones, and each SNV is coloured according to its most likely variant copy numbers in the respective clones. SNVs that are assigned variant copy numbers 0/0 (absent from both clones) or 2/1 or 1/2 (inconsistent with the simple CNLOH WGD model) have been omitted. d, Histogram and rug plot showing the sensitivity-adjusted age-associated SNV count for WGD and diagnosis events for WGD-low (top, n = 14 patients) and WGD-high (bottom, n = 25 patients) tumours. Left, diagram showing the two time periods being measured by SNV counts. MRCA, most recent common ancestor. e, Fraction of additional-WGD cells in each clone plotted against the log binomial P value for the test that a clone has a greater fraction of additional-WGD cells than the average additional-WGD fraction across the cohort. Patients with P < 0.01 (dotted line) are annotated.
Fig. 3
Fig. 3. Impact of WGD on rates of chromosomal instability at single-cell resolution.
a, Nearest-neighbour distance in each WGD population, where distance is calculated as the fraction of the genome with a different CN. The centre line shows the median, box boundaries show quartiles, and whiskers indicate 1.5 × the interquartile range (IQR). b, QQ plot of the beta distribution fit versus empirical quantiles of NND values for all cells, including divergent cells (greater than the 99th percentile of the beta distribution). c, CN profile of an example divergent cell from OV-004 (top) compared with the pseudobulk CN of all cells for OV-004 (bottom). Each point is a 500-kb bin coloured by assigned CN state, and y axes show normalized read counts. Shaded regions indicate CN differences. d, Fraction of divergent cells. Boxplots are defined as in a. e, Method for inferring cell-specific CN events in non-divergent cells. Chrom., chromosome. f, Ploidy-normalized event counts per cell split by WGD multiplicity and WGD-high versus WGD-low tumour status. Mann–Whitney one-sided U-test significance (FDR corrected) is annotated: *1.0 × 10−2 < P ≤ 5.0 × 10−2, **1.0 × 10−3 < P ≤ 1.0 × 10−2, ***1.0 × 10−4 < P ≤ 1.0 × 10−3, ****P ≤ 1.0 × 10−4. Only significant comparisons are shown. Boxplots are defined as in a. g, High-resolution whole-slide immunofluorescence imaging to detect micronuclei (MN) and primary nuclei (PN), and quantify micronuclei rates. Scale bars, 10 μm. h, Mean primary nuclei area. Significance was calculated using a GEE model with patients as groups, annotated as in f. Boxplots are defined as in a. i, Micronuclei rates per slide. Each point is a tumour region of interest (ROI). Bar plots show total number of cGAS+ micronuclei across tumour ROIs (top) and total number of primary nuclei across tumour ROIs (bottom). Small tumour ROIs (fewer than than 103 primary nuclei) have been excluded. Shaded boxplots indicate patients highlighted in Extended Data Fig. 5j. Boxplots are defined as in a. j, Micronuclei rate per slide. Significance was calculated using a GEE model with patients as groups, annotated as in f.
Fig. 4
Fig. 4. Modes of evolution post WGD.
a, Pre- and post-WGD events illustrated for the ancestral branch of patient OV-044. Top, CN profile of the inferred ancestral non-WGD clone. Bottom, CN profile of the WGD clone. The plots in between show the CN changes (positive indicating gains, negative indicating losses) inferred to be pre-WGD and post-WGD, as illustrated on the left. b, Counts of ancestral arm and chromosome events detected across the cohort for non-WGD ancestral branches of WGD-low tumours, and pre- and post-WGD branches for WGD-high tumours. Bars and 95% confidence intervals show the distribution of counts on the given type of branch. Mann–Whitney U-test significance (FDR corrected) is annotated as: *1.0 × 10−2 < P ≤ 5.0 × 10−2, **1.0 × 10−3 < P ≤ 1.0 × 10−2, ***1.0 × 10−4 < P ≤ 1.0 × 10−3, ****P ≤ 1.0 × 10−4. Only significant comparisons are shown. c, Bar plots show counts of arm and chromosome events occurring post-WGD for all high-confidence clonal and subclonal WGD events detected across the cohort, split by clonality of the WGD (cell fraction threshold, 0.99). Bars and 95% confidence intervals show the distribution of counts on the root branch of the given type of WGD. Each bar indicates a clone that is labelled below and annotated above with the number of WGD events ancestral to the clone, as well as its clonality. The bottom bar plots show the fraction of cells from each patient that the clone represents. d, Boxplots summarizing c, annotated with FDR-corrected significance (Mann–Whitney U-test) as in b. NS, not significant.
Fig. 5
Fig. 5. Tumour-cell phenotypes and microenvironment remodelling in the context of WGD.
a, Scatter plot depicting GEE regression coefficients versus Benjamini–Hochberg-adjusted P values for selected genes and pathways in WGD-high and WGD-low tumour cells. MHC, major histocompatibility complex. b, Per-sample mean gene expression of STING1 in WGD-high (n = 63) and WGD-low (n = 34) samples. Centre line shows the median, box boundaries show quartiles and whiskers indicate 1.5 × IQR. Significance calculated using two-sided Wilcoxon rank sum test is included. c, Scatter plot of STING1 gene expression versus rate (counts per cell) of chromosomal losses, split by WGD-low and WGD-high (colours). Lines indicate the result of a linear regression in either WGD-high or WGD-low tumours. Regression coefficients and significance results are shown separately for WGD-low and WGD-high tumours. d, Example immunofluorescence images of WGD-high and WGD-low tumour samples with varying STING1 expression. Top, multichannel overlay images of STING1, panCK, DAPI and cGAS intensity at high magnification (scale bars, 125 μm). Bottom, zoomed insets (locations indicated by white boxes in the top panels; scale bars, 15 μm). e, Boxplots showing distribution of per-sample mean STING1 immunofluorescence intensity over tumour cells for WGD-high and WGD-low samples. Box plots are defined as in b. Significance calculated using a GEE model is included. f, Scatter plot and density estimation of STING1 versus micronuclei rate for 1 mm × 1 mm tiles in tumour ROIs. Points, density contours and coefficients, and P values of a generalized linear model are coloured by WGD-high and WGD-low tumour status. g, Differential cell-type abundance testing results from Milo with permutation testing (Methods) for cell types in WGD-high versus WGD-low samples. h, Normalized enrichment scores (NES) in the interferon pathway for cell types in the tumour microenvironment. CAF, cancer-associated fibroblasts; cDC1, conventional type 1 DCs; DCs, dendritic cells; EC, endothelial cells; NK, natural killer; pDC, plasmacytoid DCs. i, NES in the cell-cycle pathway for cell types in the tumour microenvironment.
Extended Data Fig. 1
Extended Data Fig. 1. Study and cohort overview.
a. Schematic of the MSK SPECTRUM specimen collection workflow including primary debulking surgery or laparoscopic biopsy, single-cell suspensions for scWGS and scRNA-seq, and biobanking of snap-frozen and FFPE tissue samples. b. Cohort overview. Top panel: Oncoprint of selected somatic and germline mutations per patient and cohort-wide prevalence. Single nucleotide variants (SNVs), indels, and fusions shown are detected by targeted panel sequencing (MSK-IMPACT). Focal amplifications and deletions are detected by single-cell whole genome sequencing (scWGS). Patient data include WGD class, mutational signature subtype, patient age, staging following FIGO Ovarian Cancer Staging guidelines, and type of surgical procedure. Bottom panel: Sample and data inventory indicating number of co-registered multi-site datasets: single-cell whole genome sequencing, single-cell RNA sequencing, H&E whole-slide images, immunofluorescence, bulk WGS and bulk MSK-IMPACT.
Extended Data Fig. 2
Extended Data Fig. 2. Quality control of scWGS data and WGD inference.
a. Number of high-quality cells generated per patient, divided into and colored by anatomical site. b. Box plots of per-cell coverage depth per patient (n = 41 patients). Center line shows the median, box boundaries show quartiles, and whiskers indicate 1.5 × IQR. c. Fraction of cells called as tumor, non-tumor, doublet, and S-phase for each patient. d. Example doublet identified from an image taken during DLP+ sequencing (see Supplementary Note for additional examples). e. Frequency of gains (red, above the horizontal) and losses (blue, below the horizontal) among all single-cell genomes in the cohort, with known drivers genes annotated. f. Tumor ploidy (mean tumor copy number) inferred by FACETS in MSK IMPACT data (x-axis) compared to average ploidy (mean copy number per cell, averaged across cells) for each patient in the SPECTRUM cohort (y-axis). The dashed line denotes the linear regression fit, grey regions indicate 95% confidence intervals, and two-sided Spearman’s rank correlation coefficient and p-value are shown in the upper left. g. Tumor ploidy (mean tumor copy number) inferred by ReMixT in bulk WGS data (x-axis) compared to average ploidy (mean copy number per cell, averaged across cells) for each patient in the SPECTRUM cohort (y-axis). The dashed line denotes the linear regression fit, grey regions indicate 95% confidence intervals, and two-sided Spearman’s rank correlation coefficient and p-value are shown in the upper left. Two patients (OV-052 and OV-068) were omitted due to poor quality bulk WGS copy number. h. Shown for all quality-filtered cells in the cohort is the mean difference between major and minor copy number (y-axis) versus the fraction of the genome with major copy number ≥ 2 (x-axis), with cells colored by WGD multiplicity. The dashed line at 0.5 denotes the decision boundary for 0 vs 1 WGDs. i. Shown for all quality-filtered cells in the cohort is the mean difference between major and minor copy number (y-axis) versus the fraction of the genome with major copy number ≥ 3 (x-axis), with cells colored by WGD multiplicity. The dashed line at 0.5 denotes the decision boundary for 1 vs 2 WGDs. j. Mitochondrial DNA copy number (log10) for each scWGS cell grouped by WGD multiplicity for 0 × (n = 13,069), 1 × (n = 16,782), and 2×WGD (n = 409) cells. Each datapoint is a cell. Box plots are defined as per b. Mann-Whitney two-sided U test significance is annotated as ‘ns’: 5.0 × 10⁻² < p <= 1.0, ‘*’: 1.0 × 10⁻² < p <= 5.0 × 10⁻², ‘**’: 1.0 × 10⁻³ < p <= 1.0 × 10⁻², ‘***’: 1.0 × 10⁻⁴ < p <= 1.0 × 10⁻³, ‘****’: p <= 1.0 × 10⁻⁴. Both p-values < 10−22. k. Average fraction of overlapping reads for each scWGS cell, grouped by WGD multiplicity (same n cells as j). Box plots are defined as per b. Significance was calculated and annotated as per j. Both p-values < 10−51. l. Cell diameter measured from DLP+ images for each scWGS cell, split by WGD multiplicity (same n cells as j). Boxplots are defined as per b. Significance was calculated and annotated as per j. Both p-values < 10−26. m-o. Example 0×WGD, 1×WGD, and 2×WGD cells from patient OV-045. Each point is a 500 kb bin. Top track shows GC corrected read count scaled by the inferred ploidy and colored by total copy number state, and bottom track shows B-allele frequency colored by allelic imbalance. p. Distribution of the fraction of additional-WGD cells per patient. q. Age at diagnosis for patients in the SPECTRUM cohort split by WGD-high (n = 27) vs WGD-low (n = 14). Box plots are defined as per b. p-value was calculated using a Mann-Whitney U one-sided test. r. Age at diagnosis for patients in the PCAWG ovarian cohort split by WGD (n = 67) vs non-WGD (n = 42). Box plots are defined as per b. p-value was calculated using a Mann-Whitney U one-sided test. s. Fraction of WGD-high and WGD-low tumors in the SPECTRUM cohort for each mutational signature. t. Fraction non-WGD and WGD patients in the Ovarian Metacohort for each mutation signature.
Extended Data Fig. 3
Extended Data Fig. 3. Residual 0xWGD cells in WGD-high patients.
a-f. Total copy-number profiles for patient OV-045 pseudobulk and all non-divergent 0xWGD cells. Each point is a 500 kb bin colored by its assigned copy-number state, the y-axis shows scaled GC-corrected read depth, and the x-axis shows genomic position. The top track of each panel shows the pseudobulk profile for all filter-passing cells (note that average total copy number, i.e., ploidy, is close to 3N-4N indicating WGD), and each lower track shows a single cell. b. Total copy-number profiles for OV-051 pseudobulk and all non-divergent 0xWGD cells as defined in a. c. Total copy-number profiles for OV-075 pseudobulk and all non-divergent 0xWGD cells as defined in a. d. Total copy-number profiles for OV-087 pseudobulk and all non-divergent 0xWGD cells as defined in a. e. Total copy-number profiles for OV-107 pseudobulk and all non-divergent 0xWGD cells as defined in a. f. Total copy-number profiles for OV-110 pseudobulk and all non-divergent 0xWGD cells as defined in a.
Extended Data Fig. 4
Extended Data Fig. 4. WGD evolution, non-WGD subclones, and subclonal WGD.
a. Clone phylogenies and WGD timing for 21 additional patients in our cohort (18 patients are shown in Fig. 2b). Branch length shows the number of age-associated SNVs (C-to-T at CpG) assigned to each branch, adjusted for coverage-depth-related reduction in SNV sensitivity. Clone size as a fraction of the patient’s total sequenced cells is shown by the size of the triangle for each leaf. Expanded WGD events are represented as triangles at the predicted location along WGD branches, with the color of the triangle indicating relative timing (early vs late). Branches are colored according to the number of WGD at that point in each evolutionary history. Bar plots below each clone tree show, for each SBMClone-derived leaf, the fraction of cells in each WGD multiplicity and the fraction of cells from each anatomical site. Patients are grouped by WGD evolution class. The x-axis is labeled with the SBMClone clone indices for each leaf. b-c. SBMClone clones and 0×WGD subpopulations in patients OV-045 (A) and OV-075 (B). Shown for each patient is the total copy number (left) and allelic imbalance (middle) for each clone (y-axis). Barplots on the right show the fraction of cells from that clone found in each anatomic site (left) and the number of cells for each clone (right). d. SBMClone block density matrix for patient OV-025 showing the proportion of SNVs detected for each clone (y-axis) and SNV block (x-axis). The SBMClone cluster and WGD status of each cell are shown on the right. The mostly-2×WGD clone in patient OV-025 is distinguished by clone-specific SNVs (arrow). e. Copy number for chromosomes 7, 8, and 9 for cells in patient OV-006, separated into non-WGD cells (top), WGD cells (middle), and inferred post-WGD changes in WGD cells (bottom; gains are indicated in red and losses are indicated in blue). The cell order is the same for the middle and bottom plots. Arrows indicate shared post-WGD changes that represent a WGD subclone. f. Copy number for chromosomes 2 and 8 for cells in patient OV-031, shown as per e. g. Copy number for chromosomes 1, 4, 15 and X for cells in patient OV-139, shown as per e. h. Absolute (upper bar plot) and relative (lower bar plot) number of malignant scWGS cells by WGD multiplicity (color) and sample (x-axis). Samples are separated by patient and ordered by the proportion of cancer cells with at least 1 WGD. Bottom tracks indicate the anatomical site for each sample and the WGD class for each patient.
Extended Data Fig. 5
Extended Data Fig. 5. Single cell measurement of chromosomal instability.
a. Schematic of nearest neighbor difference (NND) using fraction of the genome different as a distance measure (left). Shown are two pairs of example nearest nearest neighbor cells and regions of the genome that are different for a 0×WGD cell (middle) and a 1×WGD cell (right). Each point is a 500 kb bin colored by the assigned copy-number state, and the y-axis shows ploidy-scaled GC-normalized read counts. b. Empirical distribution of NND for all cells, and beta distribution fit (red). c. NND (y-axis) by ploidy (x-axis) for cells from patient OV-081. Color indicates divergent status, and WGD multiplicity for non-divergent cells. d. Copy-number profiles for example 0×WGD (top), 1×WGD (middle) and divergent (bottom) cells from patient OV-081. Arrows highlight homozygously deleted regions. e. Arm nullisomy rates (counts per cell) for divergent and non-divergent cells in WGD-low and WGD-high tumors. Shown is the distribution of mean rates per population in each patient (only those populations with at least 10 cells are included): WGD-low non-divergent n = 14, WGD-low divergent n = 6, WGD-high non-divergent n = 20, WGD-high divergent n = 12 populations. Mann-Whitney U one-sided test significance is annotated as ‘ns’: 5.0 × 10⁻² < p <= 1.0, ‘*’: 1.0 × 10−2 < p <= 5.0 × 10⁻², ‘**’: 1.0 × 10⁻³ < p <= 1.0 × 10⁻², ‘***’: 1.0 × 10−4 < p <= 1.0 × 10−3, ‘****’: p <= 1.0 × 10⁻⁴. Center line shows the median, box boundaries show quartiles, and whiskers indicate 1.5×IQR. WGD-low p = 2.6 × 10⁻⁵, WGD-high p = 2.0 × 10⁻⁶. f. Boxplots comparing fraction of divergent cells between WGD multiplicity populations for WGD-low and WGD-high tumors (only those populations with over 20 cells are included): WGD-low 0xWGD n = 14, WGD-low 1xWGD n = 8, WGD-high 0xWGD n = 2, WGD-high 1xWGD n = 25, WGD-high 2xWGD n = 4 populations. Mann-Whitney U one-sided test significance is annotated as per e. Boxplots are defined as per e. WGD-low (0xWGD vs 1xWGD) p = 8.2 × 10⁻⁴, WGD-high (1xWGD vs 2xWGD) p = 8.4 × 10⁻⁵. g. Fraction of divergent cells (y-axis) by age of the WGD as measured by C > T CpG mutations gained since WGD (x-axis). Shown is the p-value of a two-sided Spearman correlation after removing the three patients with the oldest WGDs. Two-sided Spearman correlation retaining these outliers is ρ = −0.47 p = 0.019. Shaded region indicates 95% confidence interval. h. MEDICC2 phylogeny (left) total copy number (center) and inferred cell-specific copy number changes (right) for patient OV-110. i. Coefficients, 95% confidence intervals, and p-values for the WGD term of a GEE model of chromosome, arm and segment loss and gain rates (counts per cell, normalized for genome size) for n = 54 adnexa vs non-adnexa subpopulations from the 37 patients with event rate estimates. The GEE model includes patient age, WGD status (high vs low), mutation signature (FBI vs non-FBI) and site (Adnexa vs non-Adnexa). j. Example immunofluorescence images of WGD-high and WGD-low tumor samples with varying MN rates. Images are annotated with the slide-level MN rates, calculated as the median MN rate across all tumor ROI regions within the slide. Top panels: Multi-channel overlay images of DAPI, cGAS and panCK intensity at high magnification. Bottom panels: Segmentation masks for cGAS+ MN and PN, including examples of micronuclei with annotated area size in μm2. k. Ratio of losses to gains for chromosomes (left) and chromosome arms (right). Cell specific refers to changes on leaf branches of the MEDICC2 phylogeny which are split by WGD-low and WGD-high tumor type. Ancestral changes are split into non-WGD, pre-WGD, and post-WGD as defined for Fig. 4B. Each datapoint for the cell specific distributions is a ratio of losses to gains for a single patient. Each datapoint for non-WGD, pre-WGD, and post-WGD distributions is a ratio computed from the root branch of the MEDICC2 phylogeny for a patient, distinguishing pre- and post-WGD changes for WGD-high tumors and including all changes for WGD-low tumors. Error bars indicate 95% confidence interval. Patients OV-045 and OV-025 with multiple parallel WGD events were excluded from this analysis. Mann-Whitney one-sided multiple-hypothesis-corrected U test p < 1.3 × 10⁻³ for chromosome event ratios, p = 0.016 for WGD-low vs. non-WGD arm event ratios, and p < 7.1* × 10−3 for remaining arm comparisons. WGD-low n=non-WGD n = 14, WGD-high n = 27, and pre-WGD n=post-WGD n = 21. l. Number of post-WGD chromosome and arm gains and losses (x-axis) compared to the mutation time in C > T CpG counts (y-axis) measured since the WGD event. Spearman correlation coefficients and p-values are shown.
Extended Data Fig. 6
Extended Data Fig. 6. Cell cycle progression in the context of WGD.
a. Absolute and relative compositions of cell cycle fractions in CD45 sorted samples based on scRNA-seq. Samples are separated by patient, and ordered within each patient by proportion of S-phase cells out of all cancer cells. b. Coefficients (x-axis) of a Generalized Estimation Equation (GEE) fit to the difference in cancer cell cycle fractions between WGD-low and WGD-high samples, corrected for patient effects, age and tumor site and mutational signature subtype. Bars indicate 95% confidence intervals. * indicates p < 0.05. c. Scaled expression of phase-specific genes in WGD-high (left panel) vs WGD-low (middle panel) tumors as a function of cell cycle pseudotime. Right panel: Differences in scaled gene expression of phase-specific genes in WGD-high vs WGD-low tumors as a function of cell cycle pseudotime. d. Scatter plot of hallmark E2F module score (y-axis) by rate (counts per cell) of chromosomal losses (x-axis) split by WGD-low and WGD-high (color). Lines indicate the result of a linear regression within either WGD-high or WGD-low tumors. Regression coefficients and significance are shown separately for WGD-low and WGD-high tumors. Each point is a tumor sample. e. Scatter plot of the fraction of cancer cells in G1 (y-axis) by rate (counts per cell) of chromosomal losses (x-axis) split by WGD-low and WGD-high (color). Lines indicate the result of a linear regression within either WGD-high or WGD-low tumors. Regression coefficients and significance are shown separately for WGD-low and WGD-high tumors. Each point is a tumor sample.
Extended Data Fig. 7
Extended Data Fig. 7. Tumor cell phenotypes in the context of WGD and mutation signatures.
a. Scatter plot depicting regression coefficients (x-axis) and significance (y-axis) for selected genes and pathways in WGD-high vs WGD-low tumor cells in the HRD-Dup mutation signature subset. b. Violin plots of per-sample mean expression for select cancer-cell-intrinsic signaling pathways faceted by mutation signature subset and WGD status: FBI (WGD-low n = 3 samples, WGD-high n = 27 samples), HRD-Del (WGD-high n = 17 samples), and HRD-Dup (WGD-low n = 31 samples, WGD-high n = 16 samples). Dot indicates median and bars indicate quartiles. c. Dotplot of correlations between missegregation rates derived from scWGS (column) and cancer-cell-intrinsic pathways from scRNA-seq in site-matched samples (row). Spearman’s rho significance is annotated as ‘ns’: 5.0 × 10-2 <p <= 1, ‘*’: 1.0 × 10−2 < p <= 5.0 × 10−2, ‘**’: 1.0 × 10−3 < p <= 1.0 × 10−2, ‘***’: 1.0 × 10−4 < p <= 1.0 × 10−3, ‘****’: p <= 1.0 × 10−4.
Extended Data Fig. 8
Extended Data Fig. 8. Transcriptional consequences of WGD in RPE-1 and FNE1 cell lines.
a. Clone copy number inferred from scWGS DLP+ (top), scATAC-seq (middle), and scRNA-seq (bottom) for RPE-1 cells across treatment conditions. Two clones were identified in all modalities: one WGD and one non-WGD. b. Clone copy number inferred from scWGS DLP+ (top) and scRNA-seq (bottom) for FNE1 cells. Two clones were identified in both modalities: one WGD and one non-WGD. c. Expression UMAP from scRNA-seq of FNE1 and RPE-1 mixed-WGD samples with cells colored by assignment to the WGD and non-WGD clones. d. Chromosome and arm loss and gain events per cell for RPE-1 and FNE1 cells split by WGD status (upper panels), and number of cells in each condition (bottom row) from scWGS DLP+. e. Cell-cycle phase fractions inferred from scRNA-seq for RPE-1 and FNE1 samples treated with DMSO (RPE-1-D and FNE1-D), Nocodazole (RPE-1-Noco and FNE1-Noco) and Reversine (RPE-1-Rev and FNE1-Rev). Cell-cycle phase fractions for RPE-1 samples were computed after excluding the spontaneously arising WGD present in these samples. f. STING1 expression in STING1 positive cells (top), mean STING1 expression (middle), and proportion of WGD cells (bottom) for non-WGD and WGD RPE-1 (left) and FNE1 (right) cells by treatment condition. Note that proportion of WGD cells was estimated from scRNA whereas in d, number of cells was computed from scWGS DLP+. Center line shows the median, box boundaries show quartiles, and whiskers indicate 1.58×IQR/sqrt(n). Each point is a cell: RPE-1-D non-WGD n = 744, WGD n = 63; RPE-1-Noco non-WGD n = 1013, WGD n = 77; RPE-1-Rev non-WGD n = 1050, WGD n = 29; RPE-1-Mixed non-WGD n = 79, WGD n = 117; FNE1-D non-WGD n = 486; FNE1-REF non-WGD n = 454; FNE1-Mixed non-WGD n = 66, WGD n = 203; cells. Wilcoxon two-sided test with Bonferroni-Hochberg correction, all comparisons p < 5.04 × 10⁻⁴. g. Cell-cycle phase fractions inferred from scRNA-seq for WGD and nonWGD populations in untreated mixed-WGD RPE-1 and FNE1 samples.
Extended Data Fig. 9
Extended Data Fig. 9. Microenvironment remodeling in the context of WGD and mutation signatures.
a. UMAPs showing differential cell state enrichment in WGD-high vs WGD-low samples in different TME cell types. b. Dotplot of log2 fold-changes and significance for TME cell type differential abundance testing between WGD-high and WGD-low in the whole cohort and in the HRD-Dup subset. Significance was calculated from Milo results using a permutation test (Methods). c. Cytotoxic CD8+ T cells (y-axis) and CXCL10+CD274+ Macrophages (x-axis) as fractions of CD45+ cells across CD45+ samples. Points are colored by the WGD class of the patient from which the sample originated. Spearman’s ρ and p-value are annotated.

References

    1. Bielski, C. M. et al. Genome doubling shapes the evolution and prognosis of advanced cancers. Nat. Genet.50, 1189–1195 (2018). - PMC - PubMed
    1. Zack, T. I. et al. Pan-cancer patterns of somatic copy number alteration. Nat. Genet.45, 1134–1140 (2013). - PMC - PubMed
    1. Frankell, A. M. et al. The evolution of lung cancer and impact of subclonal selection in TRACERx. Nature616, 525–533 (2023). - PMC - PubMed
    1. Dewhurst, S. M. et al. Tolerance of whole-genome doubling propagates chromosomal instability and accelerates cancer genome evolution. Cancer Discov.4, 175–185 (2014). - PMC - PubMed
    1. Kuznetsova, A. Y. et al. Chromosomal instability, tolerance of mitotic errors and multidrug resistance are promoted by tetraploidization in human cells. Cell Cycle14, 2810–2820 (2015). - PMC - PubMed