. 2025 Sep;645(8079):148-157.
doi: 10.1038/s41586-025-09256-9. Epub 2025 Jul 16.

A male-essential miRNA is key for avian sex chromosome dosage compensation

Affiliations

A male-essential miRNA is key for avian sex chromosome dosage compensation

Amir Fallahshahroudi et al. Nature. 2025 Sep.

Abstract

Birds have a sex chromosome system in which females are heterogametic (ZW) and males are homogametic (ZZ)1. The differentiation of avian sex chromosomes from ancestral autosomes entails the loss of most genes from the W chromosome during evolution1,2. However, the extent to which mechanisms evolved that counterbalance this substantial reduction in female gene dosage remains unclear. Here we report functional in vivo and evolutionary analyses of a Z-linked microRNA (miR-2954) with strong male-biased expression, previously proposed to mediate avian sex chromosome dosage compensation3. We knocked out miR-2954 in chicken, which resulted in early embryonic lethality in homozygous knockout males, probably driven by specific upregulation of dosage-sensitive Z-linked target genes. Evolutionary gene expression analyses further revealed that these dosage-sensitive target genes underwent both transcriptional and translational upregulation on the single Z in female birds. Altogether, this work unveils a scenario in which evolutionary pressures following W gene loss drove transcriptional and translational upregulation of dosage-sensitive Z-linked genes in females but also their transcriptional upregulation in males. The resulting excess of transcripts in males, resulting from the combined activity of two upregulated dosage-sensitive Z gene copies, was in turn offset by the emergence of a highly targeted miR-2954-mediated transcript degradation mechanism during avian evolution. This study uncovered a unique sex chromosome dosage compensation system in birds, in which a microRNA has become essential for male survival.


Conflict of interest statement

Competing interests: The authors declare no competing interests.

Figures

Fig. 1
Fig. 1. Role of miR-2954 in male chicken development.
a, Overview of major known sex determination systems in amniotes,,: ZW in birds (icons indicate chicken and ostrich, marking the deepest divergence in bird phylogeny), temperature-dependent sex determination (TSD) in crocodiles, XY in Iguania lizards (icon reflects the green anole), multiple (5X and 5Y) sex chromosomes in platypus and XY in humans. The approximate divergence times in million years (Myr) are indicated at the respective nodes. Note that the XY sex chromosomes in lizards and humans have evolved independently from different ancestral autosomes. b, Schematic of the experimental design used for the generation of miR-2954 KO chickens across generations (G0–G3) on the basis of genome editing (CRISPR–Cas9 with single guide RNA (sgRNA)) in PGCs and outcrossings (OCs), and the assessment of the resulting phenotypes (see Methods and Extended Data Fig. 1 for details). The restriction enzyme (RE) site used for genotype screening and homology-directed repair (HDR) template are indicated. c, Distribution of live and dead second-generation (G2) embryos, categorized by genotype (female wild-type ZW, female hemizygous KO ZKOW, male heterozygous KO ZKOZ and male homozygous KO ZKOZKO) and embryonic day of development. Numbers above the bars indicate the total number of embryos analysed for each subgroup. d, Kaplan–Meier survival curves showing survival rates for embryos with different genotypes during development. e, Distribution of live and dead third-generation (G3) embryos at embryonic day 14, grouped by genotype.
Fig. 2
Fig. 2. Impact of miR-2954 KO on gene expression in different tissues.
a, Left, log2[FC] in gene expression between ZKOZKO and ZZ genotypes for autosomal (n = 16,142) and Z-linked (n = 865) protein-coding genes; P values from two-sided Wilcoxon rank-sum tests are shown above. The log2[FC] estimates were on the basis of transcriptomes of E3 and E5 embryos from head, heart and body tissues (n = 3 biological replicates per tissue, genotype and developmental stage) using a statistical model that accounts for embryonic age. Middle, volcano plots showing the log2[FC] and −log10 of Benjamini–Hochberg Padj. values for predicted miR-2954 target and non-target protein-coding genes compared with the ZKOZKO and ZZ genotypes. Right, proportions of autosomal and Z-linked target and non-target genes among differentially expressed (DE) genes (Benjamini–Hochberg Padj. < 0.05) compared with the ZKOZKO and ZZ genotypes. The distribution of the predicted targets and non-targets of miR-2954 was compared using a χ2 test for each group. b, Overlap of Z-linked and autosomal differentially expressed genes across tissues. c, The log2[FC] in gene expression of autosomal and Z-linked target and non-target protein-coding genes in female hemizygous (ZKOW), male heterozygous (ZKOZ) and male homozygous (ZKOZKO) genotypes compared with the corresponding wild-type controls. P values from a two-sided Wilcoxon signed-rank test assessed differences in log2[FC] of Z-linked targets (n = 375) between ZKOW and ZKOZ and between ZKOZ and ZKOZKO genotypes. The log2[FC] estimates were on the basis of the transcriptome of the whole embryos at E2. All box plots show the median, 25th–75th percentiles and whiskers extending to 1.5× the interquartile range (IQR).
Fig. 3
Fig. 3. Expression patterns of miR-2954 and other miRNAs across tissues in control and KO embryos.
a, Distribution of expression levels (fragments per million mapped reads (FPM)) of miR-2954 in ZZ (n = 2), ZKOZ (n = 3) and ZKOZKO (n = 3) genotypes across head, heart and body at E5. Individual data points are overlaid with jitter. b, MA plot showing mean expression and log2[FC] of mature miRNAs (n = 674) when comparing ZKOZKO and ZZ genotypes across tissues. miRNAs with significant expression changes (Benjamini–Hochberg Padj. value < 0.01) are shown in red. For miR-2954, Benjamini–Hochberg Padj. values were less than 1 × 10−38 for all tissues. c, Normalized expression (2−ΔCT) of miR-2954 across the bursa of Fabricius (BF), bone, brain, heart, intestine, liver and muscle in male and female chicken embryos at E12 on the basis of reverse transcription–quantitative polymerase chain reaction (RT–qPCR) (n = 3). Benjamini–Hochberg Padj. values from two-sided t-tests are shown above. Individual data points were overlaid with jitter. All box plots show the median, 25th–75th percentiles and whiskers extending to 1.5× the IQR.
Fig. 4
Fig. 4. Experimental miR-2954 targets.
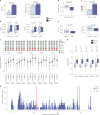
a, Proportions of predicted autosomal (Pred-Auto) and Z-linked (Pred-Z) miR-2954 targets with 8-mer binding sites (left) or several sites (right); P values from two-sided χ2 tests. b, The context+ scores of Pred-Auto (n = 1,892) and Pred-Z (n = 321); P value from two-sided Wilcoxon rank-sum test. c, Proportions of experimentally validated Z-linked targets (Exp-Z) and other Z-linked protein-coding genes (Other-Z) among chicken ohnologues; P value from two-sided χ2 test. d, Probabilities of haploinsufficiency (pHaplo) and triplosensitivity (pTriplo) between Exp-Z (n = 210) and Other-Z (n = 320) genes, split by ohnologue status; P values from two-sided Wilcoxon rank-sum tests. e, Tissue and developmental tau scores (0, broad; 1, specific) between Exp-Z (n = 248) and Other-Z (n = 461) genes; P values from two-sided Wilcoxon rank-sum tests. f, Median and IQRs of the ratios of current versus proto-Z (ancestral) expression for Z-linked non-targets (n = 193) and Exp-Z genes (n = 201) for males and females on the log2 scale. Reference lines indicate the ratios of −1 (half-ancestral expression), 0 (equal expression) and 1 (twofold ancestral expression). Statistical significance is shown as two one-sided test (TOST) Wilcoxon equivalence test (green, within ±0.5 of reference; grey, not significant) and two-sided one-sample Wilcoxon test (red, significant deviation; grey, not significant). g, The log2 female-to-male expression ratios for Exp-Z and Other-Z with fragments per kilobase million (FPKM) greater than one in the brain (n = 236), cerebellum (n = 220), heart (n = 225), kidney (n = 229) and liver (n = 237); P values from two-sided Wilcoxon rank-sum tests. h, Distribution of Exp-Z and Pred-Z genes in 0.5-Mb windows along the Z chromosome. The locations of MHM regions 1 and 2 (MHM1 and MHM2, red lines) and miR-2954 (green line) are indicated; P value from a two-sample Kolmogorov–Smirnov test. All box plots show the median, 25th–75th percentiles and whiskers extending to 1.5× the IQR.
Fig. 5
Fig. 5. Evolution of avian dosage compensation and the emergence and conservation of miR-2954 and its targets.
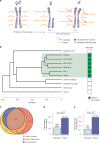
a, Illustration of the upregulation of dosage-sensitive Z-linked genes in birds following W gene loss and the concurrent evolution of miR-2954 to mitigate excess transcript accumulation in males. b, Phylogenetic distribution of miR-2954. The tree includes representative avian and other amniote species, with branch lengths scaled to represent the evolutionary time (million years). miR-2954 originated in the avian stem lineage (green branch). c, Overlap between miR-2954 targets identified by experimental data in chicken (Exp-Z) and predicted Z-linked targets in chicken and zebra finch (Pred-Z). The Venn diagram shows the number of shared and unique targets across datasets. d, Proportions of miR-2954 target genes on autosomes (Pred-A) and Z chromosome (Pred-Z) in chicken that are shared with zebra finch. The two-sided χ2 test P value is shown above. e, Proportions of Pred-A and Pred-Z genes with at least one target site conserved between chicken and zebra finch. The two-sided χ2 test P value for the comparison is indicated above.
Extended Data Fig. 1
Extended Data Fig. 1. Overview of the knockout of the miR-2954 locus.
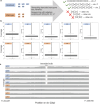
Top: overview of the XPA host gene showing the the miR-2954 locus, located in the second or third (depending on the isoform) intron of this gene. Bottom and middle panels: alignments and overview of the genomic reference sequence around miR-2954 locus, the induced deletion, and the single-stranded DNA oligonucleotide (ssODN) repair template used to leverage the homology-directed repair (HDR) pathway (Methods). A sequence track highlights the positions of the pre- and mature miR-2954 sequences. The ssODN repair template aligns with the post-editing PGC clone sequence, as confirmed by Sanger sequencing (clone #36, used for generating KO chickens), which includes a 36 bp deletion adjacent to an EcoRI restriction site. The accompanying chromatogram verifies the deletion, illustrating the consistency between the edited and expected sequences. We note that miR-1583, also shown in the figure, is not listed in miRGeneDB and is therefore not considered a confidently annotated microRNA.
Extended Data Fig. 2
Extended Data Fig. 2. Targeted long-read Oxford Nanopore sequencing of chromosome Z in Knock-out (KO) and control individuals.
a, DNA from five miR-2954 KO individuals and four control individuals was sequenced using adaptive sampling to enrich coverage for chromosome Z. b, Distributions of depth of coverage on chromosome Z among the nine sequenced samples. Box plots show the median, 25th–75th percentiles, and whiskers extending to 1.5× the IQR. c, All KO samples carried a 32 bp homozygous deletion over the targeted region, while the control samples had normal coverage in this region. No other genetic variants consistently distinguishing KO from control samples were detected on chromosome Z.
Extended Data Fig. 3
Extended Data Fig. 3. Quality control of RNA sequencing data.
a, Principal component analysis (PCA) of mRNA expression profiles across samples. The percentage of variance explained by the first two principal components (PC1 and PC2) is shown. b, Comparison of E2 whole embryos from “pure” Hy-Line (HL) females (original stock, n = 3) and wild-type ZW females from the G2 generation (n = 3). Top: volcano plot showing log2-fold changes (log2FC) and -log10 of Benjamini-Hochberg-adjusted P-values for predicted miR-2954 target and non-target protein-coding genes. Bottom: Log2FC values in gene expression between pure Hy-Line and G2 ZW females for autosomal (n = 16,142) and Z-linked (n = 865) protein-coding genes; P-values from two-sided Wilcoxon rank-sum tests are shown above. Box plots show median, 25th–75th percentiles, and whiskers extending to 1.5× the IQR. c, Cumulative distribution of log2FC values in gene expression between ZKOZKO and ZZ genotypes for autosomal and Z-linked protein-coding genes across head, body, and heart tissues.
Extended Data Fig. 4
Extended Data Fig. 4. Quality control of Ribo-seq libraries.
a, Distribution of ribosome footprint length across Ribo-seq libraries (nt, nucleotides). b, Ribo-seq and RNA-seq read fractions mapped to 5′-untranslated regions (5′-UTRs), coding sequences (CDSs) and 3′ untranslated regions (3′-UTRs). c, Distribution of Ribo-seq and RNA-seq reads across reading frames in the CDS of canonical protein-coding genes. d, Mean normalized footprint density along the CDS of canonical protein-coding genes for the Ribo-seq data. For each library, only read lengths with strong triplet periodicity were included. Each CDS was divided into 20 equal-length bins, with each bin representing the proportion of reads that mapped to that segment. e, Distribution of read counts (values > 1) for canonical protein-coding genes between two biological replicates of chicken brain Ribo-seq libraries, with the Spearman’s correlation coefficient (ρ) indicated.
Extended Data Fig. 5
Extended Data Fig. 5. Transcriptome and translatome comparison across different tissues and genotypes.
a, Log2-fold changes (Log2FC) between ZKOZKO and ZZ genotypes for both autosomal (Non-targets: n = 7279 (RIBO), n = 7566 (RNA); Targets: n = 2238 (RIBO), n = 2309 (RNA)) and Z-linked protein-coding genes (Non-targets: n = 197 (RIBO), n = 220 (RNA); Targets: n = 264 (RIBO), n = 292 (RNA)). Two-sided Wilcoxon test P-values between data types or target groups are indicated above and below. Log2FC estimates are either based on transcriptome (RNA) or translatome data (RIBO, indicated by dashed lines) of E3 embryo heads. Genes with FPKM > 1 were used and values were normalized using either the median of autosomal non-target transcriptome or translatome expression. b, Median and interquartile ranges of ratios of current versus proto-Z (ancestral) translation for Z-linked non-targets (n = 174) and Exp-Z (n = 188) genes for males and females (log2). Reference lines indicate ratios of − 1 (half ancestral expression), 0 (equal expression), and 1 (twofold ancestral expression). Statistical significance is indicated above as TOST (Two One-Sided Tests) Wilcoxon equivalence test (green indicates significance within equivalence bounds (reference value ± 0.5, Methods), gray indicates non-significance) and two-sided one-sample Wilcoxon test (red equals significant deviation from reference value, gray equals non-significant deviation). c, Female-to-male expression level ratios (log2) for Exp-Z and Other-Z genes in adult brain (Exp-Z: n = 203 (RIBO), n = 215 (RNA); Other-Z: n = 270 (RIBO), n = 297 (RNA)) and embryonic head (Exp-Z: n = 201 (RIBO), n = 212 (RNA); Other-Z: n = 257 (RIBO), n = 282 (RNA)). Two-sided Wilcoxon test P-values between data types or between target groups are indicated above and below. Ratios were calculated using either transcriptome (RNA) or translatome data (RIBO, indicated by dashed lines). Genes with FPKM > 1 were used and values were normalized using either the median of autosomal transcriptome or translatome expression. Statistical significance was assessed as in b). d, Female to male translational efficiency (TE) ratios (log2) for Exp-Z, Other-Z and Autosomal genes in adult brain (Exp-Z: n = 194; Other-Z: n = 259; Autosomal: n = 9843) and embryonic head (Exp-Z: n = 199; Other-Z: n = 246; Autosomal: n = 9276). Two-sided Wilcoxon test P-values between target groups are indicated above. Genes with FPKM > 1 were used and values were normalized using the median of autosomal TE ratios. All box plots show the median, 25th–75th percentiles, and whiskers extending to 1.5× the IQR.
Extended Data Fig. 6
Extended Data Fig. 6. Impact of miR-2954 knockout on gene expression in heterozygous KO males.
Left column: log2-fold changes (Log2FC) in gene expression between ZKOZ and ZZ genotypes for autosomal (n = 16,142) and Z-linked (n = 865) protein-coding genes; P-values from a two-sided Wilcoxon rank-sum test are indicated above. Log2FC estimates are based on transcriptomes of E3 and E5 embryos across head, heart, and rest of the body tissues (n = 3 biological replicates per tissue, genotype, and developmental stage). Box plots show the median, 25th–75th percentiles, and whiskers extending to 1.5× the IQR. Right column: proportions of autosomal and Z-linked target and non-target genes among the differentially expressed (DE) genes (Benjamini-Hochberg adjusted P < 0.05) when comparing ZKOZ and ZZ genotypes. Two-sided χ² test P-values are shown above.
Extended Data Fig. 7
Extended Data Fig. 7. Effects of miR-2954 knockdown on survival and gene expression.
a, Sequential injections of the mirVana inhibitor complexed with Invivofectamine 3.0 Reagent into embryos at E2.5 (left) and E4 (right) using a microcapillary glass needle. b, Survival proportions of miR-2954 knockdown (KD) embryos categorized by treatment, sex, and embryonic day (E) of development. Numbers above the bars indicate the numbers of dead vs. total number of embryos analyzed per subgroup at each timepoint; P-values are from two-sided χ² tests. E12 survival represents the subset of embryos that survived at E4 and received a second injection. c, Log2-fold change (KD vs. Control) of miR-2954 target genes and the XPA gene (top), and non-target genes (bottom) in heart tissue of male chicken embryos at E5 for control (n = 3) and miR-2954 KD (n = 5), measured by RT-qPCR. P-values are from two-sided t-tests with Benjamini-Hochberg correction. All box plots show the median, 25th–75th percentiles, and whiskers extending to 1.5× the IQR. Individual data points are overlaid with jitter.
Extended Data Fig. 8
Extended Data Fig. 8. Dosage sensitivity assessments in the extended set of 576 genes expressed during chicken development.
a, Probabilities of haploinsufficiency (pHaplo). b, Probabilities of triplosensitivity (pTriplo). In both panels, comparisons are shown between upregulated (Up) and non-upregulated (Non_Up), developmentally expressed Z-linked (n = 576) genes for both predicted (Pred) and non-predicted (Non_Pred) targets of miR-2954. Two-sided Wilcoxon test P-values are shown above. All box plots show the median, 25th–75th percentiles, and whiskers extending to 1.5× the IQR.
Extended Data Fig. 9
Extended Data Fig. 9. Alignment of the miR-2954 locus and segment of the XPA host gene sequence across vertebrates and conservation pattern.
MultiZ alignment of the genomic region containing miR-2954 across 77 vertebrate species, highlighting sequence conservation across species and phylogenetic relationships. On the left, a phylogenetic tree shows the evolutionary connections among species. The red bar marks the location of miR-2954. The main alignment consists of green bars, where each row represents a species’ sequence; green regions indicate conserved nucleotides, while white gaps signify divergence or deletions.
Extended Data Fig. 10
Extended Data Fig. 10. Genes with miR-2954 target sites in birds and outgroup species.
a, Proportion of autosomal and Z-linked genes with predicted miR-2954 target sites (7–8mer matches) among all protein-coding genes in chicken, and among 1:1 chicken orthologs in zebra finch, ostrich, crocodile, and human. Distributions of predicted targets and non-targets were compared using two-sided χ² tests. The number of predicted targets and the total number of genes in each category are shown above the bars. b, Mean number of miR-2954 target sites per kilobase of 3′ UTR in chicken and human. A total of 11,789 autosomal and 571 Z-linked genes with annotated 3′ UTRs in both chicken and human were used to calculate the number of target sites per kilobase of 3′ UTR. Error bars indicate 95% confidence intervals from permutation tests (n = 10,000), with empirical P-values from two-sided pairwise permutation tests shown above the bars. In both panels, genes were classified as autosomal or Z-linked based on the chromosomal location of their 1:1 chicken orthologs.

References

    1. Graves, J. A. Evolution of vertebrate sex chromosomes and dosage compensation. Nat. Rev. Genet.17, 33–46 (2016). - PubMed
    1. Cortez, D. et al. Origins and functional evolution of Y chromosomes across mammals. Nature508, 488–493 (2014). - PubMed
    1. Warnefors, M. et al. Sex-biased microRNA expression in mammals and birds reveals underlying regulatory mechanisms and a role in dosage compensation. Genome Res.27, 1961–1973 (2017). - PMC - PubMed
    1. Necsulea, A. & Kaessmann, H. Evolutionary dynamics of coding and non-coding transcriptomes. Nat. Rev. Genet.15, 734–748 (2014). - PubMed
    1. Julien, P. et al. Mechanisms and evolutionary patterns of mammalian and avian dosage compensation. PLoS Biol.10, e1001328 (2012). - PMC - PubMed

LinkOut - more resources