. 2025 Sep;645(8079):254-261.
doi: 10.1038/s41586-025-09263-w. Epub 2025 Jul 16.

Imidazole propionate is a driver and therapeutic target in atherosclerosis

Affiliations

Imidazole propionate is a driver and therapeutic target in atherosclerosis

Annalaura Mastrangelo et al. Nature. 2025 Sep.

Abstract

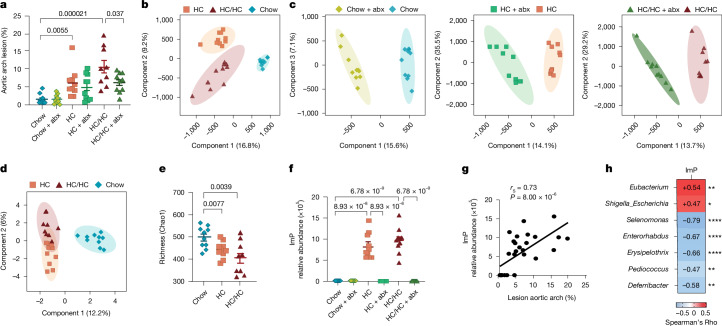
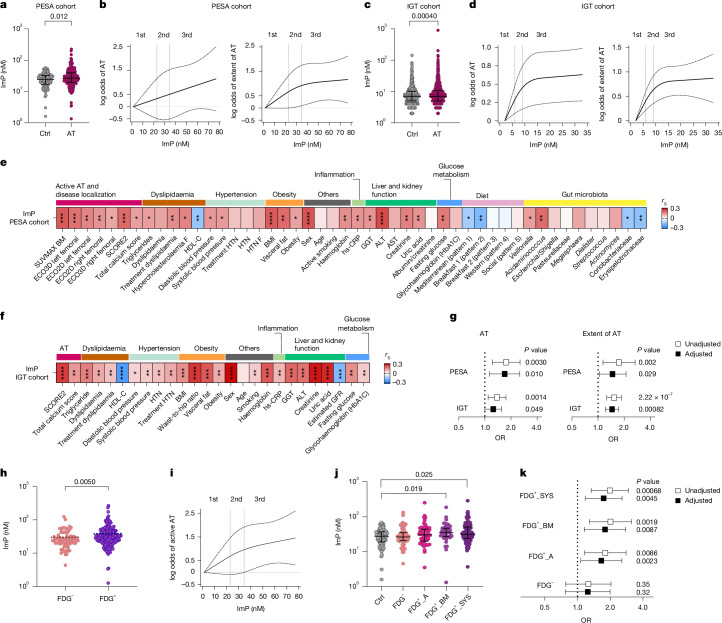
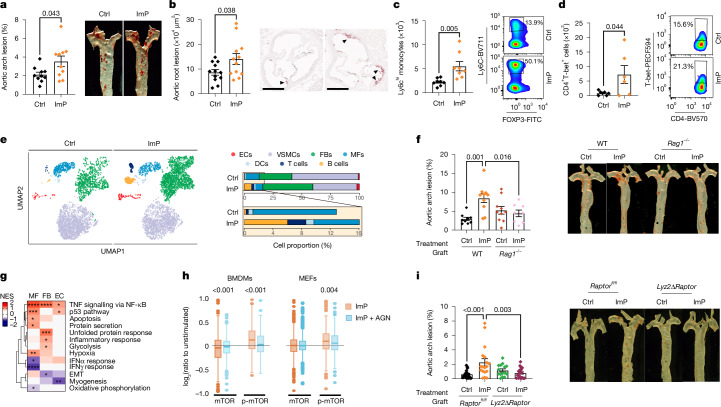
Atherosclerosis is the main underlying cause of cardiovascular diseases. Its prevention is based on the detection and treatment of traditional cardiovascular risk factors1. However, individuals at risk for early vascular disease often remain unidentified2. Recent research has identified new molecules in the pathophysiology of atherosclerosis3, highlighting the need for alternative disease biomarkers and therapeutic targets to improve early diagnosis and therapy efficacy. Here, we observed that imidazole propionate (ImP), produced by microorganisms, is associated with the extent of atherosclerosis in mice and in two independent human cohorts. Furthermore, ImP administration to atherosclerosis-prone mice fed with chow diet was sufficient to induce atherosclerosis without altering the lipid profile, and was linked to activation of both systemic and local innate and adaptive immunity and inflammation. Specifically, we found that ImP caused atherosclerosis through the imidazoline-1 receptor (I1R, also known as nischarin) in myeloid cells. Blocking this ImP-I1R axis inhibited the development of atherosclerosis induced by ImP or high-cholesterol diet in mice. Identification of the strong association of ImP with active atherosclerosis and the contribution of the ImP-I1R axis to disease progression opens new avenues for improving the early diagnosis and personalized therapy of atherosclerosis.


Conflict of interest statement

Competing interests: F.B. receives research funding from Biogaia AB and Novo Nordisk A/S, is co-founder and shareholder of Roxbiosens Inc., and is on the scientific advisory board of Bactolife A/S. F.B., K.R.B. and A.C. are co-founders and shareholders of Implexion Pharma AB. A.M., I.R.-V., D.S., B.I., V.F. and D.M. are inventors on a patent application titled Antagonists of the I1R for use in the Prevention and/or Treatment of an Autoinflammatory or Autoimmune Disease, publication number WO2025002914 (2025). The other authors declare no competing interests.

Figures

Fig. 1
Fig. 1. Untargeted metabolomics unveils ImP as a microbiota-dependent metabolite that is associated with atherosclerosis.
Apoe−/− mice were fed chow, HC diet or HC/HC diet with or without antibiotics (abx) in the drinking water. a, Quantification of atherosclerotic plaque lesion size in the aortic arch by Oil red O staining. Each point represents an individual mouse (n = 10 per group for all conditions, except chow-fed mice administered antibiotics and HC/HC-fed mice, n = 9). bd, Score plots of partial least squares discriminant analysis (PLS-DA) performed on liquid chromatography–mass spectrometry (LC–MS) data of plasma samples collected at endpoint (euthanasia) (n = 10 per group) for the three diets (b) and the three diets with antibiotics (c) and 16S rDNA sequencing analysis of caecal samples collected at endpoint (chow, HC, n = 10; HC/HC, n = 9) (d). e, Chao1 richness analysis of microbiota diversity. f,g, ImP relative abundance in plasma from Apoe−/− male mice at endpoint measured by untargeted LC–MS (f) and correlation with aortic arch lesion (g). h, Correlation matrix showing the correlation between ImP and gut microbiota genera (>0.1% of total abundance) in caecal samples from Apoe−/− mice fed chow, HC or HC/HC diets for 8 weeks. Data are pooled from two independent experiments (chow, HC, n = 10; HC/HC, n = 9). g,h, Correlation coefficient (rs) and P values are calculated by Spearman’s rank-order correlation test. a,e,f, Individual data and arithmetic mean ± s.e.m. of each group are shown. Two-sided one-way ANOVA with Tukey post hoc correction. *P < 0.05, **P < 0.01, ****P < 0.0001. Source Data
Fig. 2
Fig. 2. ImP is associated with subclinical atherosclerosis in humans.
a,c, Plasma ImP in healthy individuals (Ctrl) and individuals with subclinical atherosclerosis (AT) from the PESA (a; Ctrl, n = 105; AT, n = 295) and IGT (c; Ctrl, n = 529; AT, n = 1,315) cohorts. b,d, Dose–response curves of plasma ImP concentration and endpoints in the PESA (b) and IGT (d) cohorts. e,f, Spearman correlation matrices between ImP and atherosclerosis traits, diet and microbiota in the PESA (e) and IGT (f) cohorts. Benjamini–Hochberg adjusted P values. ALT, alanine aminotransferase; AST, aspartate aminotransferase; BM, bone marrow; ECO2D, 2D vascular ultrasound; ECO3D, 3D vascular ultrasound; F, familial; GFR, glomerular filtration rate; GGT, gamma-glutamyl transferase; HTN, hypertension. g, Adjusted regression models for the association of ImP with atherosclerosis (left) and extent of atherosclerosis (right) in the PESA (top, n = 400) and IGT (bottom, n = 1,844) cohorts. Effect estimates were controlled for age, sex, smoking, creatinine, family history of CVD, haemoglobin, hypertension and LDL-C (PESA cohort) and age, smoking, family history of CVD, hypertension, LDL-C, Hb1Ac, hs-CRP and ALT (IGT cohort). Error bars show 95% confidence intervals. OR, odds ratio. h,j, Plasma ImP in individuals with inactive atherosclerosis (FDG, n = 74) and active atherosclerosis (FDG+, n = 221) (h). FDG+ individuals were further stratified according to vascular inflammation (arterial 18F-FDG uptake, FDG+_A, n = 57), bone marrow activation (18F-FDG uptake in bone marrow, FDG+_BM, n = 40) and systemic inflammation (concurrent arterial and bone marrow 18F-FDG uptake, FDG+_SYS, n = 124) (j). FDG refers to the group of inactive atherosclerosis. a,c,h,j, Horizontal line represents median and error bars show interquartile range (Supplementary Tables 1a, 2a and 4). Two-tailed Mann–Whitney U-test. i, Dose–response curve for plasma ImP effect on active atherosclerosis for the PESA cohort. b,d,i, Dashed lines represent the 95% confidence interval; vertical lines delineate tertiles. k, Multinomial logistic regression for subclinical atherosclerosis in the atherosclerosis subgroups (FDG+_SYS, FDG+_BM, FDG+_A and FDG) versus controls according to plasma ImP. Odds ratio was adjusted for age, sex, smoking, glucose, hs-CRP and haemoglobin concentration. g,k, Whiskers indicate 95% confidence intervals (values in Supplementary Tables 3 and 5). ***P < 0.001. Source Data
Fig. 3
Fig. 3. Increased circulating ImP induces atherosclerosis and systemic inflammation in chow-fed atherosclerosis-prone mice.
a, ImP was administered (ImP) or not (Ctrl) to chow-fed Ldlr−/− mice. Oil red O staining of aortic arch (left, n = 10) and representative images of aorta (right). be, ImP was administered (ImP) or not (Ctrl) to Apoe−/− mice. b, Quantification (left) and representative images (right) of Oil red O staining of aortic root lesions. n = 12. Arrowheads indicate areas with positive Oil red O staining. Scale bars, 500 µm. c,d, Flow cytometry analysis of Ly6Chi monocytes (n = 8) (c) and T-bet in CD4+ T cells (n = 6) (d) in blood at endpoint. Right, representative density plots for Ctrl and ImP. e, Uniform manifold approximation and projection (UMAP) embedding (left) and cell proportions (right) labelled by cell type of cells derived from whole aorta, based on transcriptomic profiles. DCs, dendritic cells; ECs, endothelial cells; FBs, fibroblasts; MFs, macrophages; VSMCs, vascular smooth muscle cells. f, Ldlr−/− mice grafted with bone marrow from wild-type (WT) (Ctrl, n = 9; ImP, n = 10) or Rag1−/− (Ctrl, n = 10; ImP, n = 8). Atherosclerosis by Oil red O staining of aortic arch (left) and representative images of aorta (right). g, Heat map of GSEA comparing ImP versus control for endothelial cells, fibroblasts and macrophages from scRNA-seq data of Apoe−/− mice fed chow diet for 4 weeks. EMT, epithelial–mesenchymal transition; NES, normalized enrichment score. h, Global abundance of peptides (mTOR) and phosphopeptides (p-mTOR) in BMDMs (left) or MEFs (right) treated with ImP for 3 h with or without AGN192403 (AGN). The log2 ratio is relative to unstimulated conditions. i, Ldlr−/− mice grafted with bone marrow from control Raptorfl/fl (Ctrl, n = 17; ImP, n = 18) or Lyz2ΔRaptor (Ctrl, n = 15; ImP, n = 18). Quantification (left) and representative images (i) of Oil red O staining of aorta, showing atherosclerosis in aortic arch. ad,f,i, Individual data points and mean ± s.e.m. of at least two pooled independent experiments. ad, Two-tailed unpaired Student’s t-test. f,i, One-way ANOVA with Tukey post hoc correction. g, Two-tailed Kolmogorov–Smirnov test comparing ImP versus unstimulated. h, Two-tailed Wilcoxon signed rank test comparing peptide and phosphopeptide abundance in ImP versus ImP plus AGN treatments. Source Data
Fig. 4
Fig. 4. Blockade of I1R prevents atherosclerosis induction by ImP or high-cholesterol diet.
a, Ldlr−/− mice grafted with bone marrow from control Nischfl/fl (Ctrl, n = 17; ImP, n = 20) or Lyz2ΔNisch (Ctrl, n = 19; ImP, n = 18) and fed chow diet for 12 weeks. Oil red O staining of aortic arch (left) and representative images of aorta (right). bg, Chow-fed Apoe−/− mice were treated as indicated. b, Oil red O staining of aortic arch (left) and representative images of aorta (right). Ctrl, n = 15; ImP, n = 17; ImP + AGN, n = 16. c, Left, Ly6Chi monocytes in blood at endpoint (n = 15). Right, representative density plots. d, IFNγ and TNF in plasma. n = 10. e, Left, p-S6 staining in peritoneal macrophages. Ctrl, n = 10; ImP, n = 9; ImP + AGN, n = 10. Right, representative histograms. f, Ratio of TH1 to Treg cells infiltrated in aorta. Ctrl, n = 9; ImP, n = 7, ImP + AGN, n = 7. g, F4/80+CD86+ cells infiltrated in aorta. n = 10. f,g, Left, individual data. Right, representative density plots. hm, Apoe−/− mice were fed a chow diet or HC diet for 8 weeks; AGN192403 was added to the HC group (HC + AGN) in the last 4 weeks. h, Oil red O staining of aortic arch (left) and representative images of aorta (right). Chow, n = 15; HC, n = 14; HC + AGN, n = 13. i, Masson’s trichrome staining of aortic roots. Quantification of lesions in aortic roots (left), necrotic core area (middle) and representative images (right). Arrowheads indicate necrotic areas. Chow, n = 12; HC, n = 13; HC + AGN, n = 14. Scale bars, 500 µm. j,k, Individual data (left) and representative density plots (right) for flow cytometry quantification of blood Ly6Chi monocytes (j; chow, n = 12; HC, n = 13; HC + AGN, n = 13) and T-bet+ CD4+ TH1 cells (k; chow, n = 10; HC, n = 9; HC + AGN, n = 10). l, Plasma IFNγ and TNF. Chow, n = 10; HC, n = 9; HC + AGN, n = 10. m, Individual data (left; chow, n = 12; HC, n = 10; HC + AGN, n = 11) and representative histograms (right) for p-S6 staining in peritoneal macrophages. am, Individual data points and mean ± s.e.m. from at least two pooled independent experiments. One-way ANOVA with Tukey post hoc correction. Source Data
Extended Data Fig. 1
Extended Data Fig. 1. High cholesterol diets and antibiotics modulate gut microbiota and plasma metabolites in ApoE−/− mice.
a, Experimental setup corresponding to Fig. 1 and Extended Data Fig. 1. ApoE−/− mice were fed different diets (chow, high cholesterol (HC), HC and high choline (HC/HC)) for 8 weeks. At 4 weeks post diet initiation, mice were treated or not with a cocktail of antibiotics (abx) in the drinking water. At sacrifice, aorta, heart, cecal content and plasma samples were collected and analysed. b, Stacked barplots showing the relative abundance of 16S rDNA sequences, at the genus level ( > 1% of total abundance), that are significantly different in cecal samples of the indicated groups. Genera shown are all significantly different between chow and HC diets by two-sided Kruskal-Wallis with Dunn’s correction test. n = 9. c, Relative abundance of TMAO in plasma measured by untargeted LC-MS. n = 10. d, Correlation of TMAO’s relative abundance with aortic arch lesion. Correlation coefficient (R) and p-value are calculated as the Pearson’s parametric correlation test. n = 29 (chow and HC n = 10 and HC/HC n = 9). e, Tandem mass spectrometry fragmentation by higher-energy collisional dissociation (HCD) using 50 eV as collisional energy of the imidazole propionate (ImP) standard (left) and endogenous m/z  =  141.06535 mass from plasma of ApoE−/ − mice fed different diets as indicated. b-d, data are pooled from two independent experiments. c, Arithmetic mean ± SEM of each group is shown. Two-sided one-way ANOVA with Tukey post-hoc correction. Source Data
Extended Data Fig. 2
Extended Data Fig. 2. Metabolic and dietary features of asymptomatic volunteers from the PESA and IGT cohorts.
a, Plasma concentration of histidine and urocanic acid in healthy subjects (CTR) and subjects with subclinical atherosclerosis (AT) from the PESA cohort (left, CTR n = 105, AT n = 295, plasma concentration for both metabolites) and the IGT cohort (right, CTR n = 529, AT n = 1315, plasma concentration for both metabolites). Data on a base-10 Log scale. Median with interquartile range for each group is shown. ns: non-significant. b, Radar graph of loadings factors for each dietary pattern. c, ROC analysis for the additive value of ImP over LDL-C alone to discriminate subclinical total AT (left and center) and active AT (right). Left, PESA cohort: AUCImP+LDL-C 0.591 (CI: 0.524-0.639) vs. AUCLDL-C 0.533 (CI: 0.488-0.590), ΔAUC = 0.058 (CI: 0.01-0.127) p = 0.006. Center, IGT cohort: AUCImP+LDL-C 0.565 (CI:0.535-0.590) vs. AUCLDL-C 0.536 (CI: 0.508-0.565), ΔAUC = 0.029 (CI: 0.014-0.05) p = 0.008. Right, active AT: AUCImP+LDL-C 0.613, (CI: 0.554-0.659) vs. AUCLDL-C 0.502 (CI: 0.479-0.524), ΔAUC = 0.11 (CI: 0.061-0.189) p = 0.00042. d, ROC analysis for the additive value of ImP on the top of high-sensitivity C Reactive Protein (hs-CPR) to discriminate early AT (left and center) and active AT (right). Left, PESA cohort: AUCImP+hs-CRP 0.588 (CI: 0.525-0.651) vs. AUChs-CRP 0.511 (CI:0.501-0.532), ΔAUC = 0.077 (CI 0.014-0.133, p = 0.006. Center, IGT cohort: AUCImP+hs-CRP 0.559 (CI:0.530-0.584) vs. AUChs-CRP 0.530 (CI:0.10-0.552), ΔAUC = 0.029 (CI:0.06-0.053) p = 0.003. Right, active AT: AUCImP+hs-CRP 0.620, (CI: 0.567-0.674) vs. AUChs-CRP 0.514 (CI:0.501-0.536), ΔAUC = 0.11 (CI 0.054-0.155) p = 0.00042. e, Schematic representation of the distribution of volunteers from the PESA study. Based on multiterritorial/multimodal imaging (i.e. 2D/3D vascular ultrasound and non-contrast computed tomography), we classified 295 participants with subclinical atherosclerosis and 105 controls without atherosclerosis (green). Subjects with subclinical atherosclerosis were further stratified according to their uptake of Fluorodeoxyglucose (18F-FDG): those without any uptake considered as inactive atherosclerosis (FDGneg, yellow); those with metabolic activity in bone marrow (FDG + _BM, n = 40), arteries (FDG + _A, n = 57), or in both compartments (FDG + _SYS, n = 124) considered as active atherosclerosis (FDG + , red). Pictures are representative images of uptake in arteries and bone marrow. Source Data
Extended Data Fig. 3
Extended Data Fig. 3. The induction of atherosclerosis by ImP supplementation in chow-fed atherosclerosis-prone mice is independent of changes in cholesterol and glucose concentration.
a,b, Chow-fed Ldlr−/− mice were administered ImP (ImP) or not (CTR) in the drinking water for 12 weeks, followed by sacrifice and analysis. a, Oil red O en face staining of the aorta showing quantification of atherosclerotic lesions in whole aorta (left) and representative images (right). n = 10. b, Total cholesterol and glucose concentration in plasma. CTR = 10; ImP=9. c,d, Chow-fed ApoE−/− mice were treated with ImP or not (CTR) in the drinking water for 8 weeks. c, Masson’s trichrome staining of the aortic roots showing quantification of lesion area (left) and representative images (right). CTR = 10; ImP=13. Bar size= 500 µm. d, Quantification of atherosclerotic lesions by Oil red O en face staining of the aorta showing quantification in aorta (left), aortic arch (middle) and representative images of aorta (right). CTR = 17; ImP=19 e, Total cholesterol (n = 14) and glucose concentration (n = 15) in plasma. f, HC-fed Ldlr−/− mice were administered ImP (ImP) or not (CTR) in the drinking water for 12 weeks, Oil red O en face staining of the aorta showing quantification of atherosclerotic lesions in aorta (left) and representative images (right). n = 9. g, HC-fed Apoe−/− mice were administered ImP (ImP) or not (CTR) in the drinking water for 4 weeks, followed by sacrifice and analysis Oil red O en face staining of the aorta showing quantification of atherosclerotic lesions in aorta (left) and representative images (right). HC = 10; HC+ImP=9 a-g, Individual data and mean ± SEM from at least two pooled independent experiments. a,b,c,e,g, Two-tailed unpaired Student’s t test. d, Two-tailed Mann–Whitney U test. f, One-tailed unpaired Student’s t test. Source Data
Extended Data Fig. 4
Extended Data Fig. 4. Increased ImP in circulation induces atherosclerosis and systemic inflammation in chow-fed atherosclerosis-prone mice.
a-k, Chow-fed ApoE−/− mice were administered ImP for 4 or 8 weeks as indicated. a, Numbers of RORγt in CD4+ T cells in blood at sacrifice. Left: n = 7. Right: representative density plots for CTR (top) and ImP (bottom). b,c UMAP embeddings of whole aorta-derived cells profiled by scRNAseq colored by cell type, regardless of treatment duration (b) and by treatment and time (c). d, Dot plot of cell type markers used to identify main cell populations. e, UMAP embedding (left) and cell proportions (right) labelled by cell type of whole aorta-derived cells based on transcriptomic profiles from chow-fed ApoE−/− mice after 4 weeks of ImP administration. f, Quantification of atherosclerotic lesions by Oil red O en face staining of the aorta, showing quantification in whole aorta (left), aortic arch (middle) and representative images (right) following 4 weeks of ImP administration. CTR = 10; ImP=8. g-i, Numbers of circulating Ly6Chigh monocytes CTR = 7; ImP=10 (g), CD90+ T cells, B220+ B cells and F4/80+ Macrophages CTR = 9; ImP=10 (h) after 4 weeks of ImP administration determined by flow cytometry. i, Total numbers of CD45+ cells, CD90+ T cells and B220+ B cells infiltrated in aorta after 8 weeks of ImP administration by flow cytometry analysis. CTR = 9; ImP=10. j, Staining of CD3+ cells in intima/media layer in aortic roots showing quantification (left) and representative images (right) of infiltrated T cells after 8 weeks of ImP administration. CTR = 11; ImP=16. Bar size = 500 µm. k, MAC2 staining inside atheroma plaque showing MAC2+ area quantification (left) and representative images (right) after 8 weeks of ImP administration. CTR = 9; ImP=12, Bar size = 500 µm. l, ImP was administered (ImP) or not (CTR) to Ldlr−/− mice grafted with BM from WT (CTR = 9, ImP=10) or Rag1−/− (CTR = 10, ImP=8) and fed chow diet for 12 weeks. Quantification of atherosclerotic lesions by Oil red O en face staining of the aorta, showing quantification in whole aorta. f-l, Individual data and mean ± SEM from at least two pooled independent experiments. a, f (left),h-k, Two-tailed Unpaired Student’s t test. f (right), g, h (left), Two-tailed Mann–Whitney U test. l, One-way ANOVA with Tukey post-hoc correction. Source Data
Extended Data Fig. 5
Extended Data Fig. 5. ImP induces transcriptional changes in fibroblasts, macrophages and endothelial cells.
a-g, Chow-fed ApoE−/− mice were administered ImP and the aorta-derived cells from the scRNAseq were analysed. a-c, Dot plot of expression levels of cell type markers used to identify cell subclusters for macrophages (MFs) (a), fibroblasts (FBs) (b), and endothelial cells (ECs) (c). d-f, Table of representative gene ontology (GO) terms enriched in the subclusters of MFs (d), FBs (e) and ECs (f). All shown GO terms are significant (adjusted p-value ≤ 0.05). g, Relative abundance (log-ratio) of the subcluster cell proportions comparing ImP treatment vs CTR, regardless of the treatment duration. h, MCP1 concentration measured by ELISA in the supernatant of MEFs treated with ImP for 24 h. n = 10. i, Number of post-migration monocytes collected in the bottom chamber in response to supernatant from (h) and quantified by flow cytometry. n = 7. j, Heat map of gene set enrichment analysis (GSEA) from RNAseq analysis of bone marrow-derived macrophages (BMDMs), mouse embryonic fibroblasts (MEFs) and mouse aortic ECs (MAECs) comparing ImP stimulation after 1 h and 2 h vs unstimulated conditions within each cell type. k, GSEA enrichment plots of phosphopeptides related to the mTOR pathway from BMDMs (top) and MEFs (down) after ImP treatment for 180 min compared with unstimulated cells. Global abundances of all peptides related to the mTOR pathway were used for the analysis. l,m, BMDMs (left) and MEFs (right) after ImP stimulation for 24 h with or without rapamycin co-incubation. l, Flow cytometry staining for pS6 ribosomal protein. Left: BMDM n = 8; MEF CTR = 10; ImP=10; ImP + AGN = 9; Right: representative histograms for CTR (top), ImP (middle) and ImP + rapamycin (bottom). m,TNF production measured by ELISA. BMDM n = 7; MEF n = 9 n, Flow cytometry staining for pS6 in peritoneal macrophages harvested from chow-fed ApoE−/− mice administered ImP for 8 weeks. Left: n = 9. Right: representative histograms for CTR (top), ImP (bottom). o, ImP was administered (ImP) or not (CTR) to Ldlr−/− mice grafted with BM from control Raptorf/f (CTR = 17; ImP=18) or Lyz2ΔRaptor (CTR = 15; ImP=18) and fed chow diet for 12 weeks. Quantification of atherosclerotic lesions by Oil red O en face staining of the aorta, showing quantification in whole aorta. a-c, Wilcoxon rank sum test comparing cell clusters. Adjusted p-value < 0.05. g, Two-proportions Z-test. h,i, Data are pooled from n = 7 independent experiments. h, Two-tailed Unpaired Student’s t test. i, Two-tailed Mann–Whitney U test. j, Kolmogorov Smirnov test. k, Nominal p-values were calculated using a 1000-permutation test. l,m,o, Individual data (each one represent an independent experiment) and mean ± SEM. One-way ANOVA with Tukey post-hoc correction. n, Individual data and mean ± SEM of at least two pooled independent experiments. Two tailed unpaired Student’s t test between CTR and ImP. *p < 0.05; **p < 0.01; ***p < 0.005; ****p < 0.001. Source Data
Extended Data Fig. 6
Extended Data Fig. 6. Imidazoline-1 receptor mediates functional responses that are induced by ImP.
a,b, Bone marrow-derived macrophages (BMDMs) and mouse mouse embryonic fibroblasts (MEFs) were treated in vitro with ImP (or not, CTR) and co-incubated with AGN192403 (AGN, I1R antagonist), Idazoxan (IR and adrenoreceptor (α2) antagonist) or Yohimbine (α2 antagonist). a, Flow cytometry staining for pS6 (left, n = 10) and representative histograms (right) corresponding to each treatment matched by color. b, TNF production in 24 h culture supernatant by ELISA (BMDMs: CTR = 11, ImP+medium=12, ImP+AGN = 9, ImP+idazoxan=7, ImP+yohimbine=7; MEF: n = 10 for all groups). c,d MEFs were transfected with I1R siRNA (siNisch) or control siRNA (siCTR) and stimulated with ImP or not (CTR) and co-incubated or not with AGN192403 (AGN) as indicated. c, Flow cytometry staining for pS6, showing quantification of percentage of pS6 positive cells (left, n = 4) and representative histograms (right) corresponding to each treatment indicated and matched by color. d, TNF production in 24 h culture supernatant by ELISA. n = 4. e, CD45+CD11b+ and CD45+CD3+ splenic cells were isolated to analyse Nisch mRNA relative expression by qRT-PCR. CD11b+ Nischf/f = 3, CD11b+ Lyz2ΔNisch = 5; CD3+ Nischf/f = 3, CD3+ Lyz2ΔNisch = 5; f,g BMDMs were generated from Nischf/f or Lyz2ΔNisch mice and treated or not (CTR) with ImP in vitro. f, Flow cytometry staining for pS6, showing quantification of percentage of pS6 positive cells (left) and representative histograms (right) corresponding to each treatment matched by color. Nischf/f CTR = 5, Nischf/f ImP=5, Lyz2ΔNisch CTR = 7, Lyz2ΔNisch ImP=7. g, TNF production in 24 h culture supernatant by ELISA. Nischf/f CTR = 5, Nischf/f ImP=5, Lyz2ΔNisch CTR = 7, Lyz2ΔNisch ImP=7.h. ImP was administered (ImP) or not (CTR) to Ldlr−/− mice grafted with BM from control Nischf/f or Lyz2ΔNisch and fed chow diet for 12 weeks. Quantification of atherosclerotic lesions in the aorta by Oil red O en face staining of the aorta. n = 17-20 a,b, Arithmetic mean ± SEM and individual data from biological replicates. One-way ANOVA with Tukey post-hoc correction. c,d, Arithmetic mean ± SEM and individual data from n = 4 pooled independent experiments. One-way ANOVA with Tukey post-hoc correction. e, Arithmetic mean ± SEM and individual data from biological replicates. Two tailed unpaired Student’s t test between Nischf/f and Lyz2ΔNisch. f,g, Arithmetic mean ± SEM and individual data. One-way ANOVA with Tukey post-hoc correction. h, One-way ANOVA with Tukey post-hoc correction Nischf/f (CTR = 17, ImP=20) or Lyz2ΔNisch (CTR = 19 ImP=18). In all panels, n indicates biological replicates. Source Data
Extended Data Fig. 7
Extended Data Fig. 7. Inhibition of the ImP/I1R axis with AGN192403 prevents ImP-induced immune and inflammatory response without affecting circulating ImP and cholesterol concentration.
a-i, ImP was administered (or not, CTR) in the presence of AGN192403 (AGN) or not (ImP) in drinking water to ApoE−/− mice fed chow diet for 8 weeks, followed by sacrifice and analysis. a, Oil red O en face staining of the aorta showing quantification of atherosclerotic lesions in whole aorta in male mice. CTR = 15; ImP=17; ImP + AGN = 16. b, Oil red O en face staining of the aorta showing quantification of atherosclerotic lesions in whole aorta (left), aortic arch (middle) and representative images (right) in female mice. CTR = 7; ImP=17; ImP + AGN = 16. c, Total cholesterol concentration in plasma. Male mice (left), CTR = 14; ImP= 13; ImP + AGN = 15, and female mice (right), CTR = 7; ImP=17; ImP + AGN = 14. d, Imidazole Propionate concentration in plasma of male mice at sacrifice. CTR = 10; ImP=13; ImP + AGN = 17. e,f, Number of T-bet in CD4+ T cells. (e), and CD90+ T and B220+ B cells (f) in blood at sacrifice by flow cytometry. CTR = 9; ImP=10; ImP + AGN = 10 (e) and n = 15 (f). g-j Number of aorta infiltrated T-bet+ Th1. CTR = 9; ImP=7; ImP + AGN = 7 (g) and FoxP3+ Treg cells CTR = 9; ImP=7; ImP + AGN = 7 (h), B220+ B cells. n = 10 (i) and F4/80+ Cd11c+ cells. CTR = 9; ImP=10; ImP + AGN = 10 (j) by flow cytometry. e,f,j, Right: representative density plots for CTR (top), ImP (middle) and ImP+AGN (bottom). a-j, Arithmetic mean ± SEM and individual data from at least two pooled independent experiments. One-way ANOVA with Tukey post-hoc correction. Source Data
Extended Data Fig. 8
Extended Data Fig. 8. Inhibition of the ImP/I1R axis with AGN192403 prevents HC-induced atherosclerosis without affecting circulating ImP and cholesterol concentration.
a-e, ApoE−/− mice were fed a chow diet or high cholesterol (HC) diet for 8 weeks. At 4 weeks post-diet initiation, AGN192403 was administered (AGN) or not in the drinking water to mice fed HC diet until week 8, followed by sacrifice and analysis. a, Oil red O en face staining of the aorta in male mice showing quantification of atherosclerotic lesions in the whole aorta. Chow=15; HC = 14; HC + AGN = 13. b, ImP concentration in plasma of male mice at sacrifice. Chow=10; HC = 14; HC + AGN = 13. c, Oil red O en face staining of the aorta in female mice showing quantification of atherosclerotic lesion in the whole aorta (left), aortic arch (middle) and representative images (right). Chow=8; HC = 15; HC + AGN = 18. d, Caspase 3 staining of aortic roots. Quantification of caspase-3+ (left) and representative images of caspase-3 staining (right). Bar size= 500 µm. Chow=12; HC = 13; HC + AGN = 14. e, Total cholesterol concentration in plasma in male (left), n = 15, and female mice (right), Chow=7; HC = 14; HC + AGN = 17, at sacrifice. a-e, Arithmetic mean ± SEM and individual data from at least two pooled independent experiments. One-way ANOVA with Tukey post-hoc correction. Source Data

References

    1. SCORE2 working group and ESC Cardiovascular risk collaboration. SCORE2 risk prediction algorithms: new models to estimate 10-year risk of cardiovascular disease in Europe. Eur. Heart J.42, 2439–2454 (2021). - PMC - PubMed
    1. Fernández-Friera, L. et al. Prevalence, vascular distribution, and multiterritorial extent of subclinical atherosclerosis in a middle-aged cohort. Circulation131, 2104–2113 (2015). - PubMed
    1. Libby, P. The changing landscape of atherosclerosis. Nature592, 524–533 (2021). - PubMed
    1. Brandts, J. & Ray, K. K. Novel and future lipid-modulating therapies for the prevention of cardiovascular disease. Nat. Rev. Cardiol.20, 600–616 (2023). - PubMed
    1. Ridker, P. M. et al. Antiinflammatory therapy with canakinumab for atherosclerotic disease. N. Engl. J. Med.377, 1119–1131 (2017). - PubMed

MeSH terms

LinkOut - more resources