. 2025 Sep;645(8080):484-495.
doi: 10.1038/s41586-025-09278-3. Epub 2025 Jul 16.

Neutrophils drive vascular occlusion, tumour necrosis and metastasis

Affiliations

Neutrophils drive vascular occlusion, tumour necrosis and metastasis

Jose M Adrover et al. Nature. 2025 Sep.

Abstract

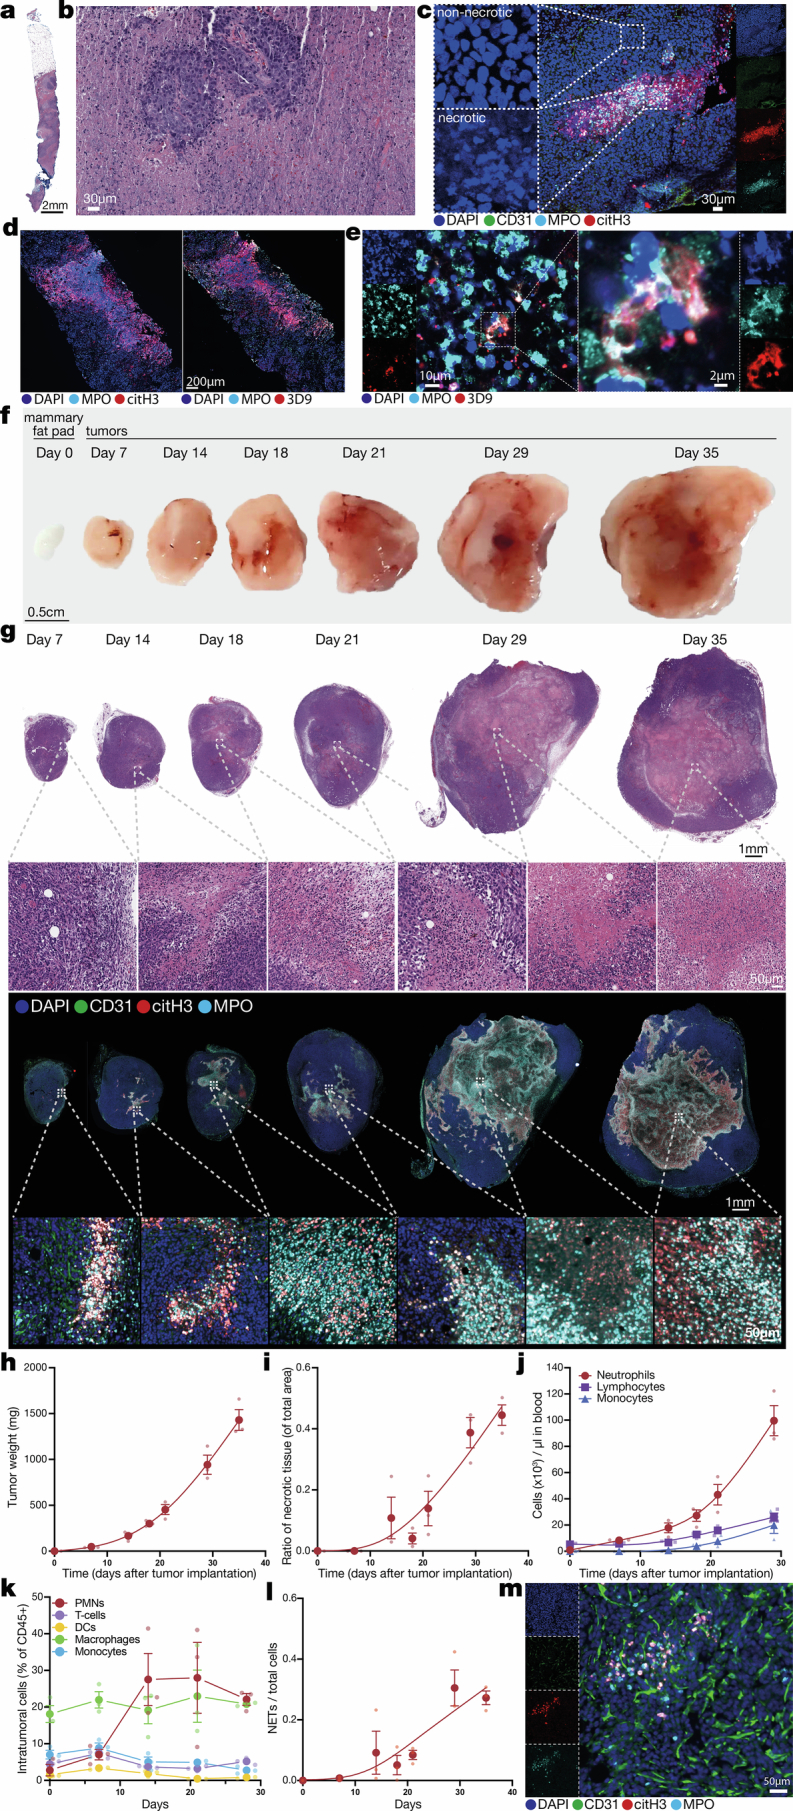
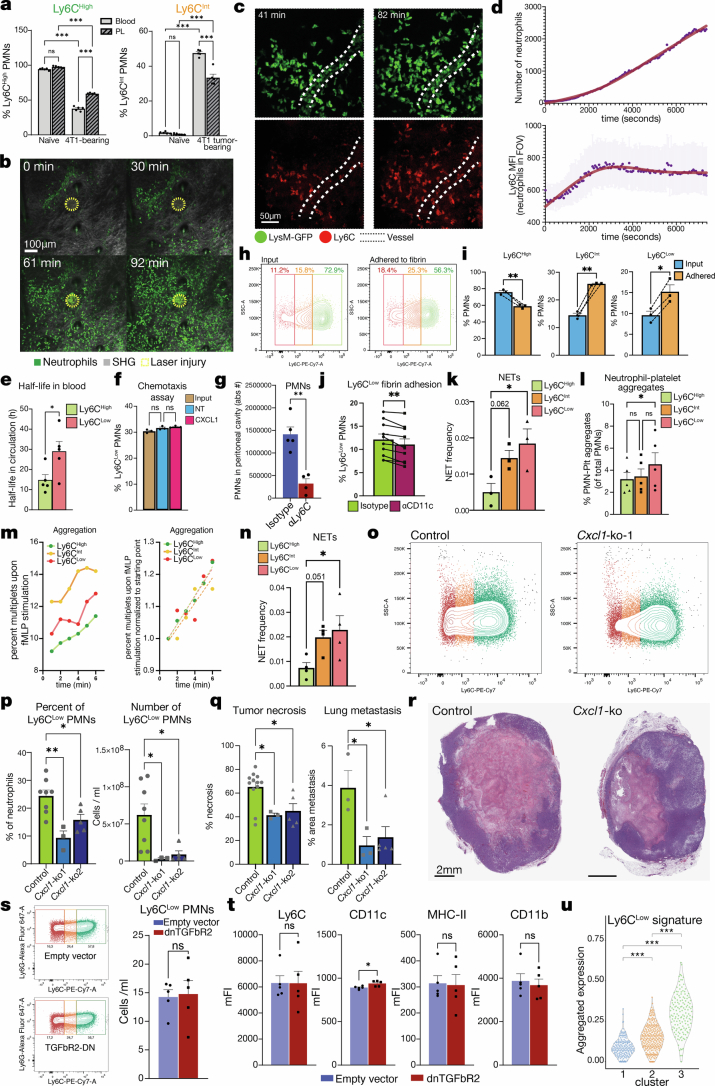
Tumour necrosis is associated with poor prognosis in cancer1,2 and is thought to occur passively when tumour growth outpaces nutrient supply. Here we report, however, that neutrophils actively induce tumour necrosis. In multiple cancer mouse models, we found a tumour-elicited Ly6GHighLy6CLow neutrophil population that was unable to extravasate in response to inflammatory challenges but formed neutrophil extracellular traps (NETs) more efficiently than classical Ly6GHighLy6CHigh neutrophils. The presence of these 'vascular-restricted' neutrophils correlated with the appearance of a 'pleomorphic' necrotic architecture in mice. In tumours with pleomorphic necrosis, we found intravascular aggregates of neutrophils and NETs that caused occlusion of the tumour vasculature, driving hypoxia and necrosis of downstream vascular beds. Furthermore, we found that cancer cells adjacent to these necrotic regions (that is, in 'perinecrotic' areas) underwent epithelial-to-mesenchymal transition, explaining the paradoxical metastasis-enhancing effect of tumour necrosis. Blocking NET formation genetically or pharmacologically reduced the extent of tumour necrosis and lung metastasis. Thus, by showing that NETs drive vascular occlusion, pleomorphic necrosis and metastasis, we demonstrate that tumour necrosis is not necessarily a passive byproduct of tumour growth and that it can be blocked to reduce metastatic spread.


Conflict of interest statement

Competing interests: M.E. holds shares in Agios. J.D.-P. is an employee of Xilis, Inc. W.J.H. reports patent royalties from Rodeo/Amgen; received research funding from Sanofi, NeoTX and Riboscience (to Johns Hopkins University); and speaking and/or travel honoraria from Exelixis and Standard BioTools. All other authors declare no competing interests.

Figures

Fig. 1
Fig. 1. Pleomorphic necrosis associates with intravascular neutrophil aggregates blocking blood flow.
a, Cleared 4T1 tumour showing the nuclear morphology of normal and necrotic regions: necrotic regions lack vasculature (CD31) and are enriched in neutrophils (MPO) and NETs (DAPI+, citH3+ and MPO+). Representative of n = 5 tumours. b, Tile scan of a 4T1 tumour showing the intricate pleomorphic architecture of neutrophil-rich and NET-rich (DAPI+, citH3+ and MPO+) necrotic tissue (left), and high magnification showing NETs (triple colocalization of DNA, MPO and citH3) in necrotic regions (right). Representative of n = 4 tumours. c, Quantification of intravascular NETs in necrotic or perinecrotic regions compared with non-necrotic regions in 4T1 tumours, normalized to the volume of vessels in each captured volume. n = 9 volumes from 5 tumours. P = 0.0022. d, Vessels adjacent to necrotic regions contain neutrophil aggregates (the dashed region magnified on the right) and NETs. Representative of n = 5 tumours. e, Representative view of perfused vessels (red, intravenous lectin) in regions adjacent to the necrotic tissue. The dashed region (zoomed in on the right) shows a vessel perfused until an intravascular neutrophil aggregate appears (arrowheads; arrows in the single channels below). Perfusion is lost downstream of the aggregate. Representative of n = 5 tumours. f, Extent of unperfused vasculature in the primary tumour correlates with the number of neutrophil aggregates in the vasculature. n = 12 volumes from 4 tumours. P < 0.0001. g, Micrograph showing intravascular accumulation of neutrophils (MPO) in the vasculature (CD31) of needle biopsies of primary tumours from patients with TNBC. Representative of n = 8 out of 20 total needle biopsies. h, Human TNBC pre-treatment needle biopsies show pleomorphic necrosis (by disrupted nuclear morphology; left) and extensive neutrophil infiltration (MPO) and NET formation (DAPI+, citH3+ and MPO+). Representative of n = 4 pleomorphic of 20 total needle biopsies. The bars show mean + s.e.m. **P < 0.01, as determined by unpaired, two-tailed Student’s t-test (c) or two-tailed Pearson correlation (f). The error bands show 95% confidence interval (f). Source Data
Fig. 2
Fig. 2. Perinecrotic cancer cells gain pro-metastatic traits.
a, Representative micrograph showing hypoxia in perinecrotic regions (hypoxyprobe) of 4T1 tumours. Representative of n = 4 tumors. b, Representative images of 4T1 tumours stained for E-cadherin and vimentin as markers of EMT in perinecrotic regions. Representative of n = 3 tumours. c,d, Quantification of the mean fluorescence intensity (MFI) of E-cadherin (c; P < 0.0001) and vimentin (d; P = 0.0001) in cells from the perinecrotic and non-perinecrotic regions of 4T1 tumours. n = 426 non-perinecrotic and 291 perinecrotic cells from 3 mice per group. eg, Representative images of LLC tumours stained for E-cadherin and vimentin (e), and quantification of E-cadherin (f; P < 0.0001) and vimentin (g; P < 0.0001) in cells from the perinecrotic and non-perinecrotic regions of LLC tumours. n = 2,186 non-perinecrotic and 1,739 perinecrotic cells from 3 mice per group. h, Gene Ontology (GO) term analysis of the genes upregulated in hypoxic cancer cells compared with non-hypoxic cells from patients with TNBC. dsRNA, double-stranded RNA. ik, Representative images of human TNBC tumours stained for E-cadherin and vimentin (i), and quantification of E-cadherin (j; P < 0.0001) and vimentin (k; P < 0.0001) in cells from the perinecrotic and non-perinecrotic regions of human TNBC tumours. n = 1,136 non-perinecrotic and 1,646 perinecrotic cells from 3 human samples. The bars show mean. ***P < 0.001, as determined by unpaired, two-tailed Student’s t-test (c,d,f,g,j,k) or Fisher’s cumulative hypergeometric probability with multiple testing correction (h). Source Data
Fig. 3
Fig. 3. Spatial mapping of transcriptional programs in perinecrotic tumour regions.
a, Haematoxylin and eosin (H&E) scans of 4T1 tumours subjected to spatial transcriptomics. Representative of n = 4. b, Necrotic (red), perinecrotic (orange) and non-necrotic (green) clusters based on the transcriptomic profile. c, Low-dimensional UMAP representation of the spatial clusters in the dataset. d, Overview of the genes differentially regulated in the different clusters. e, Representative spatial distribution of some of the genes differentially expressed in necrotic, perinecrotic and non-necrotic regions in 4T1 tumours (corresponding to tumour 2 in panel a). f, Gene Ontology terms enriched in the upregulated genes in perinecrotic clusters as compared with non-necrotic clusters showing terms related to hypoxia, EMT, metabolism and migration. g, Tumours expressing dominant-negative TGFβR2 (dnTGFβR2) show no difference in neutrophil counts in blood. n = 5 mice per group. EV, empty vector. h, Representative H&E images (left) and quantification (right) of necrosis in EV (control) or dnTGFβR2-expressing 4T1 tumours. n = 5 mice per group. i, Representative H&E images (left) and quantification (right) of metastatic spread to the lungs of EV (control) or dnTGFβR2 expressing 4T1 tumours. P = 0.0018. n = 9 mice per group. The bars show mean + s.e.m. **P <  0.01 and not significant (NS), as determined by unpaired, two-tailed Student’s t-test (gi) or Fisher’s cumulative hypergeometric probability with multiple testing correction (f). Source Data
Fig. 4
Fig. 4. Ly6CLow neutrophils form more NETs and are vascular restricted.
a, Ly6C in circulating neutrophils from naive, MMTV-PyMT, 4T1 or LLC tumour-bearing mice. b, Heatmap of genes differentially expressed in Ly6CLow versus Ly6CHigh neutrophils from 4T1 tumour-bearing mice; selected genes are noted on the right. c, Gene Ontology terms from genes downregulated in Ly6CLow neutrophils (the red text denotes pathways related to extravasation). PRR, pattern recognition receptor. d, Time course of Ly6CHigh/Int/Low neutrophil presence in circulation. n = 3 mice per timepoint. e, Ex vivo PMA-induced NET formation comparing Ly6CHigh and Ly6CLow neutrophils from the blood of 4T1 tumour-bearing mice; representative images (left; the arrows point to NETs) and quantification (right) are shown. n = 24 fields from 4 mice per condition. P = 0.9996 for Ly6CHigh-vehicle versus Ly6CHigh-PMA; P = 0.2780 for Ly6CHigh-vehicle versus Ly6CLow-vehicle; P = 0.0026 for Ly6CLow-vehicle versus Ly6CLow-PMA; and P < 0.0001 for Ly6CHigh-PMA versus Ly6CLow-PMA. f, Representative plots of neutrophils from the blood and peritoneal lavage of naive and 4T1 tumour-bearing mice with Zymosan-induced peritonitis, showing Ly6CLow neutrophils in 4T1 tumour-bearing mice (bottom row, red) present in blood (left) but not extravasating to the peritoneal cavity (right). g, Quantification of Ly6CLow neutrophils from panel f. n = 5 mice per group. P = 0.7159 for naive blood versus peritoneal lavage (PL); P < 0.0001 for 4T1 blood versus PL; P < 0.0001 for naive blood versus 4T1 blood; and P = 0.7040 for naive PL versus 4T1 PL. h, Neutrophil clusters from scRNA-seq data of patients with TNBC and their numbers in blood versus tumour tissue, showing a cluster (3) abundant in blood but not in tumour. i, Aggregated Ly6CLow neutrophil signature in clusters from panel h, showing enrichment in cluster 3. j, Aggregated ‘cell extravasation’ pathway genes in clusters from panel h; cluster 3 has the lowest expression of extravasation-related genes. P < 2.22 × 10−16 for 1 versus 2; P = 0.00067 for 1 versus 3; and P = 6.2 × 10−14 for 2 versus 3. The bars show mean + s.e.m. **P < 0.01 and ***P < 0.001, as determined by one-way analysis of variance (ANOVA) with Tukey’s test (e,g), Kruskal–Wallis test (j) or Fisher’s cumulative hypergeometric probability with multiple testing correction (c). Source Data
Fig. 5
Fig. 5. Pleomorphic necrosis formation is not passive and requires NET formation.
a, Representative images (left) of cleared LLC tumours from PAD4WT (able to form citrullinated NETs) and PAD4ΔN mice (unable to form citrullinated NETs), showing lack of citrullinated NETs (DAPI+, citH3+ and MPO+) and no loss of vasculature (CD31; quantified on the right) in neutrophil-rich (MPO) areas in tumours from PAD4ΔN compared with PAD4WT mice (the arrow points to neutrophil-rich, NET-rich, avascular necrotic region). n = 8 volumes from 4 mice per group. P = 0.0042. b, Examples of gross appearance of LLC tumours from PAD4WT and PAD4ΔN mice, showing that necrosis depends on NET formation. c, Representative midline sections of LLC tumours from PAD4WT or PAD4ΔN mice stained with H&E. d, Quantification of the necrotic area of the H&E-stained tissues. n = 8 PAD4WT and n = 9 PAD4ΔN mice. P = 0.0025. eg, Quantification of lung metastasis showing reduced metastatic area (e; P = 0.0095), absolute number of metastatic foci (f; P = 0.0144) and no differences in mean area of individual metastatic foci (g) in PAD4WT and PAD4ΔN LLC tumour-bearing mice. n = 19 mice per group. h, Representative H&E staining of the lungs quantified in panels eg. i, Heatmap (bottom left) of the genes upregulated in cancer cells from necrotic PAD4WT mice compared with non-necrotic PAD4ΔN mice and Gene Ontology terms analysis (right) of those genes, showing that cancer cells in necrotic tumours upregulate pathways related to haematopoiesis, EMT, metabolism, migration and necrosis. The bars show mean + s.e.m. *P < 0.05 and **P < 0.01, as determined by unpaired, two-tailed Student’s t-test (a,dg) or Fisher’s cumulative hypergeometric probability with multiple testing correction (i). Source Data
Extended Data Fig. 1
Extended Data Fig. 1. Tumor necrosis in human breast cancer and different cancer models.
a, Representative images (aI) of breast cancer patient MRI images with (top) or without (bottom) necrosis in the primary tumor, as determined based on the vascular contrast signal. The percentage of recurrence-free survival (aII, p = 0.012) and overall survival (aIII, p = 0.015) were higher in patients without necrosis, as was the incidence of axillary adenopathy (consistent with metastatic spread to local lymph nodes, aIV, p < 0.0001). The percentage of each molecular subtype for both categories is also shown (aV). b, Representative image of the accumulation of neutrophils (MPO, cyan) and the absence of vasculature (CD31, green) in necrotic regions (DAPI, nuclear morphology in blue, top right, non-necrotic; bottom right, necrotic) in cleared 4T1 tumors. Representative of N = 6 cleared tumors. c, Representative immunostaining (left) and quantification (right) showing neutrophils (MPO, cyan; non-necrotic vs peri-necrotic p = 0.0002, non-necrotic vs necrotic p < 0.0001, peri-necrotic vs necrotic p < 0.0001) and NETs (DAPI+, MPO+ blue, citH3+ red; non-necrotic vs peri-necrotic p = 0.25, non-necrotic vs necrotic p < 0.0001, peri-necrotic vs necrotic p < 0.0001) accumulate in necrotic regions in 4T1 tumors. N = 6 tumors. d, Representative imaging mass cytometry images of 4T1 tumors showing that necrosis-infiltrating cells (inside yellow dashed line) are bona fide neutrophils by markers. Representative of n = 16 regions from eight 4T1 tumors. e, High magnification image of DNA and NETs in necrotic regions of 4T1 tumors (another example shown in Fig. 1b, right). Representative of n = 4 tumors. f, LLC tumors show similar pleomorphic necrosis, neutrophil infiltration, and perfused/non-perfused vessels as 4T1 tumors. Representative of n = 3 cleared tumors. g, Representative view of perfused vessels (red, i.v. lectin) in a primary LLC tumor showing intravascular neutrophil aggregates (arrowheads, MPO) upstream of non-perfused vessels (CD31). Representative of n = 3 cleared tumors. h, H&E staining of C3(1)-Tag tumors showing the presence of pleomorphic necrosis in the primary tumor of this model. Representative of n = 5 mice. i, Micrograph of cleared C3(1)-Tag tumors showing neutrophils (MPO) forming aggregates in the vasculature (CD31). Representative of n = 5 cleared tumors. j, Micrograph of cleared C3(1)-Tag tumors showing neutrophil accumulation (MPO) in necrotic regions (nuclear morphology, right) devoid of vasculature (CD31). Representative of n = 5 cleared tumors. k, Representative cleared MMTV-PyMT tumor stained for vessels (CD31), neutrophils (MPO), and nuclei (DAPI), showing the presence of smaller, non-pleomorphic central necrotic cores with fewer infiltrating neutrophils and NETs (MPO+, citH3+). Representative of n = 3 cleared tumors. l, Representative images and m, quantification of the number of neutrophils (p <  0.0001) and NETs (p = 0.0003) in necrotic areas (yellow dashed line) in MMTV-PyMT and 4T1 tumors. N = 3 mice per group. n, Representative view of perfused vessels (red, i.v. lectin) in a primary 4T1 tumor. Dashed lines outline a vessel (CD31, green) perfused until an intravascular neutrophil aggregate appears (yellow arrowhead). Downstream of the aggregate, perfusion is lost. Representative of n = 5 tumors. o, Micrograph showing a hypoxic region (hypoxyprobe, green) around a vessel (CD31) containing a neutrophil aggregate (yellow arrowhead, MPO). Representative of n = 4 tumors. Error bars show mean + s.e.m. ***P < 0.001, ns, not significant, as determined by one-way ANOVA with Tukey’s multiple comparison test in (c) or unpaired two-tailed Student’s t-test (m). Survival curves analyzed using log-rank (Mantel-Cox) test in (aII-III). Axillary adenopathy data in aIV analyzed using Two-sided Fisher’s exact test. Source Data
Extended Data Fig. 2
Extended Data Fig. 2. 4T1 tumors over time.
a, Representative overview of a biopsy from a TNBC patient; pre-treatment needle biopsies were stained for H&E and show pleomorphic, necrotic architecture. Representative of n = 4 evident pleomorphic, necrotic samples from 20 total needle biopsies. b, Higher magnification of necrotic regions from the tumor shown in (a). c, Representative image of a necrotic region from a needle biopsy of a TNBC tumor, showing neutrophils and NETs accumulating in the necrotic regions (nuclear morphology in the left panels). Representative of n = 4 pleomorphic, necrotic biopsies. d, Sections from the same necrotic TNBC tumors stained for NETs using either the citH3/MPO/DNA (left) or 3D9 (right) methods. Representative of n = 3 needle biopsies. e, High magnification images of NETs stained with 3D9 antibody from the TNBC shown in (d). f, Representative gross appearance and g, H&E-stained (top) or immunostained (bottom) midline sections of 4T1 tumors at indicated times after tumor implantation, showing that pleomorphic necrosis is already extensive at day 14 after tumor implantation (with necrosis emerging as early as day 7). Representative of 3 mice per timepoint. h, Quantification of 4T1 tumor weight over time. N = 3 mice per timepoint. i, Ratio of necrotic to total tissue area in the 4T1 primary tumors over time, as quantified from H&E stainings. N = 3 mice per timepoint. j, Counts of neutrophils, lymphocytes, and monocytes in circulation in 4T1 tumor-bearing mice over time. Note that neutrophils change first and the most strongly in response to the presence of the primary tumor (day 8 represents an 8-fold increase over day 0), while monocytes and lymphocytes start increasing at much later timepoints (day 18 onwards). N = 3 mice per timepoint. k, Percentage of immune cells in 4T1 primary tumors over time (time 0 represents the percentage in naïve mammary fat pads). N = 3 mice per timepoint. DC, dendritic cell. l, Quantification of NETs in 4T1 tumors over time from immunofluorescence-stained tissue sections (as shown in b). N = 3 mice per timepoint (except N = 1 for mammary fat pad at time 0, as baseline reference). m, Representative image of 4T1 tumors 7 days after tumor implantation, showing the presence of NETs in areas not yet necrotic or avascular. Representative of n = 3 mice. Error bars show mean ± s.e.m. Source Data
Extended Data Fig. 3
Extended Data Fig. 3. Intraluminal extracellular matrix components and fibrin and platelet deposition correlate with neutrophils and necrosis in the primary tumor.
a, Representative image of intravascular laminin (i.v. injected anti-laminin antibody) deposition in the microvasculature (CD31) of 4T1 tumors. Neutrophils (MPO) interact with the intravascular laminin patches. Representative of n = 3 mice. b, Representative image (left) and quantification (right) showing that perivascular cell-poor (defined as perivascular αSMA+ cells, green) vessels (CD31, red) contain more luminally exposed laminin (i.v. injected anti-laminin antibody, cyan) than pericyte-covered vessels (vessels with high pericyte coverage). N = 6 volumes from 3 mice. p = 0.0454. c, Tumor regions surrounding necrosis also contain intravascular (i.v. lectin, red) deposits of fibrin in close association with neutrophils (MPO). Right panel: quantification of the neutrophil-fibrin distance compared to the distance to random intravascular points, showing that intravascular neutrophils are in close proximity to the fibrin deposits. N = 3 mice. d, NETs (citH3+, MPO+) are found in and around fibrin deposits in the tumor vasculature. Representative of n = 3 mice. e, Intravascular fibrin deposits colocalize with platelet aggregates near necrotic regions, whereas f, neither fibrin nor platelet deposits are found in non-necrotic tumor regions. Representative of n = 3 mice. g, Tile scan of a 4T1 tumor showing that necrotic regions (dashed areas) and surrounding regions contain fibrin and platelet deposits. Representative of n = 3 mice. h-i, Still images from real-time intravital imaging of the tumor microvasculature (lectin, cyan), showing neutrophils (LysM-GFP, green) and platelets (anti-CD41, red) forming intravascular aggregates in vivo in two independent tumor regions. Representative of n = 3 mice. j, Representative flow cytometry plots (left) and quantification (right) of neutrophils in our neutropenic mice (and Cre littermate controls). N = 4 controls and 3 neutropenic mice. P = 0.0011. k, Representative H&E stainings (left) and quantification (right) of the necrotic area in LLC tumors implanted into neutropenic mice or littermate controls. N = 4 control and 3 neutropenic mice. p = 0.0303. l, Number of circulating neutrophils and platelets in 4T1 tumor-bearing mice treated with dipyridamole or vehicle control. N = 3 mice per group. m, Number of circulating neutrophils and platelets in mice treated with tirofiban or vehicle control. N = 3 mice per group. n, Representative H&E stainings (left) and quantification (right) of the necrotic area in 4T1 tumors from mice treated with dipyridamole or tirofiban. N = 20 control-, 10 dipyridamole-, and 10 tirofiban-treated mice. Control vs Tirofiban p = 0.0358. Control vs Dipyridamole p = 0.6313. Bars show mean + s.e.m. *P < 0.05, **P < 0.01, ns, not significant, as determined by unpaired two-tailed Student’s t-test (b, j-m) or one-way ANOVA with Tukey’s multiple comparison test (n). Source Data
Extended Data Fig. 4
Extended Data Fig. 4. Hypoxic peri-necrotic regions induce pro-metastatic programs in tumor cells.
a, Illustration of the increased peri-necrotic area when necrotic regions are pleomorphic. A representative H&E image of a 4T1 tumor, showing a necrotic area (yellow dashed area) and an adjacent peri-necrotic area (blue dashed area). A circular region with an identical necrotic area (yellow circle, right), representing a non-pleomorphic, necrotic region) and its peri-necrotic area. The ratio of necrotic to peri-necrotic area is >3.4x higher in the pleomorphic case. b, Volcano plot (top) showing an overview of the genes upregulated in paired hypoxic cells (left) or normoxic cells (right) from 4T1 tumors by scRNA-seq and heatmap (bottom) of the genes upregulated in hypoxic 4T1 cancer cells compared to non-hypoxic cancer cells in the same tumors (with a list of selected genes). c, GO terms of the genes upregulated in hypoxic 4T1 cancer cells, including pathways related to hypoxia, EMT metabolism, and migration. d, Heatmap (bottom left) showing the genes upregulated in hypoxic C3(1)-Tag cancer cells (with a list of selected genes) compared to normoxic tumor cells (based on their expression of the “hypoxia response” pathway), and GO term analysis (right) of the pathways corresponding to the genes upregulated in hypoxic C3(1)-Tag cancer cells, showing pathways related to hypoxia (blue), metabolism (purple), migration (green), and EMT (red). e-f, Representative micrographs of two C3(1)-Tag tumors stained for E-cadherin (red) and vimentin (cyan). Representative of n = 3 mice. g, Quantification of E-cadherin (p < 0.0001) and h, quantification of vimentin (p < 0.0001) in cells from the peri-necrotic and non-peri-necrotic regions of C3(1)-Tag tumors. N = 1,687 non-peri-necrotic and 2,679 peri-necrotic cells from tumors from 3 mice per group. i-j, Two representative micrographs of needle biopsies from TNBC patients stained for E-cadherin and vimentin. Bars show mean. ***P < 0.001, as determined by unpaired two-tailed Student’s t-test (g, h), Wald test with Benjamini-Hochberg (BH) correction (b), or Fisher’s cumulative hypergeometric probability with multiple testing correction (c, d). Source Data
Extended Data Fig. 5
Extended Data Fig. 5. Characterization of peri-necrotic regions.
a, Representative micrograph of a 4T1 tumor stained for hypoxia (hypoxyprobe, red) and TGFβ, showing high TGFβ protein in the hypoxic, peri-necrotic regions. Insets: high magnification of nuclear staining to visualize necrotic (top) and non-necrotic (bottom) regions. Representative of n = 3 cleared tumors. b, Representative micrograph of a 4T1 tumor, showing high TGFβ protein present in the peri-necrotic regions adjacent to neutrophil-rich (MPO) necrotic areas. Representative of n = 3 tumors. c, Quantification of the mean fluorescence intensity (MFI) of TGFβ signal in cells in the peri-necrotic and non-peri-necrotic areas of 4T1 tumors. N = 590 non-peri-necrotic and 892 peri-necrotic cells from 3 mice. p < 0.0001. d, Representative micrograph of an LLC tumor showing high TGFβ protein present in the peri-necrotic regions adjacent to neutrophil-rich (MPO) necrotic areas. Representative of n = 3 tumors. e, Quantification of the TGFβ signal in cells in the peri-necrotic and non-peri-necrotic areas of LLC tumors. N = 4,126 non-peri-necrotic and 2,756 peri-necrotic cells from tumors from 3 mice. p < 0.0001. f, Representative micrograph of a C3(1)-Tag tumor showing high TGFβ protein present in the peri-necrotic regions adjacent to neutrophil-rich (MPO) necrotic areas. Representative of n = 3 mice. g, Quantification of the MFI of TGFβ signal in cells in peri-necrotic and non-peri-necrotic areas of C3(1)-Tag tumors. N = 546 non-peri-necrotic and 885 peri-necrotic cells from 3 mice. p < 0.0001. h, H&E stainings of two additional 4T1 tumors subjected to spatial transcriptomics (top, related to Fig. 3a). Necrotic (red), peri-necrotic (orange), and non-necrotic (green) clusters are based on their transcriptomic profile (bottom). i, Heatmap showing the expression of the combined top 15 differentially regulated genes of each cluster. j, Volcano plot showing genes differentially expressed between peri-necrotic (clusters 2 and 5) and non-necrotic (clusters 4, 3, and 6) tumor regions. k, Representative spatial distribution of selected differentially expressed genes in necrotic, peri-necrotic, and non-necrotic regions of 4T1 tumors (from tumor 2 shown in Fig. 3a). l, Spatial pathway analysis showing some pathways enriched in peri-necrotic regions. Bars show mean. ***P < 0.001, as determined by unpaired two-tailed Student’s t-test (c, e, g) or Wald test with Benjamini-Hochberg correction (j). Source Data
Extended Data Fig. 6
Extended Data Fig. 6. NSCLC spatial transcriptomics and TGF-β involvement.
a, H&E and MPO stainings of sections from the same human TNBC and mouse 4T1 tumors, showing that neutrophils (MPO) are highly enriched in necrotic areas. b, Examples of genes that show spatial correlation with neutrophils (neutrophils identified from dataset metadata; indicated as red dots in top-left panel) in an NSCLC spatial transcriptomics dataset. c, GO term analysis of the interaction changing genes (ICGs) in cancer cells that interact with neutrophils, showing terms related to hypoxia, EMT, metabolism, and migration. d, Representative image (left) and quantification (right) of E-cadherin (p < 0.0001) and vimentin (p = 0.0373) in peri-necrotic regions of dnTGFbR2 tumors, showing that these areas no longer show decreased E-cadherin and increased vimentin, consistent with a lack of EMT in these regions, when TGFβ signaling in cancer cells is disrupted. N = 3 mice. e, Representative images (left) and intensity quantification (right) of pSMAD2 in empty vector (control) or TGFbR2 dominant-negative 4T1 tumors. p < 0.0001. f, Numbers of monocytes and T-cells in the blood of mice bearing empty vector (control) or TGFbR2 dominant-negative 4T1 tumors. N = 5 mice per group. g, Representative images of dnTGFbR2 tumors, showing tumor necrosis, neutrophil infiltration, and NET formation. Representative of n = 3 mice. h, Quantification of the number of metastatic foci (p = 0.0004) and the average size of metastatic lesions (p = 0.9997) in the lungs of empty vector (control) or dnTGFbR2 4T1 tumors. N = 9 mice per group. i, TGFβ signaling pathway dominance (outgoing strength on x-axis) in different cell types by CITE-Seq analysis of 4T1 tumors. ILCs, innate lymphoid cells. NKTs, natural killer T-cells. j, Transcriptional production of key TGFβ signaling pathway members in different cell types by CITE-Seq data analysis of 4T1 tumors. NK cells, natural killer cells. k, Representative imaging mass cytometry images showing macrophages (CD68) are enriched around neutrophil-rich (Ly6G) necrotic regions. Representative of n = 16 regions from eight 4T1 tumors. Bars show mean + s.e.m. *P < 0.05, ***P < 0.001, ns, not significant, as determined by unpaired two-tailed Student’s t-test (d, e, f, h) or Fisher’s cumulative hypergeometric probability with multiple testing correction (c). Source Data
Extended Data Fig. 7
Extended Data Fig. 7. Tumor-induced hematopoietic changes.
a, Representative H&E image (left), immunofluorescence staining for neutrophils and NETs (center), and quantifications (right) of a MMTV-PyMT tumor implanted alone or in a mouse with a LLC tumor implanted in the contralateral flank, showing that the presence of a LLC tumor in the same host increases the amount of necrosis (p = 0.0442) and NETs (p = 0.0406) in MMTV-PyMT tumors of similar size (p = 0.3667). N = 3 mice per group. b, Top differentially expressed genes between 4T1 (forming pleomorphic necrosis) and MMTV-PyMT (not forming pleomorphic necrosis) cancer cells. c, Reactome pathway analysis of the genes differentially regulated in 4T1 and MMTV-PyMT cancer cells, which includes pathways related to hypoxia (red text). d, Aggregated expression of pathways regulating hematopoiesis (top), hypoxia response (center), and neutrophil-mediated immunity (bottom) in 4T1 and MMTV-PyMT cancer cells. e, Representative gross anatomical view of the bone marrow from naïve mice or mice bearing 4T1 (top) or LLC (bottom) tumors, showing a distinct pale white appearance of the bone marrow of the tumor-bearing mice 4 weeks after tumor implantation. f, Simplified schematic representation of the hematopoietic system showing the main populations. LT-HSCs (long term-hematopoietic stem cells). ST-HSCs (short term-hematopoietic stem cells). CMPs (common myeloid progenitors). CLPs (common lymphoid progenitors). MPPs (multipotent progenitors). MEPs (megakaryocyte, erythrocyte progenitors). GMPs (granulocyte-monocyte progenitors). NK (natural killer cells). RBCs (red blood cells, erythrocytes). Baso/Eo (basophils, eosinophils). g, Dimensionality reduction (left) and quantification (right) of LSKs, GMPs, and MEPs (gating strategy in panel h) in the bone marrow of 4T1, LLC, and MMTV-PyMT tumor-bearing mice and naïve controls, showing a myeloid skew in 4T1 and LLC mice. N = 5 (4T1, MMTV-PyMT) or 4 (LLC) mice per group. 4T1: LSKs p = 0.0254, GMPs p = 0.0048, MEPs p = 0.0093. LLC: LSKs p = 0.002, GMPs p = 0.0003, MEPs p = 0.0009. PyMT: LSKs p = 0.7513, GMPs p = 0.1005, MEPs p = 0.4827. h, Gating strategy for the cytometric analysis of HSPCs. i, Quantification of LSKs and GMPs in the spleen of 4T1 (LSK p = 0.0017, GMPs p = 0.0031), LLC (LSK p = 0.0783, GMPs p = 0.0219), and MMTV-PyMT (LSK p = 0.1274, GMPs p = 0.1124) tumor-bearing mice. N = 5 (4T1 and MMTV-PyMT) or 4 (LLC) mice per group. Bars show mean + s.e.m. *P < 0.05, **P < 0.01, ***P < 0.001, ns, not significant, as determined by unpaired two-tailed Student’s t-test (a, g, i), binomial test with Benjamini-Hochberg multiple testing correction (c), or Wilcoxon rank sum test (d). Source Data
Extended Data Fig. 8
Extended Data Fig. 8. The primary tumor induces a myeloid skew in the hematopoietic compartment.
a, Dimensionality reduction (left) and quantification (right) of mature immune cells in the bone marrow, blood, spleen, and lung of naïve and 4T1 tumor-bearing mice, showing a myeloid expansion and low-dimensionality position switch for neutrophils. N = 5 mice per group. Bone marrow: Neutrophils p = 0.0177, Monocytes p = 0.0628, T-cells p = 0.0029. Blood: Neutrophils p = 0.0124, Monocytes p = 0.0007, T-cells p = 0.0143. Spleen: Neutrophils p = <0.0001, Monocytes p = 0.0003, T-cells p = 0.0011. Lung: Neutrophils p = 0.0044, Monocytes p = 0.0158, T-cells p = 0.8036. b, Low-dimensional representation of mature T-cells, neutrophils, and monocytes in the bone marrow (BM), blood, lung, and spleen of naïve and tumor-bearing LLC mice. N = 4 mice per group. c, Quantification of mature T-cells, neutrophils (PMNs), and monocytes in the bone marrow, blood, lung, and spleen of naïve and tumor-bearing LLC mice. N = 4 mice per group. Bone marrow: Neutrophils p = 0.0044, Monocytes p = 0.7725, T-cells p = 0.0183. Blood: Neutrophils p = 0.0001, Monocytes p = 0.0001, T-cells p = 0.0066. Lung: Neutrophils p < 0.0001, Monocytes p = 0.8447, T-cells p = 0.0910. Spleen: Neutrophils p = 0.0137, Monocytes p = 0.0093, T-cells p = 0.0010. d, Low-dimensional representation of mature T-cells, neutrophils, and monocytes in the bone marrow, blood, lung, and spleen of naïve and tumor-bearing MMTV-PyMT mice. N = 5 mice per group. e, Quantification of mature T-cells, neutrophils (PMNs), and monocytes in the bone marrow, blood, lung, and spleen of naïve and tumor-bearing MMTV-PyMT mice. N = 5 mice per group. Bone marrow: Neutrophils p = 0.0061, Monocytes p = 0.0534, T-cells p = 0.0150. Blood: Neutrophils p = 0.0173, Monocytes p = 0.0477, T-cells p = 0.0811. Lung: Neutrophils p = 0.0721, Monocytes p = 0.4823, T-cells p = 0.3911. Spleen: Neutrophils p = 0.0193, Monocytes p = 0.0312, T-cells p = 0.0731. Bars show mean + s.e.m. *P < 0.05, **P < 0.01, ***P < 0.001, ns, not significant, as determined by unpaired two-tailed Student’s t-test (a, c, e). Source Data
Extended Data Fig. 9
Extended Data Fig. 9. Primary tumor-hematopoiesis interplay.
a, Cxcl1-deficient 4T1 cells show minimal expression of CXCL1 in the supernatants, as determined by ELISA (right, showing mutants generated with 2 independent sgRNA constructs). b, Low-dimensional projection of mature T-cells, neutrophils (PMNs), and monocytes in circulation of mice bearing control or Cxcl1-deficient 4T1 tumor cells (left). Neutrophils and monocytes are significantly reduced in these mice (center graphs), indicating a reduced myeloid output from the bone marrow consistent with reduced number of GMPs in the bone marrow (right). N = 8 control, 3 Cxcl1-KO1 (sgRNA 1), and 5 Cxcl1-KO2 (sgRNA 2) mice for neutrophil and monocyte quantification; N = 5 mice per group for GMP quantification. Neutrophils: control vs KO-1 p = 0.0143, control vs KO-2 p = 0.0104. Monocytes: control vs KO-1 p = 0.0103, control vs KO-2 p = 0.0071. GMPs: control vs KO-1 p = 0.0053, control vs KO-2 p = 0.0145. c, Number of GMPs and neutrophils after 11 days of culturing purified hematopoietic stem and progenitor cells in vitro with CXCL1. NT, non treated (media only). N = 5. GMPs p = 0.0001, Neutrophils p < 0.0001. d, Metaclusters of the FlowSOM unbiased cytometric analyses of 4T1 tumor-bearing blood populations, showing neutrophil metaclusters 2, 3, 5, and 6 expressing varying levels of different markers, including Ly6C and CD11c. N = 5 mice per group. e, Overview of the metacluster marker expression from the data shown in (d). f, Metacluster abundance comparing tumor-bearing and naïve mice, showing that in naïve mice, only neutrophil cluster 2 (from panel e and g) is present. g, Clustering of flow cytometric data of blood cells from 4T1 tumor-bearing mice, showing 4 neutrophil clusters (2, 3, 5, and 6) with phenotypical differences in several markers (right), including Ly6C and CD11c. N = 5 mice. h, Clustering of flow cytometric data of blood cells from Cxcl1-knockout 4T1 tumor-bearing mice, showing only one neutrophil cluster (1, left) with minor phenotypical variation (right), suggesting that neutrophil heterogeneity is reduced when cancer cells do not express Cxcl1 (compare with panel g). N = 5×10⁵ cells from N = 8 mice. i, Backgating for the Ly6CLow neutrophil gate. j, Volcano plot showing some of the genes overrepresented in Ly6CHigh (left) or Ly6CLow (right) neutrophils. k, GO terms analysis of the differentially expressed genes downregulated in Ly6CLow neutrophils, highlighting terms related to migration and extravasation (red text). l, Cytometric analysis of selected surface markers on Ly6CHigh, Ly6CInt, and Ly6CLow neutrophils. N = 5 mice except for ICAM1, where N = 3. CD62L: Hi vs Int p = 0.0012, Int vs Lo p = 0.2626, Hi vs Lo p = 0.0036. SiglecF: Hi vs Int p = 0.0001, Int vs Lo p = 0.0031, Hi vs Lo p = 0.0001. CXCR2: Hi vs Int p = 0.0001, Int vs Lo p = 0.0023, Hi vs Lo p = 0.0002. CD11b: Hi vs Int p = 0.0750, Int vs Lo p = 0.3596, Hi vs Lo p = 0.1205. CXCR4: Hi vs Int p < 0.0001, Int vs Lo p = 0.3407, Hi vs Lo p = 0.0001. ICAM1: Hi vs Int p = 0.0468, Int vs Lo p = 0.0421, Hi vs Lo p = 0.0437. CD11c: Hi vs Int p = 0.0035, Int vs Lo p = 0.0014, Hi vs Lo p = 0.0023. m, Representative images (left) and quantification of the number of nuclear lobes of sorted Ly6CHigh and Ly6CLow neutrophils from the blood of 4T1 tumor-bearing mice, showing no differences in nuclear morphology. N = 41 Ly6CHigh and 36 Ly6cLow neutrophils. n, Representative cytometric plot showing the levels of CD101 in Ly6CHigh/Int/Low neutrophils from the blood of 4T1 tumor-bearing mice and o, quantification of the percentage of immature CD101Low neutrophils in each category. N = 4 mice. Hi vs Int p = 0.0866, Int vs Lo p = 0.0044, Hi vs Lo p = 0.0026. p, In vivo phagocytosis assay showing no differences in the phagocytosis potential of the different neutrophil populations by flow cytometry in the blood of 4T1 tumor-bearing mice. N = 5 mice. q, Representative histogram (left) and quantification (right) of ROS (dihydroethidium, DHE) production by Ly6CHigh/Int/Low neutrophils, showing no basal differences in ROS content between the populations, as determined by flow cytometry. N = 5 mice. r, Representative flow cytometry plot (left) and quantification (right) of the dcTRAIL-R1 signal in circulating neutrophils, showing very few positive circulating neutrophils regardless of Ly6C status. N = 3 mice per group. Hi vs Int p = 0.1995, Int vs Lo p = 0.4578, Hi vs Lo p = 0.0402. Bars show mean + s.e.m. *P < 0.05, **P < 0.01, ***P < 0.001, ns, not significant, as determined by paired two-tailed Student’s t-test (c), one-way ANOVA with Geisser-Greenhouse or Tukey’s multiple comparison test (b, l, o-r), Wald test with Benjamini-Hochberg correction (j) or Fisher’s cumulative hypergeometric probability with multiple testing correction in (k). Source Data
Extended Data Fig. 10
Extended Data Fig. 10. Characterization of vascular-restricted neutrophils.
a, Quantification of Ly6CHigh/Int neutrophils in blood and peritoneal lavage of naïve and 4T1 tumor-bearing mice subjected to Zymosan-induced peritonitis. N = 5 mice per group. b, Still captures of neutrophils infiltrating the dermis during the experimental laser injury model (dashed circle: injury area), showing the dynamics of neutrophil infiltration over time. SHG, second harmonic generation. c, Representative still images of neutrophils from 4T1 tumor-bearing LysM-GFP mice intravascularly stained for Ly6C infiltrating the dermis in a laser injury experiment, showing that extravasating neutrophils have higher Ly6C signal than neutrophils inside the vasculature. Representative of n = 3 mice. d, Quantification of the number (top) and mean per-cell fluorescence intensity of Ly6C (bottom) in neutrophils infiltrating the dermis over time, showing that neutrophils infiltrating the tissue harbor higher Ly6C signal than neutrophils at early timepoints (mostly vascular), indicating that extravasating neutrophils have higher Ly6C expression. Representative of n = 3 mice. e, Quantification of neutrophil half-life in circulation. N = 5 mice. p = 0.0398. f, Proportion of Ly6CLow neutrophils in the starting population (input) and among the cells migrating spontaneously (not treated, NT) or towards CXCL1 in a chemotaxis assay. N = 3 mice. g, Absolute number (abs #) of neutrophils extravasated to the peritoneal cavity after Zymosan-induced peritonitis in mice treated with anti-Ly6C or isotype control antibodies. N = 5 isotype- and 4 αLy6C-treated mice. p = 0.0012. h, Representative flow cytometry plots and i, quantification of the proportion of the Ly6CLow (p = 0.0197), Ly6CInt (p = 0.0076), and Ly6CHigh (p = 0.0011) neutrophil populations after isolation from blood (input) and adhesion to fibrin, showing that Ly6CLow and Ly6CInt neutrophils adhere to fibrin better than Ly6CHigh neutrophils. N = 3 mice. j, Quantification of the adhesion to fibrin of Ly6CLow neutrophils pretreated with antibodies against CD11c. Neutrophils isolated from the blood of n = 10 mice. p = 0.0010. k, NET formation frequency of neutrophils attached to fibrin-coated slides and stimulated with PMA. N = 3 mice. Hi vs Int p = 0.0628, Hi vs Lo p = 0.0347. l, Quantification of neutrophil-platelet aggregates in the blood of 4T1 tumor-bearing mice. N = 5 mice. Hi vs Int p = 0.8602, Int vs Lo p = 0.1032, Hi vs Lo p = 0.0475. m, Percentage of multiplets (left) and normalized values (to better visualize rate of change, right) over time upon fMLP stimulation of sorted neutrophils. n, NET formation frequency of neutrophils attached to poly-L-Lysine-coated slides and stimulated with PMA. N = 4 mice. Hi vs Int p = 0.0514, Hi vs Low p = 0.0417. o, Representative flow cytometry plots and p, quantification of the number and percentage of Ly6CLow neutrophils in Cxcl1-knockout 4T1 tumors compared to control, showing that cancer cell-produced CXCL1 is at least partially responsible for the systemic increase of Ly6CLow neutrophils. N = 8 control, 3 Cxcl1-ko1, and 5 Cxcl1-ko2 tumor-bearing mice. Percent: Control vs. ko-1 p = 0.0022. Control vs. ko-2 p = 0.0276; Number: Control vs. ko-1 p = 0.0288. Control vs. ko-2 p = 0.0203. q, Quantification of tumor necrosis (Control vs. ko-1 p = 0.0278. Control vs. ko-2 p = 0.0228) and lung metastasis (Control vs. ko-1 p = 0.0296. Control vs. ko-2 p = 0.0356) and r, representative images of tumor necrosis in Cxcl1-knockout 4T1 tumors compared to controls, showing reduced necrosis in Cxcl1-deficient tumors. N = 12 control, 3 Cxcl1-ko1, and 5 Cxcl1-ko2 mice for tumor necrosis, and N = 3 control and Cxcl1-ko mice and 5 Cxcl1-ko2 mice for lung metastasis. s, Representative flow cytometry plots (left) and quantification (right) of the number of Ly6CLow neutrophils in dnTGFbR2 tumor-bearing mice, showing that TGFβ signaling in cancer cells is not required for the appearance of Ly6CLow neutrophils. N = 5 mice per group. t, Quantification of several phenotypic markers in circulating neutrophils, showing that the neutrophil phenotypes in dnTGFbR2 tumor-bearing mice are similar to those in control mice. N = 5 mice per group. CD11c p = 0.0179. u, Ly6CLow neutrophil signature violin plots of human TNBC neutrophils, showing that cluster 3 had the highest overlap with the Ly6CLow transcriptomic signature. For all comparisons, p < 2.22E-16. Bars show mean + s.e.m. *P < 0.05, **P < 0.01, ***P < 0.001, ns, not significant, as determined by unpaired two-tailed Student’s t-test in (e, g, s, t), paired two-tailed Student’s t-test (i, j), one-way ANOVA with Geisser-Greenhouse or Tukey’s multiple comparison test in (a, f, k, l, n, p, q), or Kruskal-Wallis test in (u). Source Data
Extended Data Fig. 11
Extended Data Fig. 11. scRNA-seq analysis of TNBC patient blood and NET blockade.
a, Differentially expressed genes of the clusters shown in Fig. 4h (human TNBC scRNA-seq), showing the genes upregulated and downregulated in Cluster 3, with selected genes noted to the right. b, GO terms of the genes upregulated in cluster 3, as shown in Fig. 4h. c, LLC tumor growth over time in PAD4ΔN and PAD4WT mice. Line shows the non-linear least squares fit of the data. N = 5 mice per group. p = 0.048. d, Quantification of circulating immune cells in PAD4ΔN and PAD4WT mice 4 weeks after tumor implantation. N = 5 mice per group. e, Quantification of NETs (DAPI+, citH3+, MPO+) in tumors from PAD4ΔN and PAD4WT mice. N = 8 cleared tumor volumes from 4 mice per group. p < 0.0001. f, H&E staining of the lungs of PAD4ΔN and PAD4WT mice 2 weeks after i.v. injection of 5×10⁵ LLC cells (experimental metastasis model) and, g, quantification of the metastatic area, h, number of metastatic foci, and i, mean area of metastatic foci in the lungs of PAD4ΔN and PAD4WT mice subjected to experimental metastasis. N = 8 PAD4WT and 7 PAD4ΔN mice. j, Representative micrograph of an LLC tumor 4 weeks after injection into PAD4WT or k, PAD4ΔN mice and stained for E-cadherin and vimentin. Representative of n = 3 mice per group. l, Quantification of circulating immune cells in mice treated with DNase I or vehicle. N = 4 mice per group. Neutrophils p = 0.0005, Monocytes p = 0.0149, % Ly6cLow p = 0.1003. m, Representative H&E images (left) and quantification of necrosis (right) showing that daily treatment with DNase I reduced 4T1 tumor necrosis (yellow dashed line). N = 10 mice per group. p = 0.0372. n, Representative H&E staining and o, quantification of metastasis as percentage of total lung area of 4T1 tumor-bearing mice treated with DNase I or vehicle control. N = 9 control and 10 DNase I treated mice. p = 0.0441. Bars show mean + s.e.m. *P < 0.05, ***P < 0.001, as determined by unpaired two-tailed Student’s t-test in (d, e, g, h, i, l, m, o) or two-way ANOVA in (c). P-value in (b) calculated using a Fisher’s cumulative hypergeometric probability with multiple testing correction (using gProfiler). Source Data
Extended Data Fig. 12
Extended Data Fig. 12. NET blockade reduces necrosis in the primary tumor.
a, 4T1 tumor growth over time in wild-type BALB/c mice fed a control or disulfiram-containing diet from the moment of tumor implantation. Line shows the non-linear least squares fit of the data. N = 5 control diet mice and 9 disulfiram diet mice. p = 0.085. b, Representative micrographs showing that disulfiram treatment reduced the number of NETs formed in the tumors. c, Quantification of NETs in the cleared tumors from 4T1 tumor-bearing mice fed a control or disulfiram-containing diet (CTRL or DS, respectively), showing disulfiram reduces NET formation in the tumors. N = 6 volumes from 3 tumors per group. p = 0.0006. d, Quantification of circulating immune cells in 4T1-tumor bearing mice fed a control or disulfiram-containing diet (CTRL or DS, respectively), 6 weeks after tumor implantation. N = 5 mice per group. Neutrophils p = 0.0147. Monocytes p = 0.0296. e, Disulfiram treatment does not affect HSPCs in the bone marrow of 4T1 tumor-bearing mice. N = 5 mice per group. LKSs (Lineage-, cKit+, Sca1+). LT-HSCs (long term-hematopoietic stem cells). ST-HSCs (short term-hematopoietic stem cells). MPPs (multipotent progenitors). MPs (myeloid progenitors). CMPs (common myeloid progenitors). GMPs (granulocyte-monocyte progenitors). MEPs (megakaryocyte, erythrocyte progenitors). f, Representative H&E staining of midline tumor section used for the quantification (shown in panel f) of the response to pharmacological inhibition of NET formation using disulfiram in 4T1 mice (yellow dashed line outlines necrotic area). g, Quantification of the extent of necrotic tissue in 4T1 tumors from mice given disulfiram or control diets, showing that blocking NETs pharmacologically reduces necrosis. N = 8 mice per group. p = 0.0396. h-i, Representative micrograph of a 4T1 tumor after 6 weeks of growth in mice fed h, a control diet or i, a disulfiram diet and stained for E-cadherin (red) and vimentin (cyan). N = 3 mice per group. j, Representative images of H&E-stained sections of lungs from disulfiram or control diet, 4T1 tumor-bearing mice 6 weeks after tumor implantation. Representative of n = 11 mice per group. k, Quantification showing reduced metastatic area (p = 0.0476) and l, absolute number of metastatic foci (p = 0.0111), with m, no differences in the average area of individual metastatic foci (p = 0.4074) in the lungs of disulfiram-treated mice. N = 11 mice per group. n, Graphical abstract. The primary tumor, in part through CXCL1 expression (1), drives an expansion and a myeloid skew of the hematopoietic compartment and gives rise to a “vascular-restricted” neutrophil population (2) defined by a specific transcriptomic profile (of which Ly6CLow or CD11cHigh are mouse markers), that is inefficient in extravasation and has increased NET formation capacity. This increased neutrophil output from the bone marrow eventually reaches the tumor, where it encounters a poorly organized vascular network (with abnormal pericyte coverage and intraluminal exposition of extracellular matrix proteins), where neutrophils deploy NETs and aggregate (3). This, in turn, restricts the blood flow and causes necrosis of the downstream vascular bed, giving rise to a spatially distinct form of necrosis that we termed “pleomorphic necrosis”, which is different from the classical/central core necrosis (4). In the regions adjacent to overt necrosis (i.e., the peri-necrotic regions), the tumor cells are subjected to hypoxic conditions. Cancer cells in peri-necrotic regions respond by engaging transcriptomic programs that enhance their migratory and invasion potentials, driving an EMT phenotype, leading to increased metastasis (5). Bars show mean + s.e.m. *P < 0.05, ***P < 0.001, ns, not significant, as determined by two-way ANOVA (a) or unpaired two-tailed Student’s t-test (c, d, e, g, k-m). Source Data

References

    1. Richards, C. H., Mohammed, Z., Qayyum, T., Horgan, P. G. & McMillan, D. C. The prognostic value of histological tumor necrosis in solid organ malignant disease: a systematic review. Future Oncol.7, 1223–1235 (2011). - PubMed
    1. Caruso, R. et al. Histologic coagulative tumour necrosis as a prognostic indicator of aggressiveness in renal, lung, thyroid and colorectal carcinomas: a brief review. Oncol. Lett.3, 16–18 (2012). - PMC - PubMed
    1. Rabas, N., Ferreira, R. M. M., Di Blasio, S. & Malanchi, I. Cancer-induced systemic pre-conditioning of distant organs: building a niche for metastatic cells. Nat. Rev. Cancer24, 829–849 (2024). - PubMed
    1. Engblom, C. et al. Osteoblasts remotely supply lung tumors with cancer-promoting SiglecFhigh neutrophils. Science358, eaal5081 (2017). - PMC - PubMed
    1. Bao, Y. et al. Extramedullary hematopoiesis secondary to malignant solid tumors: a case report and literature review. Cancer Manag. Res.10, 1461–1470 (2018). - PMC - PubMed

MeSH terms

LinkOut - more resources