. 2025 Sep;645(8081):722-728.
doi: 10.1038/s41586-025-09261-y. Epub 2025 Jul 16.

Mitochondrial origins of the pressure to sleep

Affiliations

Mitochondrial origins of the pressure to sleep

Raffaele Sarnataro et al. Nature. 2025 Sep.

Abstract

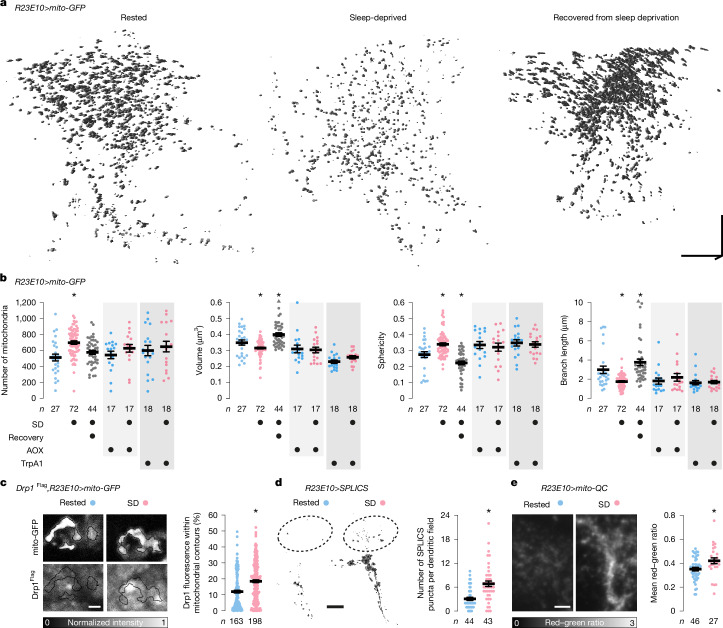
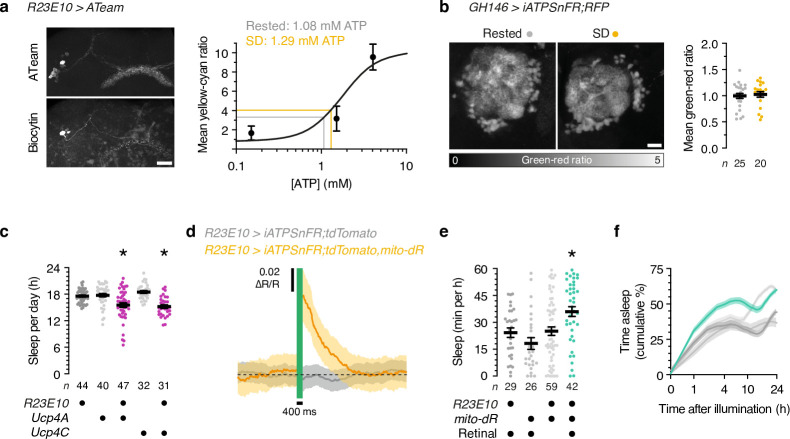
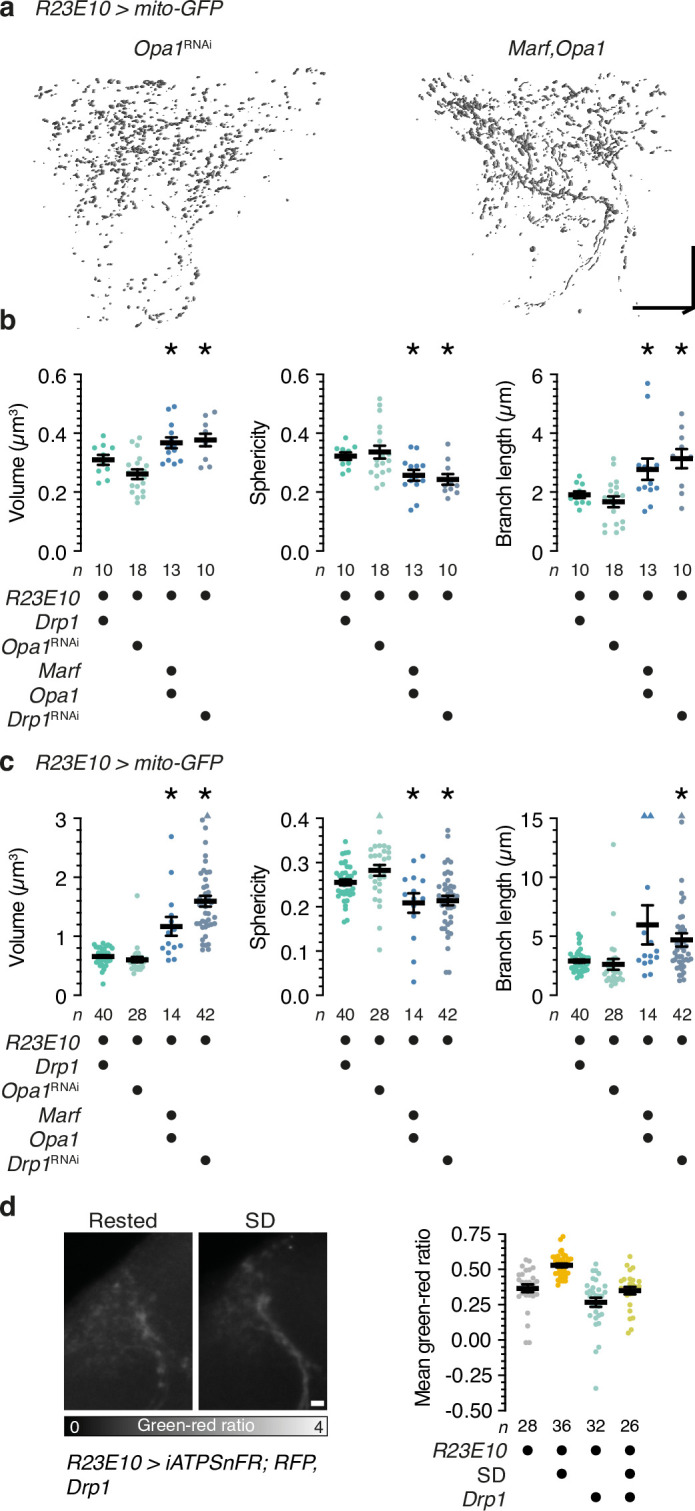
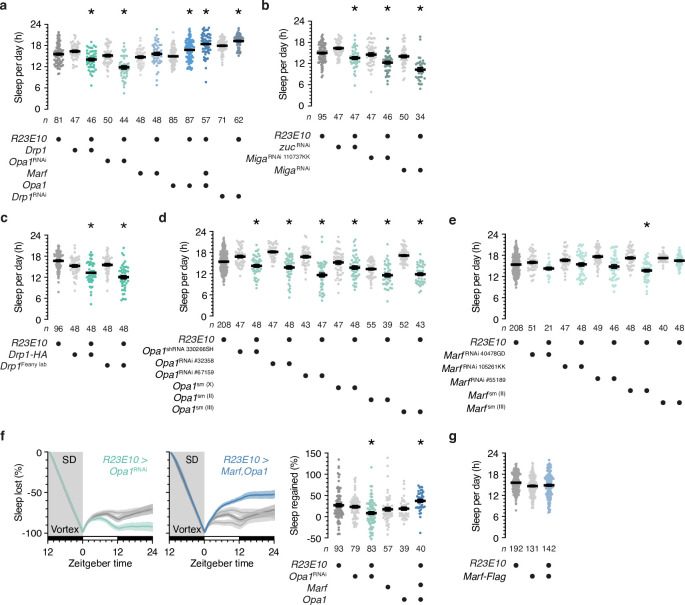
To gain a comprehensive, unbiased perspective on molecular changes in the brain that may underlie the need for sleep, we have characterized the transcriptomes of single cells isolated from rested and sleep-deprived flies. Here we report that transcripts upregulated after sleep deprivation, in sleep-control neurons projecting to the dorsal fan-shaped body1,2 (dFBNs) but not ubiquitously in the brain, encode almost exclusively proteins with roles in mitochondrial respiration and ATP synthesis. These gene expression changes are accompanied by mitochondrial fragmentation, enhanced mitophagy and an increase in the number of contacts between mitochondria and the endoplasmic reticulum, creating conduits3,4 for the replenishment of peroxidized lipids5. The morphological changes are reversible after recovery sleep and blunted by the installation of an electron overflow6,7 in the respiratory chain. Inducing or preventing mitochondrial fission or fusion8-13 in dFBNs alters sleep and the electrical properties of sleep-control cells in opposite directions: hyperfused mitochondria increase, whereas fragmented mitochondria decrease, neuronal excitability and sleep. ATP concentrations in dFBNs rise after enforced waking because of diminished ATP consumption during the arousal-mediated inhibition of these neurons14, which augments their mitochondrial electron leak7. Consistent with this view, uncoupling electron flux from ATP synthesis15 relieves the pressure to sleep, while exacerbating mismatches between electron supply and ATP demand (by powering ATP synthesis with a light-driven proton pump16) precipitates sleep. Sleep, like ageing17,18, may be an inescapable consequence of aerobic metabolism.


Conflict of interest statement

Competing interests: The other authors declare no competing interests.

Figures

Fig. 1
Fig. 1. The transcriptional response of dFBNs to sleep deprivation.
a, Uniform manifold approximation and projection (UMAP) representation of glutamatergic neurons (grey) according to their gene expression profiles. dFBNs (purple) form a distinct cluster containing cells from rested (blue, n = 237 cells) and sleep-deprived brains (red, n = 86 cells). b, log-normalized expression levels of dFBN markers. c, Volcano plot of sleep history-dependent gene expression changes in dFBNs. Signals with Bonferroni-corrected P < 0.05 (two-sided Wilcoxon rank-sum test) are indicated in black; labels identify protein products localized to synapses or mitochondria; colours denote subunits of mitochondrial respiratory complexes. The P value of unc-13 exceeds the y-axis limit and is plotted at the top of the graph. d, Enrichment of the top ten downregulated (left) and upregulated (right) ‘biological process’ gene ontology terms in the set of differentially expressed dFBN genes. Source data
Fig. 2
Fig. 2. A mitochondrial electron surplus induces sleep.
a, Proton-pumping complexes I, III and IV convert the energy of electron transfers from NADH to O2—through intermediates CoQ and cytochrome c (cyt c)—into a proton electrochemical gradient, ∆p, across the IMM. Ucp4 discharges, whereas illumination (hν) of mito-dR charges, the IMM. The return of extruded protons to the matrix spins the blades of the ATP synthase and produces ATP, which leaves the matrix via sesB in exchange for cytoplasmic ADP. Neuronal ATP consumption is activity-dependent, in part because the plasma membrane Na+–K+ ATPase must restore ion gradients dissipated by action and excitatory synaptic currents. An oversupply (relative to ATP demand) of electrons to CoQ increases the risk of single-electron reductions of O2 to O2 at complexes I and III. AOX mitigates this risk. b,c, Summed-intensity projections of dFBN dendrites expressing iATPSnFR plus RFP (b) or ATeam (c), in rested and sleep-deprived (SD) flies. Emission ratios are intensity-coded according to the keys below and increase after sleep deprivation (P < 0.0001 (b) and P = 0.0003 (c); two-sided Mann–Whitney test). d, Arousing heat elevates ATP in dFBNs expressing iATPSnFR plus tdTomato. Mean fluorescence was quantified in 20-s windows immediately before and after stimulation (P = 0.0152, two-sided paired t-test) and is plotted as a change in fluorescence intensity ratio (∆R/R) with co-expressed tdTomato relative to pre-stimulation baseline. e, Optogenetic stimulation dissipates ATP in dFBNs expressing iATPSnFR and CsChrimson, but not in dFBNs lacking CsChrimson (P = 0.0076, two-sided t-test). ∆F/F is the change in fluorescence intensity relative to pre-stimulation baseline. f, Sleep in flies expressing R23E10VGlut-GAL4-driven Ucp4A or Ucp4C and parental controls (P ≤ 0.0381, Holm–Šídák test after analysis of variance (ANOVA)). g,h, Sleep during the first 60 min after illumination (g; P ≤ 0.0432, Dunn’s test after Kruskal–Wallis ANOVA) and cumulative sleep percentages in flies expressing R23E10VGlut-GAL4-driven mito-dR, with or without retinal, and parental controls (h; ∆p photogeneration effect: P < 0.0001, time × ∆p photogeneration interaction: P < 0.0001, mixed-effects model). Asterisks indicate significant differences (P < 0.05) from both parental controls or in planned pairwise comparisons. Data are means ± s.e.m.; n, number of dendritic regions (b,c) or flies (dh). Scale bars, 5 μm (b,c). For statistical details see Supplementary Table 1. Source data
Fig. 3
Fig. 3. Sleep history alters mitochondrial dynamics.
a,b, Volumetric renderings (a) and morphometric parameters (b) of automatically detected mitochondria in OPRM image stacks of dFBN dendrites in rested flies, sleep-deprived flies and flies allowed to recover for 24 h after sleep deprivation. Sleep history-dependent changes in mitochondrial number (P < 0.0001, Holm–Šídák test after ANOVA), volume (P = 0.0470, Dunn’s test after Kruskal–Wallis ANOVA), sphericity (P = 0.0124, Dunn’s test after Kruskal–Wallis ANOVA) and branch length (P = 0.0033, Dunn’s test after Kruskal–Wallis ANOVA) are occluded by the co-expression of AOX (P ≥ 0.2257, two-sided t-test or Mann–Whitney test) or the simultaneous activation of TrpA1 (P ≥ 0.0625, two-sided t-test or Mann–Whitney test) and (over)corrected after recovery sleep (number of mitochondria: P = 0.1551, all other parameters: P ≤ 0.0302, Dunn’s test after Kruskal–Wallis ANOVA). Two data points exceeding the y-axis limits are plotted as triangles at the top of the graphs; mean and s.e.m. are based on the actual values. c, Drp1 recruitment. Single confocal image planes through dFBN somata of flies expressing R23E10-GAL4-driven mito-GFP (top) and Drp1Flag from the endogenous locus (bottom). Sleep deprivation increases the percentage of cellular anti-Flag fluorescence (intensity-coded according to the key below) within automatically detected mitochondrial contours (P < 0.0001, two-sided Mann–Whitney test). d, Mitochondria–endoplasmic reticulum contacts. Isosurface renderings (voxel value 128) of SPLICS puncta in distal dFBN dendritic branches (dashed outlines), obtained by trilinear interpolation of thresholded and despeckled confocal image stacks. Sleep deprivation increases the number of SPLICS puncta per dendritic field (P < 0.0001, two-sided Mann–Whitney test). e, Mitophagy. Summed-intensity projections of dFBN dendrites expressing mito-QC. Emission ratios are intensity-coded according to the key below and increase after sleep deprivation (P = 0.0101, two-sided t-test). Data are means ± s.e.m.; n, number of dendritic regions (b,d,e) or somata (c); asterisks, significant differences (P < 0.05) in planned pairwise comparisons. Scale bars, 10 μm (a), 2 μm (c), 10 μm (d), 5 μm (e). For statistical details see Supplementary Table 1. Source data
Fig. 4
Fig. 4. Mitochondrial dynamics alter sleep.
a, The mitochondrial fission (green) and fusion machineries (blue) comprise Drp1, the outer and inner membrane proteins Marf and Opa1, and the mitoPLD zuc, which releases phosphatidic acid (PA) from cardiolipin (CL). Miga stimulates zuc activity and/or supplies phosphatidic acid from other membranes. b,c, Sleep profiles (b, genotype effect: P < 0.0001, time × genotype interaction: P < 0.0001, two-way repeated-measures ANOVA) and daily sleep (c) in flies expressing R23E10VGlut-GAL4-driven fission or fusion proteins, or RNAi transgenes targeting transcripts encoding these proteins (left) or those regulating phosphatidic acid levels (right), and their parental controls. Manipulations that increase fission (green) or fusion (blue) alter sleep in opposite directions (GTPases: P ≤ 0.0332, Holm–Šídák test after ANOVA; phosphatidic acid regulators: P ≤ 0.0198 for all planned pairwise comparisons after Kruskal–Wallis ANOVA). d, Manipulations that increase fission (R23E10VGlut-GAL4 > Opa1RNAi, green) or fusion (R23E10VGlut-GAL4 > Marf,Opa1, blue) alter the time courses (left-hand panels, genotype effects: P ≤ 0.0003, time × genotype interactions: P < 0.0001, two-way repeated-measures ANOVA) and percentages of sleep rebound after deprivation in opposite directions (right-hand panel, genotype effect: P ≤ 0.0450 for all planned pairwise comparisons after Kruskal–Wallis ANOVA). Four data points exceeding the y-axis limits are plotted as triangles at the top of the right-hand graph; mean and s.e.m. are based on the actual values. e, Example voltage responses to current steps of dFBNs expressing mCD8::GFP (grey) and Drp1 (green) or Marf plus Opa1 (blue). f, Manipulations that increase fission (green) or fusion (blue) alter the membrane resistance (Rm)-normalized spike frequency in opposite directions (genotype effect: P < 0.0001, time × genotype interaction: P < 0.0001, mixed-effects model, sample sizes in g). g, Membrane resistances (genotype effect: P = 0.4806, Kruskal–Wallis ANOVA). h, The overexpression of Marf plus Opa1 increases the percentage of dFBNs generating bursts of action potentials (P = 0.0241, χ2-test; standardized residuals +2.01). Data are means ± s.e.m.; n, number of flies (bd) or cells (f,g). Asterisks, significant differences (P < 0.05) in planned pairwise comparisons. For statistical details see Supplementary Table 1. Source data
Extended Data Fig. 1
Extended Data Fig. 1. Identification of dFBNs and their transcriptomic response to sleep deprivation by single-cell RNA-sequencing.
a, Sleep profiles of flies expressing R23E10-GAL4-driven 6xEGFP under control (blue, n = 558) and sleep deprivation (SD) conditions (red, n = 432) before single-cell RNA sequencing. b, Pseudocolour plot of the gating strategy used to isolate EGFP-positive (0.03% of total) and EGFP-negative cells (14.64% of total) by flow cytometry. c, Uniform manifold approximation and projection (UMAP) representation of cells in the fly brain. Highlighted cell types, including neurons nominated by R23E10-GAL4 (yellow), were identified as detailed in Methods. d, Distribution of the number of unique molecular identifiers (UMIs) and genes per cell for each annotated cell type. e, log-normalized distribution of the expression levels of markers for the fast-acting neurotransmitters glutamate, acetylcholine, and GABA in R23E10-GAL4 neurons. f, R23E10-GAL4 neurons (black) mapped onto re-clustered representations of cells expressing glutamatergic, cholinergic, and GABAergic markers. Bona fide dFBNs form a distinct glutamatergic cluster (dashed outline). g, h, Compared to the rest of the glutamatergic brain, dFBNs are enriched in EGFP (g) and transcripts of genes whose enhancer fragments label dFBNs in GAL4 lines generated and imaged by the FlyLight project (h). log-normalized expression levels are colour-coded according to the keys below each panel. Scale bars in h, 100 µm. Anatomical images in panel h reproduced from ref. , Cell Press, under a Creative Commons licence CC BY 4.0.
Extended Data Fig. 2
Extended Data Fig. 2. Gene ontology analysis of sleep history-dependent gene expression in dFBNs.
ad, Enrichment of gene ontology (GO) ‘biological process’ (a, c) and ‘cellular component’ (b, d) terms in the set of genes whose expression in dFBNs varies with sleep history. Panels a and b plot the top ten enriched terms by PANTHER Overrepresentation Test (fold enrichments >100 are truncated). Panels c and d show heatmaps (computed with ViSEAGO and topGO) of GO terms attached to downregulated (left) and upregulated (right) differentially expressed genes. Dendrograms represent semantic groupings among GO terms. P-values are colour-coded according to the keys on the right. e, Enrichment (top) and uncorrected P-values (bottom, dotted lines at P = 0.05) of the ‘cellular component’ GO terms ‘mitochondrion’ and ‘synapse’ in the sets of up- and downregulated genes by PANTHER Overrepresentation Test, in the full data set (dark grey) and after randomly downsampling (light grey) the number of rested dFBN transcriptomes to the number of sleep-deprived dFBN transcriptomes (n = 86 cells in either condition). The downsampling process was repeated ten times using the ‘max.cells.per.ident’ argument of the ‘FindMarkers’ function in Seurat, with reproducible seedings from 1 to 10.
Extended Data Fig. 3
Extended Data Fig. 3. Sleep history-dependent gene expression in Kenyon cells, projection neurons and non-dFBN cells.
a, UMAP representation of projection neurons (PNs, n = 317) from rested (blue) and sleep-deprived brains (red) according to their gene expression profiles. b, Volcano plot of sleep history-dependent gene expression changes in PNs. A single signal with Bonferroni-corrected P < 0.05 (two-sided Wilcoxon rank-sum test) is indicated in black. c, d, PANTHER Overrepresentation Test fails to detect enriched ‘biological process’ (g) and ‘cellular component’ (h) gene ontology (GO) terms in the set of differentially expressed PN genes. e, UMAP representation of Kenyon cells (KCs, n = 603) from rested (blue) and sleep-deprived brains (red) according to their gene expression profiles. f, Volcano plot of sleep history-dependent gene expression changes in PNs. Signals with Bonferroni-corrected P < 0.05 (two-sided Wilcoxon rank-sum test) are indicated in black. g, h, Enrichment of the top ten downregulated and upregulated ‘biological process’ (g) and ‘cellular component’ (h) GO terms in the set of differentially expressed KC genes by PANTHER Overrepresentation Test (fold enrichments >100 are truncated). i, j, Enrichment of the top ten downregulated and upregulated ‘biological process’ (i) and ‘cellular component’ (j) GO terms in the set of genes with differential expression in all non-dFBN cells by PANTHER Overrepresentation Test. Source data
Extended Data Fig. 4
Extended Data Fig. 4. Relationships between ATP levels, mitochondrial protonmotive force, and sleep in PNs and dFBNs.
a, Maximum-intensity projection of dFBNs expressing R23E10-GAL4-driven ATeam (top left, CFP channel). One dFBN has been filled with biocytin and a defined ATP concentration through a whole-cell electrode (bottom left). The right panel shows the least-squares fit of a Hill equation (dissociation constant 1.75 mM ATP, Hill coefficient 2.1) to the mean yellow-to-cyan emission ratio of biocytin-labelled dFBNs containing 0.15, 1.5, and 4 mM ATP (n = 3 cells each). b, Summed-intensity projections of PN dendrites expressing iATPSnFR plus RFP, in rested and sleep-deprived (SD) flies. Emission ratios are intensity-coded according to the key below and unaltered by sleep deprivation (P = 0.6616, two-sided t-test). c, Sleep in flies expressing R23E10-GAL4-driven Ucp4A or Ucp4C and parental controls (P ≤ 0.0139, Dunn’s test after Kruskal-Wallis ANOVA). d, A 400-ms pulse of green light elevates ATP in dFBNs expressing iATPSnFR plus tdTomato and mito-dR but not in dFBNs lacking mito-dR (n = 5 flies of either genotype, ∆p photogeneration effect: P < 0.0001, time × ∆p photogeneration interaction: P < 0.0001, two-way ANOVA). e, f, Sleep during the first 60 min after illumination (e, P ≤ 0.0279, Dunn’s test after Kruskal-Wallis ANOVA) and cumulative sleep percentages in flies expressing R23E10-GAL4-driven mito-dR, with or without retinal, and parental controls (f, ∆p photogeneration effect: P < 0.0001, time × ∆p photogeneration interaction: P < 0.0001, mixed-effects model). Asterisks, significant differences (P < 0.05) from both parental controls or in planned pairwise comparisons. Data are means ± s.e.m.; n, number of cells (a), antennal lobe glomeruli (b), or flies (cf). Scale bars, 20 µm (a,b). For statistical details see Supplementary Table 2. Source data
Extended Data Fig. 5
Extended Data Fig. 5. Sleep history alters the morphology of dFBN mitochondria.
a, Mean volumes (left y-axes) and volume ratios (right y-axis) of dFBN and PN mitochondria determined by volume electron microscopy (EM), optical photon reassignment microscopy (OPRM), and confocal laser-scanning microscopy (CLSM). b, Correlation between dFBN and PN mitochondrial volume estimates obtained by EM, OPRM, and CLSM (residual s.d. = 0.0041). EM data are from the hemibrain connectome; OPRM and CLSM measurements of mitochondrial volumes in flies expressing mito-GFP are re-plotted from Fig. 3b and Extended Data Fig. 6b, and from f and Extended Data Fig. 6d, respectively. c, d, Sleep deprivation via thermogenetic activation of arousing dopaminergic neurons (c) causes mitochondrial fragmentation detected by OPRM (d, number of mitochondria: P = 0.1812, volume: P = 0.0010, sphericity: P = 0.0192, branch length: P = 0.2013, two-sided t-test). Experimental and control flies (n = 30 and 33, respectively) were reared and maintained at 21 °C and shifted to 29 ˚C between zeitgeber times 12 and 24 on day 2. The arrowhead marks the time point when 11 experimental and 13 control flies were removed and dissected for mitochondrial morphometry. e, f, Maximum intensity projections (e) and morphometric parameters (f) of automatically detected mitochondria in CLSM image stacks of dFBN dendrites in rested flies, sleep-deprived flies, flies allowed to recover for 24 h after sleep deprivation, and rested and sleep-deprived flies co-expressing R23E10-GAL4-driven AOX or TrpA1, which was activated at 29 °C. Sleep history-dependent changes in mitochondrial volume (P = 0.0025, Holm-Šídák test after ANOVA), sphericity (P = 0.0001, Holm-Šídák test after ANOVA), and branch length (P = 0.0414, Holm-Šídák test after ANOVA) are occluded by the co-expression of AOX (P ≥ 0.1515, two-sided t- or Mann-Whitney test) or the simultaneous activation of TrpA1 (P ≥ 0.2002, two-sided t- or Mann-Whitney test) and overcorrected after recovery sleep (all parameters: P < 0.0001, Holm-Šídák test after ANOVA). The number of mitochondria is unchanged by sleep deprivation (P > 0.9999) but elevated after recovery sleep (P < 0.0001, Dunn’s test after Kruskal-Wallis ANOVA). Two data points exceeding the y-axis limits are plotted as triangles at the top of the graphs; mean and s.e.m. are based on the actual values. g, Volumetric renderings of automatically detected mitochondria in OPRM image stacks of dFBN dendrites in rested and sleep-deprived flies co-expressing R23E10-GAL4-driven AOX or TrpA1, which was activated at 29 °C. h, Sleep in flies expressing R23E10-GAL4-driven split-GFP-based contact site sensors (SPLICS) or fluorescent fusion proteins located in the outer mitochondrial (OMM), endoplasmic reticulum (Sec61β), or plasma membrane (CD4) (P = 0.0648, ANOVA). Data are means ± s.e.m. or ratios of means ± error-propagated s.e.m. (a, light gray); n, number of cells (a, b, EM), dendritic fields (a, b, OPRM and CLSM, d, f), or flies (c, h); asterisks, significant differences (P < 0.05) in planned pairwise comparisons. Scale bars, 10 µm (e,g). For statistical details see Supplementary Table 2. Source data
Extended Data Fig. 6
Extended Data Fig. 6. Sleep history does not alter the morphology of PN mitochondria.
a, b, Volumetric renderings (a) and morphometric parameters (b) of automatically detected mitochondria in OPRM image stacks of PN dendrites in rested and sleep-deprived flies. Mitochondrial number (P = 0.7077, two-sided t-test), volume (P = 0.8074, two-sided t-test), sphericity (P = 0.6500, two-sided t-test), and branch length (P = 0.5326, two-sided t-test) are unaffected by sleep deprivation. c, d, Maximum intensity projections (c) and morphometric parameters (d) of automatically detected mitochondria in CLSM image stacks of PN dendrites in rested and sleep-deprived flies. Mitochondrial number (P = 0.2534, two-sided Mann-Whitney test), volume (P = 0.7637, two-sided Mann-Whitney test), sphericity (P = 0.1953, two-sided Mann-Whitney test), and branch length (P = 0.6972, two-sided t-test) are unaffected by sleep deprivation. One data point exceeding the y-axis limits is plotted as a triangle at the top of the right-hand graph; mean and s.e.m. are based on the actual values. Scale bars, 10 µm (a), 20 µm (c). For statistical details see Supplementary Table 2. Source data
Extended Data Fig. 7
Extended Data Fig. 7. Morphological and metabolic consequences of inducing mitochondrial fission or fusion in dFBNs.
a, b, Volumetric renderings (a) and morphometric parameters (b) of automatically detected mitochondria in OPRM image stacks of dFBN dendrites. Flies carried R23E10-GAL4-driven overexpression constructs or RNAi transgenes targeting mitochondrial fission or fusion machinery. Manipulations that increase fission (green) or fusion (blue) have opposite effects on mitochondrial volume (P ≤ 0.0480, Holm-Šídák test after ANOVA), sphericity (P ≤ 0.0344, Holm-Šídák test after ANOVA), and branch length (P ≤ 0.0326, Holm-Šídák test after ANOVA). c, Morphometric parameters of automatically detected mitochondria in CLSM image stacks of dFBN dendrites. Flies carried R23E10-GAL4-driven overexpression constructs or RNAi transgenes targeting mitochondrial fission or fusion machinery. Manipulations that increase fission (green) or fusion (blue) have opposite effects on mitochondrial volume (P ≤ 0.0062, Dunn’s test after Kruskal-Wallis ANOVA), sphericity (P ≤ 0.0170, Holm-Šídák test after ANOVA), and branch length (P ≤ 0.0427, Dunn’s test after Kruskal-Wallis ANOVA). Five data points exceeding the y-axis limits are plotted as triangles at the top of the graphs; mean and s.e.m. are based on the actual values. d, Summed-intensity projections of dFBN dendrites expressing Drp1 and iATPSnFR plus RFP, in rested and sleep-deprived (SD) flies. Emission ratios are intensity-coded according to the key below and reduced in dFBNs expressing Drp1, irrespective of sleep history (Drp1 effect: P < 0.0001, sleep history effect: P < 0.0001, Drp1 × sleep history interaction: P = 0.1112; two-way ANOVA). Data are means ± s.e.m.; n, number of dendritic fields; asterisks, significant differences (P < 0.05) from both manipulations increasing fission. Scale bars, 10 µm (a), 5 µm (d). For statistical details see Supplementary Table 2. Source data
Extended Data Fig. 8
Extended Data Fig. 8. Inducing mitochondrial fission or fusion in dFBNs alters sleep.
a, b, Sleep in flies expressing R23E10-GAL4-driven fission or fusion proteins, or RNAi transgenes targeting transcripts encoding these proteins (a) or proteins regulating phosphatidic acid levels (b), and their parental controls. With the exception of the overexpression of Marf alone (P ≥ 0.1622, Holm-Šídák test after ANOVA), manipulations that increase fission (green) or fusion (blue) alter sleep in opposite directions (GTPases: P ≤ 0.0115, phosphatidic acid regulators: P ≤ 0.0381; Holm-Šídák test after ANOVA). ce, Sleep in flies carrying R23E10-GAL4-driven Drp1 overexpression constructs or RNAi transgenes targeting mitochondrial fusion proteins not included in a, b and Fig. 4c: two independent constructs for Drp1 overexpression (c, P ≤ 0.0209, Dunn’s test after ANOVA); six independent RNAi transgenes directed against Opa1 (d, P ≤ 0.0199, Holm-Šídák test after ANOVA); and five independent RNAi transgenes directed against Marf (e, P ≥ 0.1017 relative to ≥1 parental control with the exception of R23E10 > Marf sm(II), Holm-Šídák test after ANOVA). f, Manipulations that increase fission (R23E10-GAL4 > Opa1RNAi, green) or fusion (R23E10 > Marf,Opa1, blue) alter the time courses (left panels, genotype effects: P ≤ 0.0213, time × genotype interactions: P < 0.0001, two-way repeated-measures ANOVA) and percentages of sleep rebound after deprivation (SD) in opposite directions (right panel, genotype effect: P ≤ 0.0186, Dunn’s test after ANOVA). One data point exceeding the y-axis limits is plotted as a triangle at the bottom of the right-hand graph; mean and s.e.m. are based on the actual values. g, Sleep in flies carrying an R23E10-GAL4-driven Marf overexpression construct not included in a and Fig. 4c (P ≥ 0.1252, Dunn’s test after Kruskal-Wallis ANOVA). Data are means ± s.e.m.; n, number of flies; asterisks, significant differences (P < 0.05) from both parental controls. For statistical details see Supplementary Table 2. Source data
Extended Data Fig. 9
Extended Data Fig. 9. Inducing mitochondrial fission or fusion in dFBNs alters arousal thresholds without causing overexpression artefacts or anatomical defects.
a, b, Percentages of flies awakened by mechanical stimuli lasting 0.5 s (left panels), 2 s, or 20 s (right panels). The average percentages awakened by 0.5-s stimuli in the left panels are reproduced on the right. Manipulations that increase fission fail to lower the arousal threshold, possibly because of a floor effect linked to the R23E10-GAL4 strain (a, P ≥ 0.3354 relative to ≥1 parental control, Dunn’s test after Kruskal-Wallis ANOVA). With the exception of the overexpression of Marf alone (P > 0.9999), manipulations that increase fusion raise the arousal threshold (b, P ≤ 0.0371, Dunn’s test after Kruskal-Wallis ANOVA). c, Sleep in flies expressing R23E10-GAL4-driven Marf is insensitive to the co-expression of fluorescent proteins in the cytoplasm (tdTomato) or the outer mitochondrial membrane (OMM-mCherry) (P ≥ 0.1106, Dunn’s test after Kruskal-Wallis ANOVA), in contrast to the synergistic effect of overexpressing Opa1 (Fig. 4c, Extended Data Fig. 8a). d, Maximum-intensity projections of dFBNs in flies carrying R23E10-GAL4-driven overexpression constructs or RNAi transgenes targeting the mitochondrial fission or fusion machinery. Five brains per genotype were imaged; representative examples are shown. Data are means ± s.e.m.; n, number of flies; asterisks, significant differences (P < 0.05) from both parental controls. Scale bar, 100 µm (d). For statistical details see Supplementary Table 2. Source data
Extended Data Fig. 10
Extended Data Fig. 10. Inducing mitochondrial fission or fusion in PNs or KCs has no effect on sleep.
a, Sleep in flies carrying GH146-GAL4-driven overexpression constructs or RNAi transgenes targeting the mitochondrial fission or fusion machinery in PNs (P ≥ 0.0842 relative to ≥1 parental control, Holm-Šídák test after ANOVA). b, Sleep in flies carrying OK107-GAL4-driven overexpression constructs or RNAi transgenes targeting the mitochondrial fission or fusion machinery in KCs (P ≥ 0.0660 relative to ≥1 parental control, Holm-Šídák test after ANOVA). Data are means ± s.e.m.; n, number of flies. For statistical details see Supplementary Table 2. Source data

References

    1. Donlea, J. M., Thimgan, M. S., Suzuki, Y., Gottschalk, L. & Shaw, P. J. Inducing sleep by remote control facilitates memory consolidation in Drosophila. Science332, 1571–1576 (2011). - PMC - PubMed
    1. Hasenhuetl, P. S. et al. A half-centre oscillator encodes sleep pressure. Preprint at BioRxiv10.1101/2024.02.23.581780 (2024).
    1. Vance, J. E. Phospholipid synthesis in a membrane fraction associated with mitochondria. J. Biol. Chem.265, 7248–7256 (1990). - PubMed
    1. Kornmann, B. et al. An ER–mitochondria tethering complex revealed by a synthetic biology screen. Science325, 477–481 (2009). - PMC - PubMed
    1. Rorsman, H. O. et al. Sleep pressure accumulates in a voltage-gated lipid peroxidation memory. Nature641, 232–239 (2025). - PMC - PubMed

MeSH terms

Substances