. 2025 Jul 16;23(1):341.
doi: 10.1186/s12964-025-02341-6.

Mitochondria from huntington´s disease striatal astrocytes are hypermetabolic and compromise neuronal branching

Affiliations

Mitochondria from huntington´s disease striatal astrocytes are hypermetabolic and compromise neuronal branching

Laura López-Molina et al. Cell Commun Signal. .

Abstract

Background: Deficits in mitochondrial bioenergetics and dynamics are strongly implicated in the selective vulnerability of striatal neurons in Huntington´s disease. Beyond these neuron-intrinsic factor, increasing evidence suggest that non-neuronal mechanisms, particularly astrocytic dysfunction involving disrupted homeostasis and metabolic support also contribute to disease progression. These findings underscore the critical role of metabolic crosstalk between neurons and astrocytes in maintaining striatal integrity. However, it remains unclear whether this impaired communication affects the transfer of mitochondria from astrocytes to striatal neurons, a potential metabolic support mechanism that may be compromised in Huntington´s Disease.

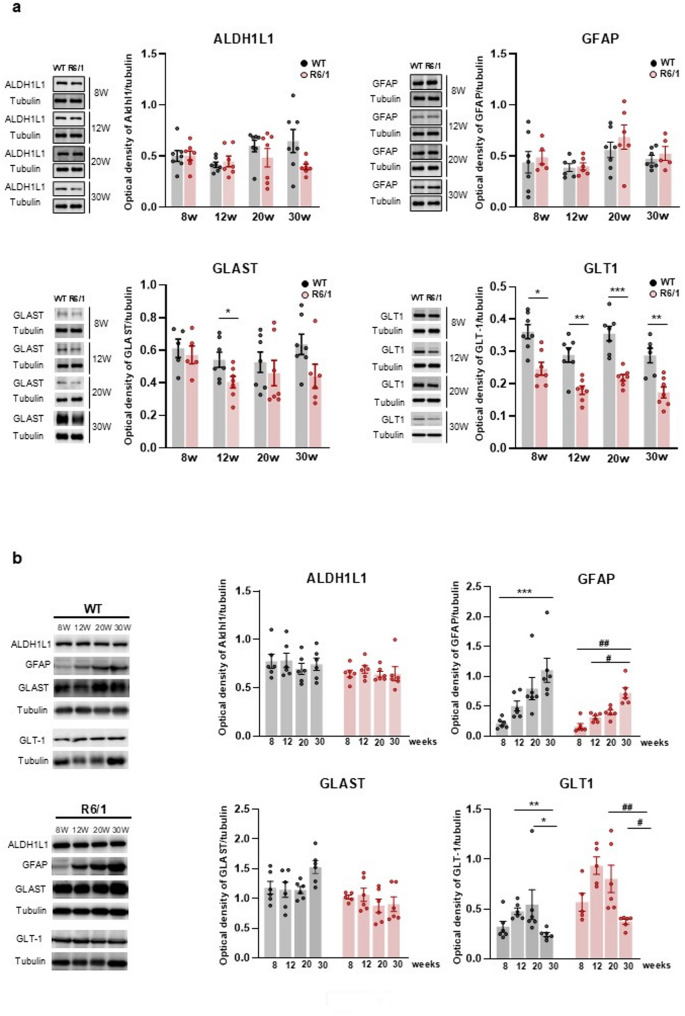
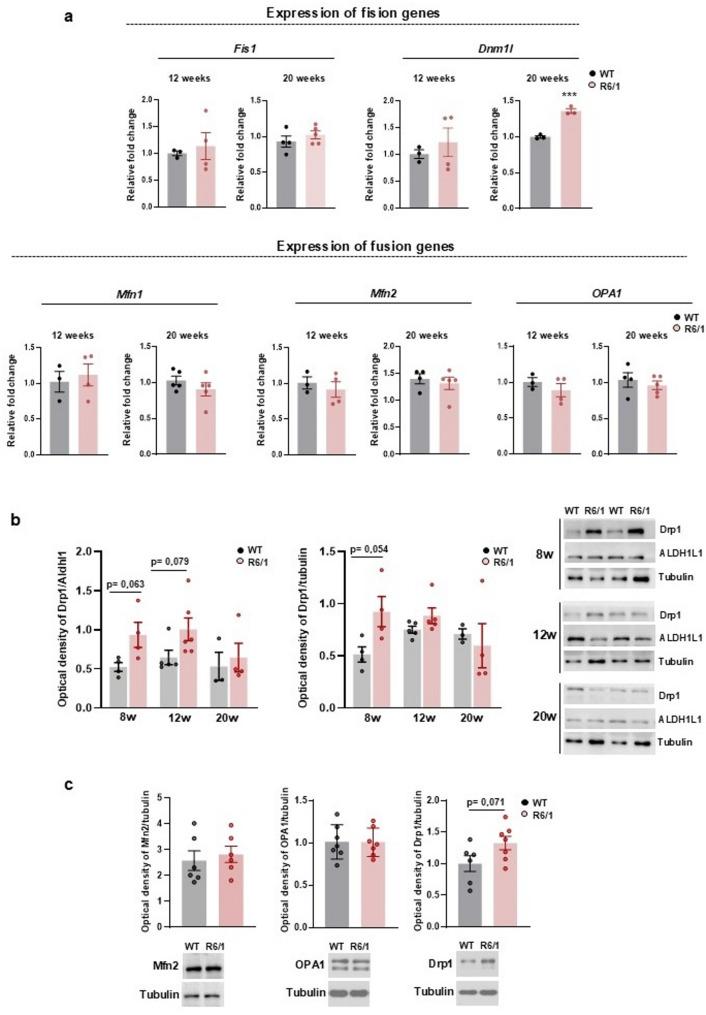
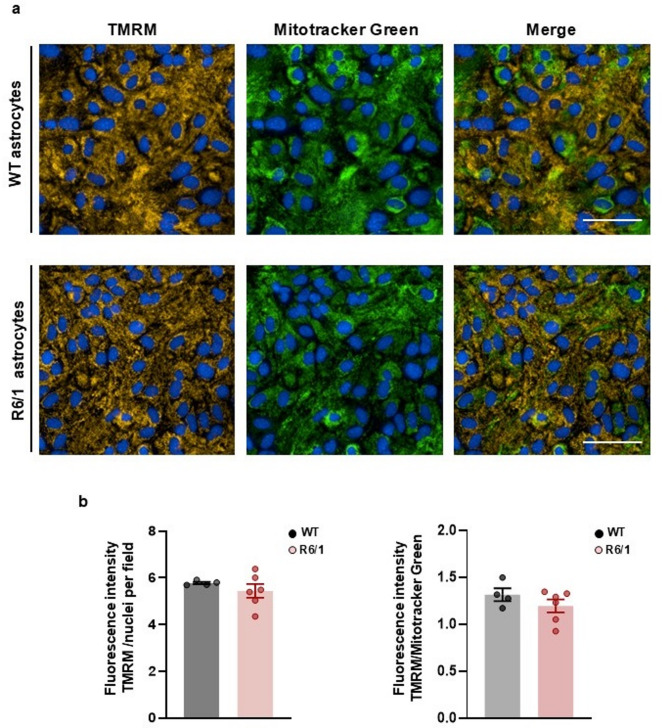
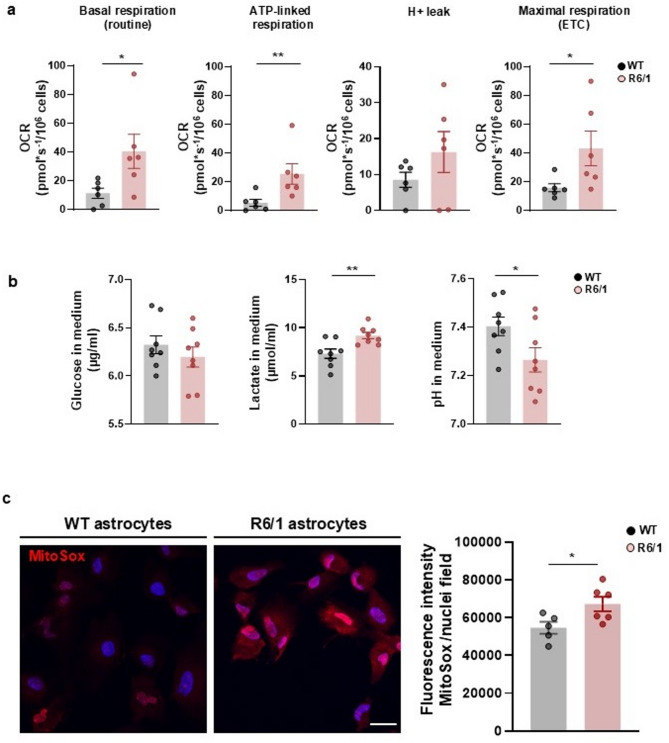
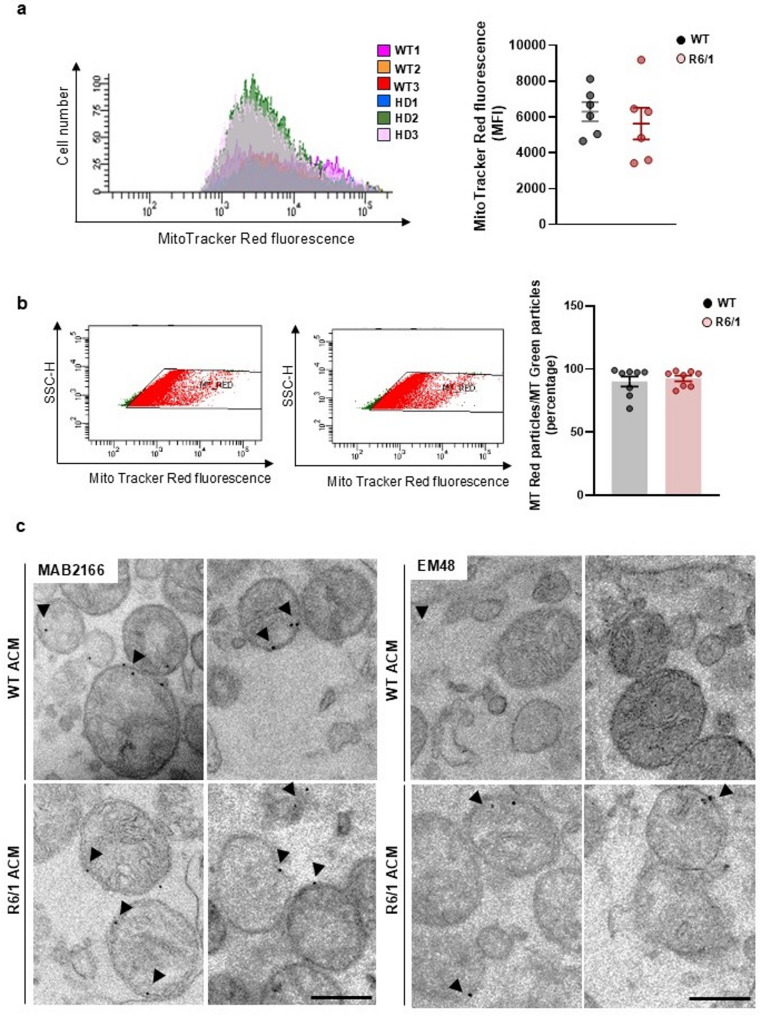
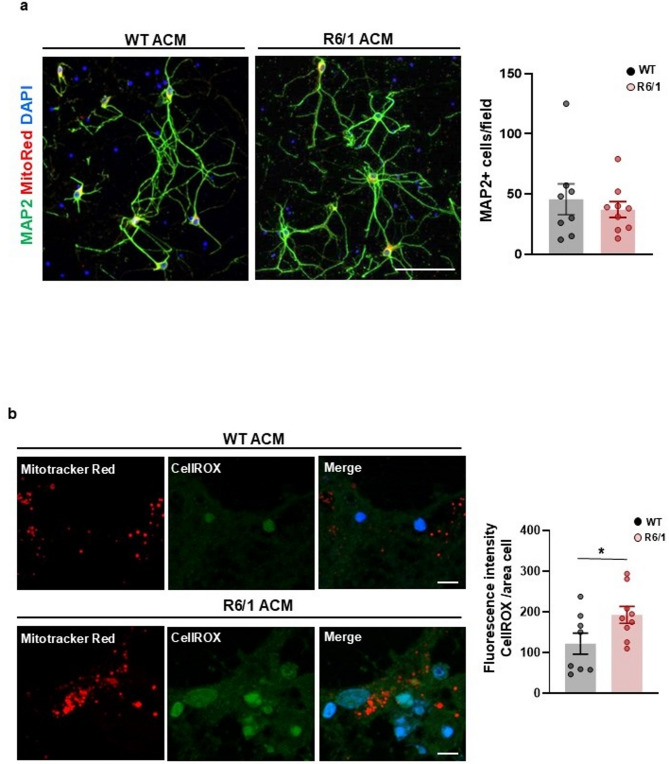
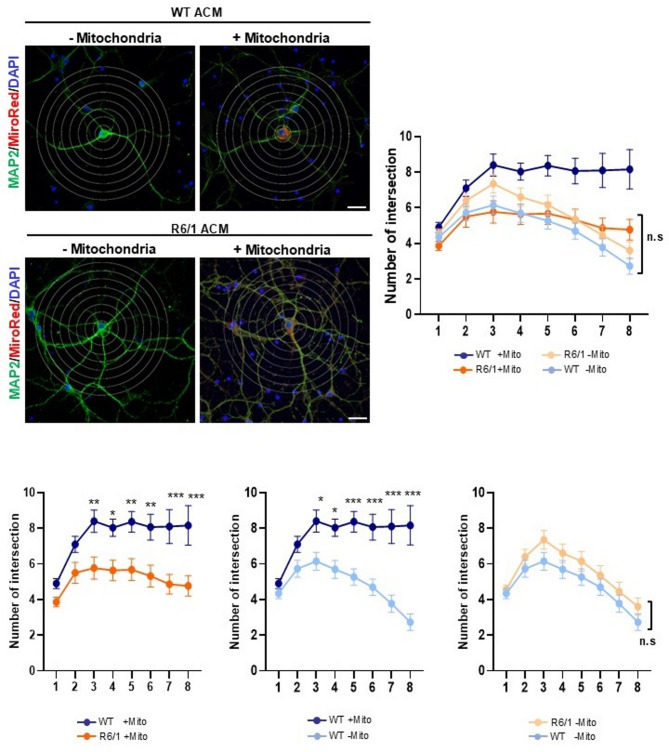
Methods: Primary striatal astrocytes were obtained from wild-type and R6/1 mice to investigate mitochondrial dynamics. Expression levels of key mitochondrial fusion and fission proteins were quantified by Western blotting and RT-PCR. Mitochondria morphology, oxidative stress and membrane potential were assessed using confocal microscopy following staining with mitochondria-specific dyes. Mitochondrial respiration was measured using the Oxygraph-2k respirometer system (Oroboros Instruments). Transmitophagy was evaluated by confocal imaging after labeling astrocytic mitochondria with Mitotracker dyes. To assess the functional impact of mitochondrial transfer on neurons, Sholl analysis, neuronal death and oxidative stress levels were quantified using specific fluorogenic probes.

Results: Striatal astrocytes from HD mice exhibited a significant increase in mitochondrial fission, and mitochondrial oxidative stress, mirroring alterations previously reported in striatal neurons. Analysis of mitochondrial oxygen consumption rate (OCR) revealed elevated respiration activity and enhanced ATP-linked respiration, indicative of a hypermetabolic state. Concurrently, increased lactate production suggested a shift toward dysregulated astrocytic energy metabolism. These mitochondrial alterations were functionally detrimental: astrocytic mitochondria derived from HD mice when taken up by striatal neurons via transmitophagy, led to reduced neuronal branching and disrupted oxidative homeostasis.

Conclusions: Our findings demonstrate that striatal astrocytes from HD mice exhibit a hypermetabolic phenotype, characterized by increased mitochondrial respiration, disrupted mitochondrial dynamics, and elevated mitochondrial oxidative stress. Importantly, we identify a novel mechanism of astrocyte-neuron interaction involving the transfer of dysfunctional mitochondria from astrocytes to neurons. The uptake of these compromised mitochondria by striatal neurons results in reduced neuronal branching and increased reactive oxygen species (ROS) production. Collectively, these results highlight the pathological relevance of impaired astrocyte-to-neuron mitochondrial transfer and emphasize the contributory role of astrocytic dysfunction in Huntington´s disease progression.

Keywords: Astrocytes; Huntingtin; Mitochondria transfer; Neuroglial communication; R6/1 mice; Striatum.


Conflict of interest statement

Declarations. Ethics approval and consent to participate: Experimental procedures with mice were approved by the Local Ethical Committee of the University of Barcelona (CEEA 369/19 and 439/22) and the Generalitat de Catalunya (DAAM 369/19), following European (86/609/EU) and Spanish (RD 1201/2005) regulations for the care and use of laboratory animals. Consent for publication: Not applicable. Competing interests: The authors declare no competing interests.

Figures

Fig. 1
Fig. 1
Astrocyte marker levels remain unchanged in the striatum of R6/1 mice. a Representative immunoblots showing the expression of astrocytic markers ALDH1L1, GFAP, GLAST, and GLT1 in total striatal lysates from WT and R6/1 mice at different disease stages. Tubulin was used as a loading control. Quantification histograms represent protein levels normalized to tubulin. Data are presented as mean ± SEM (n = 5–7 animals). * p < 0.05, ** p < 0.01 and *** p < 0.001 vs. WT (Student’s t-test). W = weeks. b. Time-course immunoblots showing striatal expression of ALDH1L1, GFAP, GLAST and GLT-1 in WT and R6/1 mice at 8, 12, 20 and 30 weeks of age. Histograms represent protein levels relative to tubulin. Data are presented as mean ± SEM (n = 5–6 animals). ***p < 0.001 vs. WT (Kruskall-Wallis with Dunn´s post hoc); #p < 0.05, ##p < 0.01 vs. WT (One-way ANOVA with Tukey´s pots hoc)
Fig. 2
Fig. 2
Dysregulation of Drp1 expression without alterations in fusion-related proteins in the striatum of R6/1 mice. a. Gene expression analysis of fission (Fis1, Dnm1l) and fusion (Mfn1, Mfn2, OPA1) markers in striatal astrocytes isolated from WT and R6/1 mice at 12 and 20 weeks of age, using Taqman Array Cards. Expression levels were normalized to 18 S rRNA and are shown as fold change relative to WT. b. Representative immunoblots showing Drp1 protein expression in lysates from striatal astrocytes isolated from WT and R6/1 mice at 8, 12 and 20 weeks of age. ALDH1L1 and tubulin were used as loading controls. Quantification histograms display Drp1 levels normalized to ALDH1L1 and tubulin. Data are presented as mean ± SEM (n = 4–6 samples; each sample represents a pool of 3 animals). p-values determined by Student´s t test. W = weeks. c. Representative immunoblots showing the expression of Mfn2, OPA1 and Drp1 in lysates from WT and R6/1 primary striatal astrocytes at DIV14. Tubulin was used as a loading control. Histograms display protein levels normalized to tubulin. Data are presented as mean ± SEM (n = 6–7 samples). p-values determined by Student´s t test
Fig. 3
Fig. 3
Mitochondrial fragmentation is increased in R6/1 striatal astrocytes. (a) Representative confocal images showing striatal primary astrocytes from WT and R6/1 mice stained for the mitochondrial marker TOMM20 (grey) and the astrocyte-specific marker GLAST (red). Imaging was performed using identical laser power and exposure settings for all samples. Scale bar = 50 μm. Magnification, scale bar = 5 μm. (b) Quantification of mitochondrial number in WT and R6/1 striatal primary astrocytes. Left: Number of mitochondria per field. Right: relative number of mitochondria per cell and field. Data are presented as means ± SEM from 8 mosaic images per genotype, obtained from 3–4 independent animals. Each data point represents the average mitochondrial count per field (n = 400–500 cells analyzed in total). *p < 0.05, **p < 0.01 vs. WT (unpaired Student´s t test.)
Fig. 4
Fig. 4
Mitochondrial membrane potential is preserved in R6/1 striatal astrocytes. a. Representative confocal images of striatal primary astrocytes co-labeled with TMRM (orange), indicating mitochondrial membrane potential, and MitoTracker Green (green), labeling total mitochondrial mass and Hoescht for nuclei (blue). Merged images (right column) shows co-localization signals, with overlapping regions appearing yellow. b. Quantification of mitochondrial membrane potential. Histograms show mean fluorescence intensity for TMRM normalized to nuclei per field, as well as the ratio of TMRM to MitoTracker Green intensities (reflecting membrane potential relative to mitochondrial content). Data are presented as mean ± SEM from 25 image frames acquired across 6 animals from 2 independent cultures. Scale bar = 50 μm
Fig. 5
Fig. 5
Increased mitochondrial respiration in R6/1 striatal astrocytes. a. Mitochondrial oxygen consumption was measured in WT and R6/1 striatal primary astrocytes using Oroboros O2K Respirometer. Representative graphs show oxygen consumption following sequential addition of substrates and inhibitors. Basal respiration (routine), ATP-linked respiration, proton leak (after oligomycin) and maximal respiration capacity (ETC; after CCCP uncoupling) were measured. b. Glucose consumption, lactate production, and pH levels were measured in the culture medium of WT and R6/1 astrocytes using EPOC microfluidic cards. c. Mitochondria oxidative stress was evaluated by MitoSOX staining (red), which mitochondrial superoxide and DAPI (blue), which labels nuclei. The histogram shows MitoSOX intensity, calculated as integrated density per nucleus per field. Data are presented as mean ± SEM. For each condition 8 images containing at least 20 nuclei were analyzed from 2 independent experiments. Scale bar = 25 μm. * p < 0.05, ** p < 0.01 vs. WT (unpaired Student’s t-test)
Fig. 6
Fig. 6
Extracellular mitochondria derived from R6/1 striatal astrocytes exhibit preserved membrane potential and contain huntingtin protein. Striatal astrocyte-conditioned media (ACM) from WT and R6/1 cultures were stained with MitoTracker Red (membrane potential) and MitoTracker Green (mitochondrial content), followed by flow cytometry analysis. a. Representative flow cytometry traces showing Mitotracker Red fluorescence from WT and R6/1 ACM samples. b. Fluorescence plots illustrating gating for MitoTracker Red-positive events (middle panels, black boxes). Red-positive particles were quantified and expressed as a percentage of the MitoTracker Green (MiToGreen) population (reflecting membrane potential relative to mitochondrial content). Data are presented as mean ± SEM (n = 8 cultures per genotype). c. Representative transmission electron microscopy images of mitochondria from WT and R6/1 ACM samples. Immunogold labeling using MAB2166 (detects both WT and mutant huntingtin) and EM48 (specific for mutant huntingtin) antibodies revealed the presence of huntingtin protein in extracellular mitochondria. Arrows indicate gold particles. Scale bar = 250 nm
Fig. 7
Fig. 7
Transfer of R6/1 astrocytic mitochondria to striatal primary neurons induces oxidative stress. a. Representative confocal images of WT striatal neurons treated with WT or R6/1 ACM. Neurons were labeled with MAP2 (green) as a neuronal marker, MitoTracker Red (red) to trace transferred astrocytic mitochondria, and DAPI (blue) for nuclei. Histogram shows the number of MAP2-postive cells per field. For each condition, three image tiles were acquired from random fields per coverslip, using three independent samples per genotype. Scale bar = 100 μm. b. Oxidative stress in neurons was assessed using CellROX staining (green), which detects reactive oxygen species (ROS). The histogram shows CellROX intensity, calculated as integrated density per cell area. Data are presented as mean ± SEM. 40–50 neurons were analyzed per condition from 2 independent experiments. Scale bar = 10 μm. * p < 0.05 vs. WT, as determined by Student’s t-test
Fig. 8
Fig. 8
Transfer of WT, but not R6/1, astrocytic mitochondria to striatal neurons promotes trophic effects. a. Representative confocal images of WT striatal neurons treated with unfiltered or filtered ACM from WT or R6/1 cultures. Neurons were stained with MAP2 (green), as a neuronal marker, MitoTracker Red (red) to trace transferred astrocytic mitochondria and DAPI (blue) for nuclei. White concentric circles indicate superimposed spheres used for Sholl analysis, centered on the neuronal soma. Sholl analysis comparing dendritic complexity of WT neurons treated with unfiltered (+ Mitochondria) or filtered WT or R6/1 ACM. Plots show the number of intersections as a function of distance from the soma. Data represent 10–15 neuros per genotype and condition from 3 independent experiments. Scale bar = 20 μm. ** p < 0.01 *** p < 0.001 vs. WT unfiltered (+ mitochondria) ACM, as determined by two-way ANOVA followed by Tukey’s post hoc test (treatment effect F(7,215) = 4.838)

References

    1. MacDonald M. A novel gene containing a trinucleotide repeat that is expanded and unstable on huntington’s disease chromosomes. Cell. 1993;72:971–83. - PubMed
    1. Ross CA, Tabrizi SJ. Huntington’s disease: from molecular pathogenesis to clinical treatment. Lancet Neurol. 2011;10:83–98. - PubMed
    1. Vonsattel JP, Myers RH, Stevens TJ, Ferrante RJ, Bird ED, Richardson EP. Neuropathological classification of huntingtonʼs disease. J Neuropathol Exp Neurol. 1985;44:559–77. - PubMed
    1. Vonsattel JPG, Keller C, Cortes Ramirez EP. Huntington’s disease– neuropathology. 2011. pp. 83–100. - PubMed
    1. Mehrabi NF, Waldvogel HJ, Tippett LJ, Hogg VM, Synek BJ, Faull RLM. Symptom heterogeneity in huntington’s disease correlates with neuronal degeneration in the cerebral cortex. Neurobiol Dis. 2016;96:67–74. - PubMed

LinkOut - more resources