. 2025 Jul 16;23(1):343.
doi: 10.1186/s12964-025-02348-z.

Campylobacter jejuni regulates cell cycle progression to potentiate host cell invasion

Affiliations

Campylobacter jejuni regulates cell cycle progression to potentiate host cell invasion

Prabhat K Talukdar et al. Cell Commun Signal. .

Abstract

Background: Campylobacter jejuni is associated with enteritis in humans and domestic animals. Acute C. jejuni-mediated enteritis requires bacterial invasion of intestinal cells with an ensuing host inflammatory response. Known is that C. jejuni invasion of human epithelial cells is dependent on host cell-focal adhesion components, which link the extracellular matrix to the actin cytoskeleton of a cell. Based on the observation that C. jejuni cell invasion engages many of the same components involved in regulating the cell cycle, we hypothesized that C. jejuni regulates the host cell cycle.

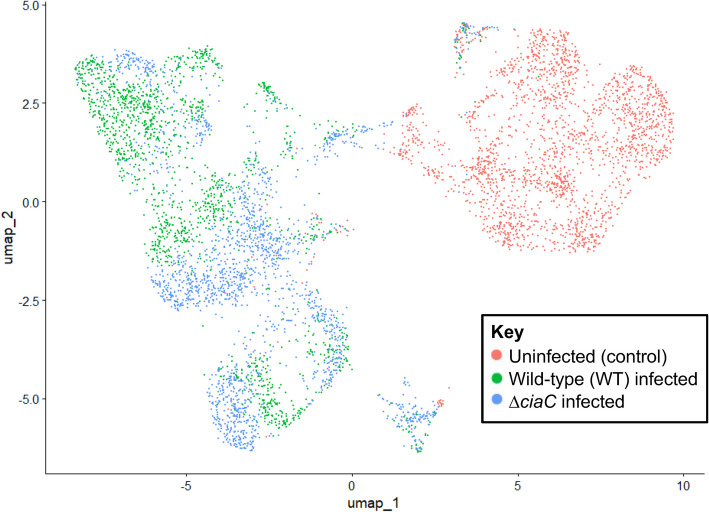
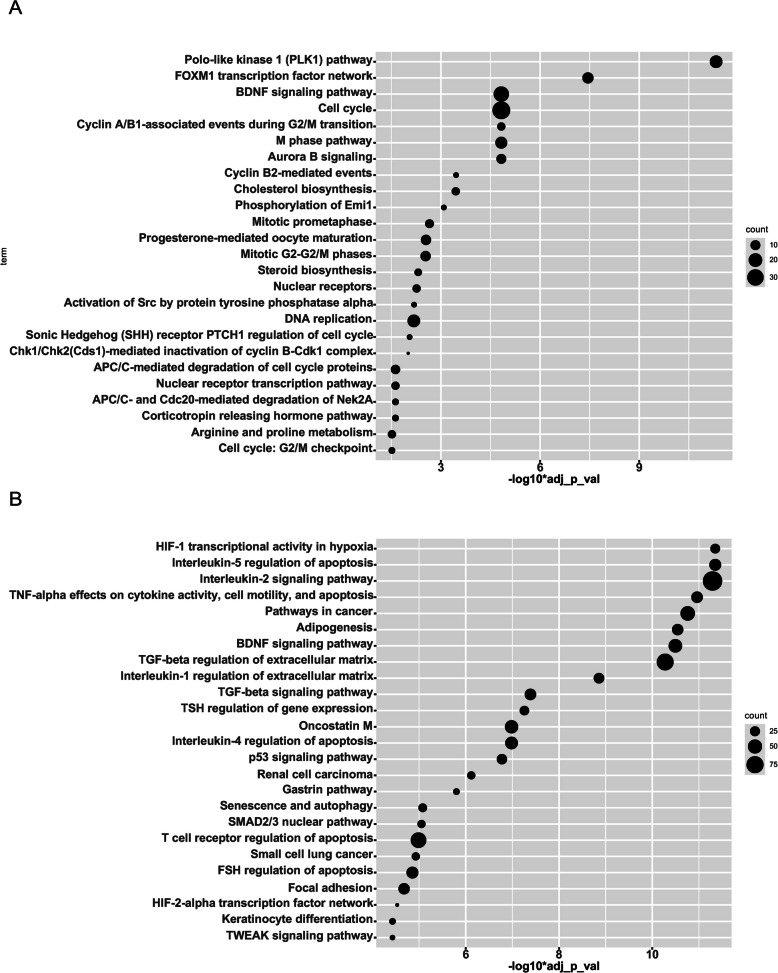
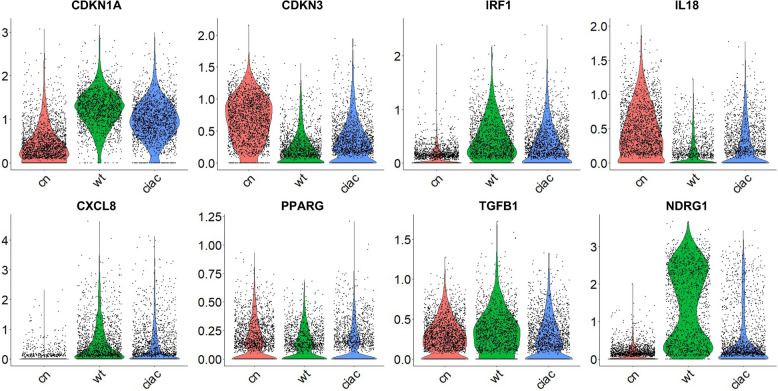
Methods: Flow cytometry was used to detect the cell cycle phases (G1, S, G2 and M). Single-cell RNA-sequencing (scRNA-seq) and reverse transcriptase quantitative PCR (RT-qPCR) were used to determine the differential gene expressions of uninfected and C. jejuni-infected cells. Infection assays and confocal microscopy were employed to determine the rate of bacterial invasion and intracellular localization of C. jejuni-infected cells. Quantification of Interleukin-8 (IL-8) was determined by the ELISAs.

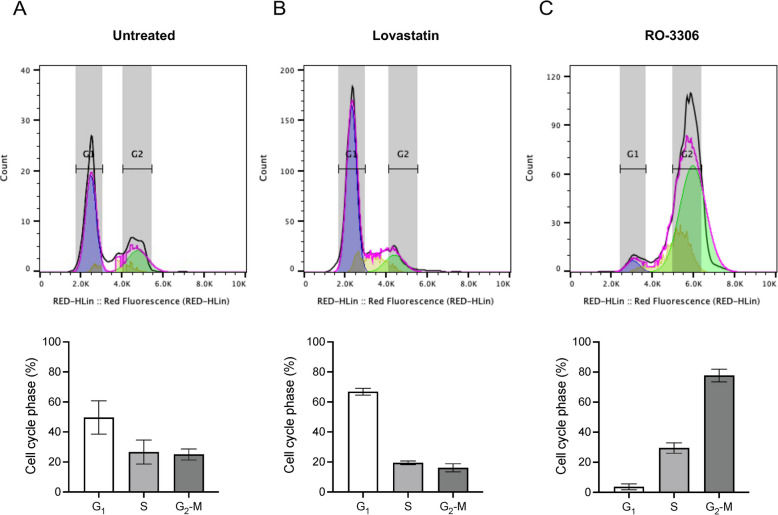
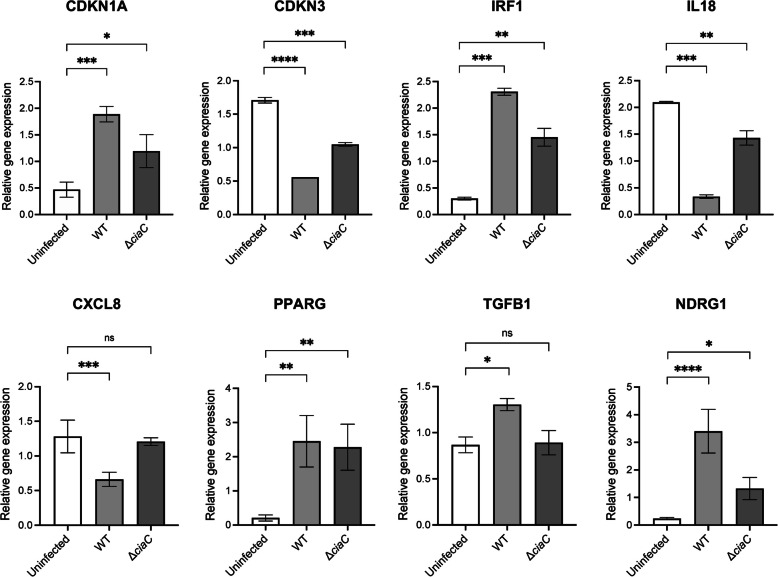
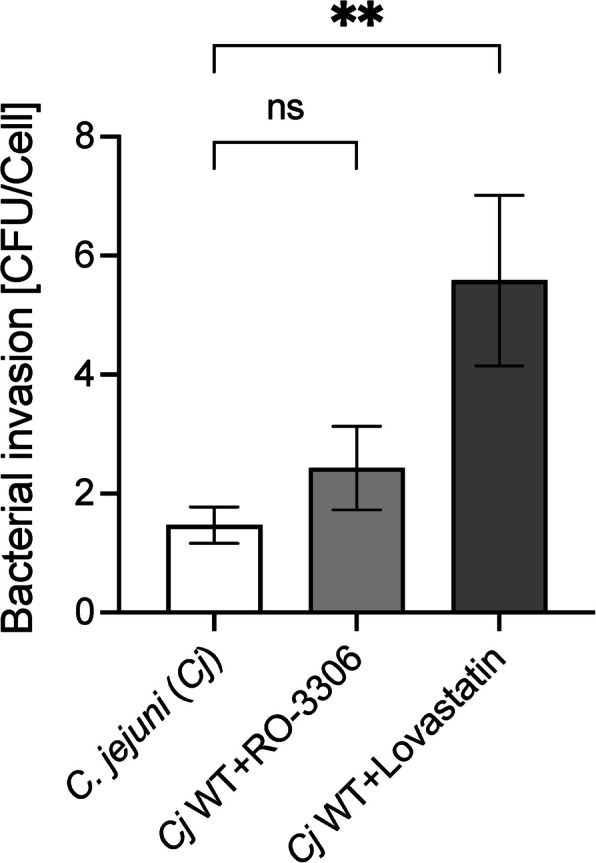
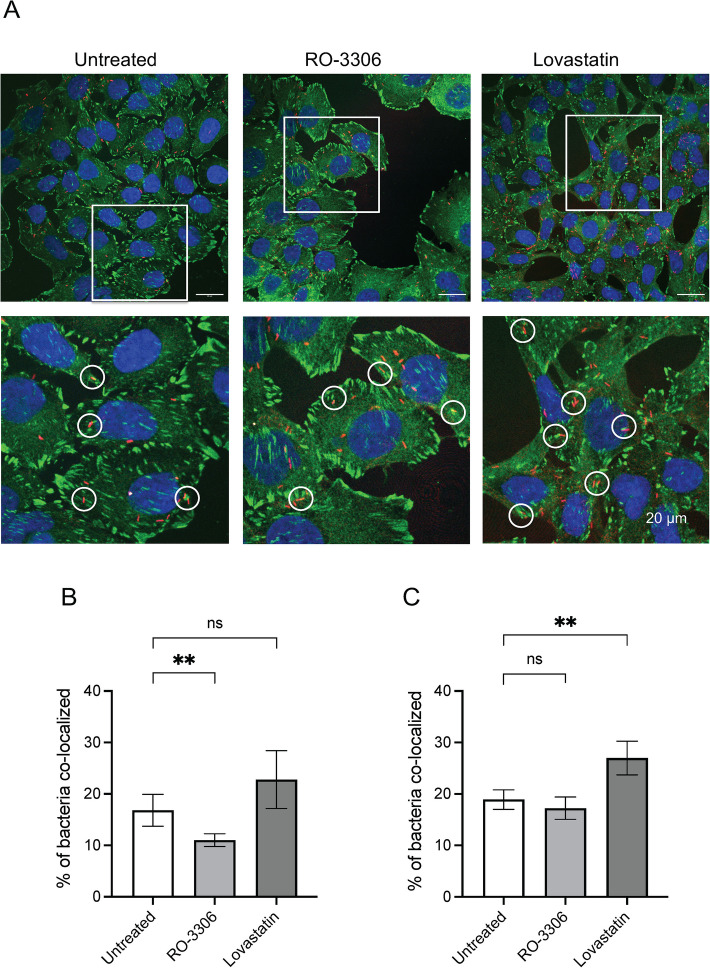
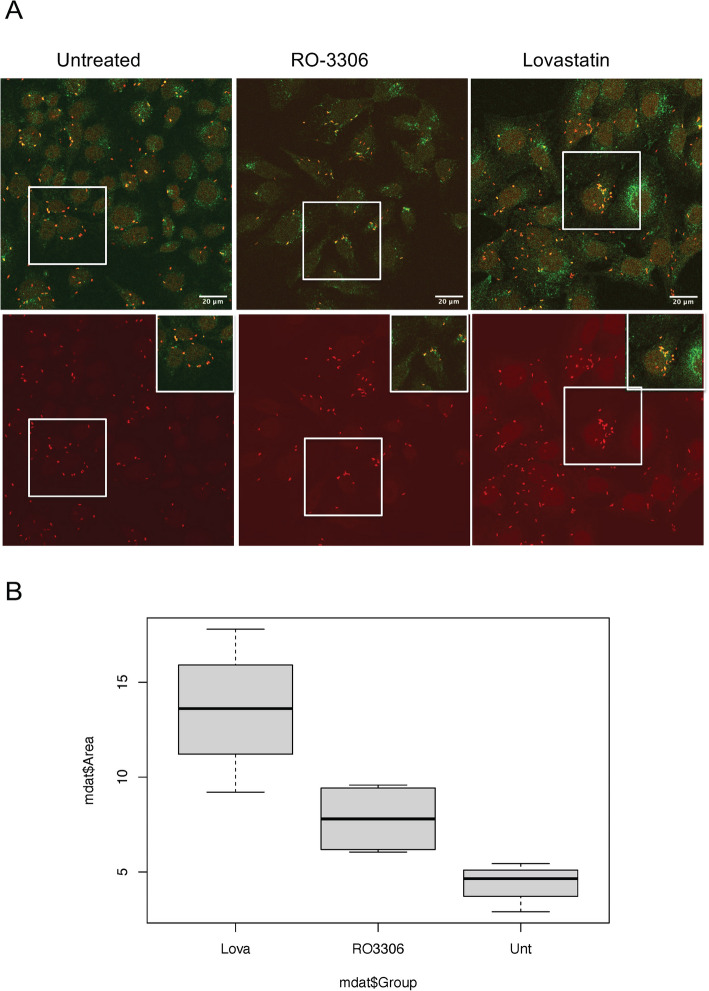
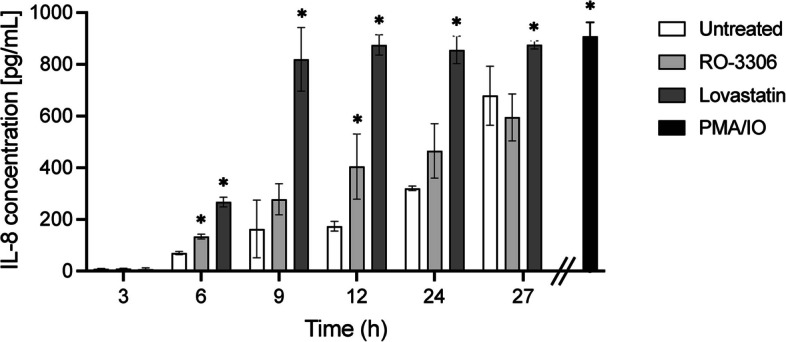
Results: INT 407 cells infected with C. jejuni showed a slower rate of cell cycle progression and a greater percentage of cells in the G1 cell cycle phase. scRNA-seq and RT-qPCR analysis of C. jejuni-infected cells corroborated the result, revealing host genes responsive to C. jejuni infection, including genes associated with cell cycle regulation, focal adhesions, inflammatory cytokines, and oxidative stress. Cell cycle synchronization coupled with the gentamicin-protection revealed that C. jejuni preferentially invades cells in the G1 phase. Moreover, an increase was observed in the number of bacteria colocalized with paxillin, a critical component of focal adhesion complexes, during the G1 phase. The infection of INT 407 cells in the G1 phase also increased the secretion of the proinflammatory cytokine IL-8 from cells.

Conclusions: Based on the data, we propose that acute C. jejuni-mediated enteritis (campylobacteriosis) alters the cell cycle phase of enterocytes, cytokine production, and immune cell recruitment, disrupting the intestinal permeability barrier.

Keywords: Cell cycle; Cell invasion; Inflammatory response; Oxidative stress; scRNA-seq.


Conflict of interest statement

Declarations. Ethics approval and consent to participate: Not applicable. Consent for publication: Not applicable. Competing interests: The authors declare no competing interests.

Figures

Fig. 1
Fig. 1
Cell cycle synchronization of INT 407 cells. INT 407 cells were incubated in (A) medium without drug (untreated, synchronized), (B) medium with lovastatin (G1 synchronized), and (C) medium with RO-3306 (G2/M synchronized) (x-axis = signal intensity). The top panel shows the representative images from the flow cytometry. The plots at the bottom of the figures show the percentages of cells in the G1, S, or G2/M phases of the cell cycle from three experiments completed on different days
Fig. 2
Fig. 2
C. jejuni alters the cell cycle of INT 407 cells. C. jejuni increases the population of cells in the G1 cell cycle phase, as evident from the percent of cells in the G1 and S phases. Additionally, the CiaC effector contributes to the reduced rate of cell cycle progression. Cells were treated with RO-3306 to promote cell cycle synchronization in G2/M phase. The G2/M synchronized cells were infected with either (A) without C. jejuni, (B) with C. jejuni 81–176 wild-type strain (WT), and (C) C. jejuni 81–176 ciaC deletion mutant (∆ciaC) for 20 h. The top panels show the representative images from a single flow cytometry assay. The bottom panels show the percentages of cells in the G1, S, or G2/M phases of the cell cycle from three experiments completed on different days. The bars indicate the mean ± std dev. Statistical analysis was done with One-way ANOVA using Tukey’s multiple comparison test, P* < 0.05, P** < 0.01, P*** < 0.001, P**** < 0.0001, ns = non-significant
Fig. 3
Fig. 3
C. jejuni infection of INT 407 cells result in differential host cell gene expression. UMAP plots of gene expression data from scRNA-seq analysis of C. jejuni wild-type-infected (n = 1963), ∆ciaC-infected (n = 1676) and uninfected (n = 2230) cells. scRNA-seq data was plotted using the Seurat R package and color-coded to illustrate the distribution of uninfected control (red), C. jejuni wild-type-infected cells (green), and ∆ciaC-infected (blue) cells. All three cell groups are distinct and cluster separately, although infected cells associate more closely with each other than with uninfected control cells
Fig. 4
Fig. 4
Functional enrichment analysis of differentially expressed genes (DEGs) associated with uninfected (control) and C. jejuni-infected cells. Dot plots show results of analyzing DEGs more highly expressed in control cells (A, n = 529 DEGs) or C. jejuni-infected cells (B, n = 1032 DEGs). Dots are ordered by statistical significance on the y-axis and plotted by -log10xpadj on the x-axis. Dot sizes represent the number of DEGs associated with each term
Fig. 5
Fig. 5
Heatmaps of the most variably expressed genes [left side = uninfected (cn), middle = C. jejuni wild-type-infected cells (wt), right side = ∆ciaC-infected cells (ciac)]. Shown are the functional enrichment groups associated with the PLK1 pathway (genes associated with mitosis and cell-cycle progression), HIF-1 transcriptional activity (genes associated with hypoxic or oxidative stress), and IL-5 regulation of apoptosis (genes associated with inflammation and cytokine signaling). Plots show the 50 most variably expressed genes for each term (or all genes if the number is less than 50 within the functional group). Dendrograms show results of hierarchical clustering of gene expression pattern data derived from computing z-scores for each gene. Colors represent more highly expressed genes (red) or more lowly expressed genes (blue)
Fig. 6
Fig. 6
Violin plots of the expression of select genes. Genes shown are associated with pathways identified using functional enrichment analysis, including cell cycle (CDKN1A, CDKN3), regulation of inflammatory response (IRF1, IL18, CXCL8, PPARG, TGFB1), and cellular response to hypoxia (NDRG1). Colors show uninfected control cells (red), C. jejuni wild-type strain infected cells (green); and C. jejuni ∆ciaC mutant infected cells (blue)
Fig. 7
Fig. 7
Relative gene expression of INT 407 cells by RT-qPCR. Total RNA was extracted from the uninfected, C. jejuni 81–176 wild-type-infected and ∆ciaC-infected INT 407 cells and was used to determine the gene expression of selected cell cycle genes (CDKN1A, CDKN3), inflammatory response genes (IRF1, IL18, CXCL8, PPARG, TGFB1), and cellular response gene (NDRG1). Relative gene expression was calculated based on the expression of the housekeeping gene GAPDH. The results represent three biological replicates, and each qPCR was performed in triplicate wells. The comparison of gene expression was done using One-way ANOVA with Dunnett’s multiple comparison test (*P < 0.05, **P < 0.01, ***P < 0.001, ****P < 0.0001)
Fig. 8
Fig. 8
C. jejuni preferentially invades cells in the G1 cell cycle phase. Cells were incubated in medium without the drug or medium with either RO-3306 or lovastatin for 20 h. Following treatment, the cells were rinsed with fresh medium without drugs and infected with bacteria. Binding and internalization assays were done to determine the cell-associated and internalized bacteria. The y-axis indicates the total number of bacteria internalized per cell. Statistical analysis was done with One-way ANOVA with Dunnett’s multiple comparison test (**P < 0.01)
Fig. 9
Fig. 9
C. jejuni-paxillin colocalization increases in the G1 cell cycle phase. Cells were incubated in medium without drug (untreated) or medium with RO-3306 (G2/M synchronized) or lovastatin (G1/S synchronized) for 20 h. Following treatment, the cells were rinsed and infected with bacteria. INT 407 cells were incubated with C. jejuni for 45 min and processed for confocal microscopy. A C. jejuni-infected cells were stained with an α-C. jejuni polyclonal antibody and Alexa fluor 594 Donkey α-Rabbit secondary antibody (red), an α-paxillin specific antibody and FITC secondary antibody (green), and RedDot™2 Far-Red Nuclear Stain to visualize the nuclei (blue). Quantitation of C. jejuni co-localized with paxillin at (B) 75 min post-infection, and (C) 90 min post-infection. The values represent the percent of bacteria co-localized with paxillin. The asterisks indicate a significant difference in the percentages of bacteria co-localized with paxillin in treated cells compared to untreated cells. Statistical significance was done using One-way ANOVA with Dunnett’s multiple comparison test (**P < 0.01)
Fig. 10
Fig. 10
C. jejuni-infection of lovastatin-treated INT 407 cells results in a greater number of intracellular bacteria. INT 407 cells were incubated with C. jejuni for 18 h. A C. jejuni infected cells were stained with an α-C. jejuni polyclonal antibody and TRITC-labeled secondary antibody (red). LAMP-1 vesicles were stained with a LAMP-1 Mab and FITC-labeled secondary antibody (green). Circles highlight highly infected C. jejuni cells. B A brightness threshold was set in ImageJ to select bacteria and quantify the area occupied by them in four randomly selected image fields for each group. Values were then normalized by the number of INT 407 cells in each image. Statistical significance was evaluated using an ANOVA followed by a Tukey’s HSD post-hoc test. Values for C. jejuni-inoculation of lovastatin-treated INT 407 cells were highly significantly greater than those obtained from untreated (P < 0.01) and RO3306-treated cells (P < 0.05)
Fig. 11
Fig. 11
C. jejuni promotes increased secretion of the pro-inflammatory cytokine IL-8 in the G1 cell cycle phase. C. jejuni infection of cells treated with lovastatin (G1 arrest) results in an increased amount of the pro-inflammatory cytokine IL-8 in the supernatant when compared to C. jejuni infection of cells treated with RO-3306 (G2/M synchronized) and untreated (asynchronized) cells. Cells were infected with C. jejuni as outlined in Materials and Methods. Controls consisted of PMA and ionomycin (PMA/IO) treated cells to induce IL-8 secretion and untreated, uninfected cells. The supernatant fluids were collected at various time-points indicated in the figures and levels of IL-8 were determined by ELISA. Shown is the mean ± std dev. from 4 individual samples for each sample (white open bars = untreated, infected cells, light gray bars = RO-3306-treated, C. jejuni-infected cells, dark gray bars = lovastatin-treated, C. jejuni-infected cells), where the background level of IL-8 from the untreated, uninfected cells was subtracted from all values. The amount of IL-8 in the supernatants of the PMA/IO treated cells (positive control) is shown on the right side of the panel (black bar). Shown is representative data collected from a single experiment. The asterisks indicate significant differences in IL-8 production compared to the untreated samples for a given time point. Statistical analysis was done using the unpaired t-test (*P < 0.05)

Similar articles

References

    1. Berridge MJ. Cell signalling biology: module 9 - cell cycle and proliferation. Biochem J. 2012;6. 10.1042/csb0001009.
    1. Nigg EA. Cyclin-dependent protein kinases: key regulators of the eukaryotic cell cycle. BioEssays. 1995;17(6):471–80. 10.1002/bies.950170603. (PubMed PMID: 7575488). - PubMed
    1. Nougayrede JP, Taieb F, De Rycke J, Oswald E. Cyclomodulins: bacterial effectors that modulate the eukaryotic cell cycle. Trends Microbiol. 2005;13(3):103–10. 10.1016/j.tim.2005.01.002. (PubMed PMID: 15737728). - PubMed
    1. Fan Y, Sanyal S, Bruzzone R. Breaking bad: how viruses subvert the cell cycle. Front Cell Infect Microbiol. 2018;8:396. 10.3389/fcimb.2018.00396. PubMed PMID: 30510918; PMCID: PMC6252338. Epub 20181119. - PMC - PubMed
    1. Oswald E, Nougayrede JP, Taieb F, Sugai M. Bacterial toxins that modulate host cell-cycle progression. Curr Opin Microbiol. 2005;8(1):83–91. 10.1016/j.mib.2004.12.011. (PubMed PMID: 15694861). - PubMed

MeSH terms

LinkOut - more resources