. 2025 Jul 17;16(1):101.
doi: 10.1186/s40104-025-01231-8.

SIRT3 mediates CPT2 delactylation to enhance mitochondrial function and proliferation in goat granulosa cells

Affiliations

SIRT3 mediates CPT2 delactylation to enhance mitochondrial function and proliferation in goat granulosa cells

Shuaifei Song et al. J Anim Sci Biotechnol. .

Abstract

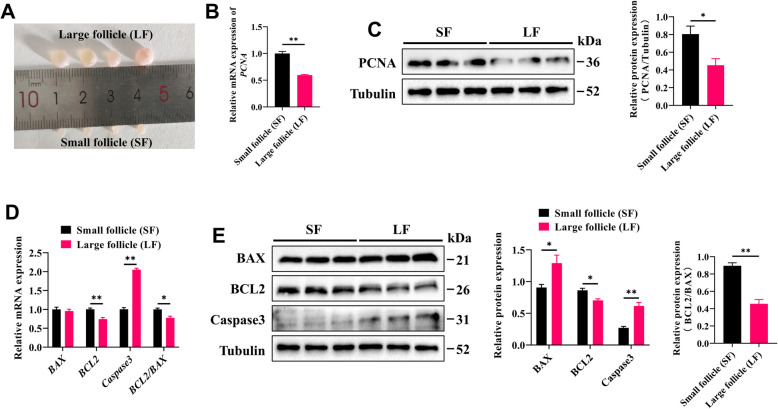
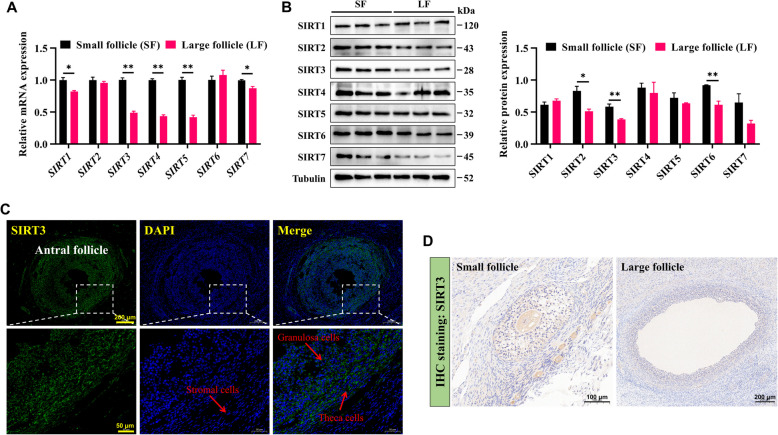
Background: Reproductive efficiency in goats is closely linked to the healthy development of follicles, with the proliferation of ovarian granulosa cells (GCs) playing a crucial role in this process. Sirtuin 3 (SIRT3), an enzyme that catalyzes post-translational modifications (PTMs) of proteins, is known to regulate a variety of mitochondrial metabolic pathways, thereby affecting cell fate. However, the specific effect of SIRT3 on the follicular development process remains unclear. Therefore, this study aimed to investigate the regulatory role of SIRT3 in the mitochondrial function and proliferation of goat GCs, as well as the underlying mechanisms involved.

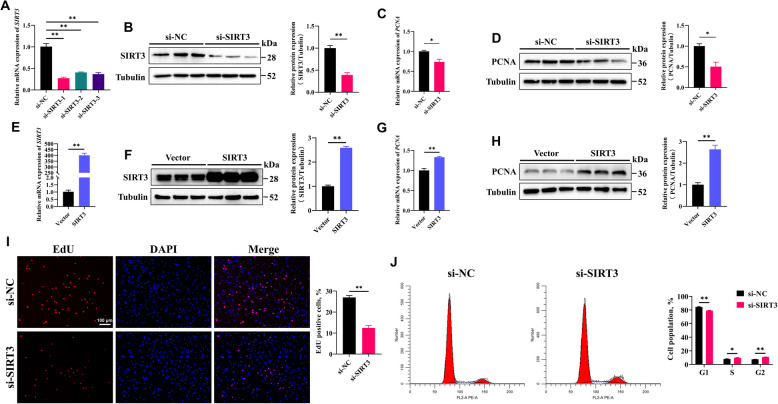
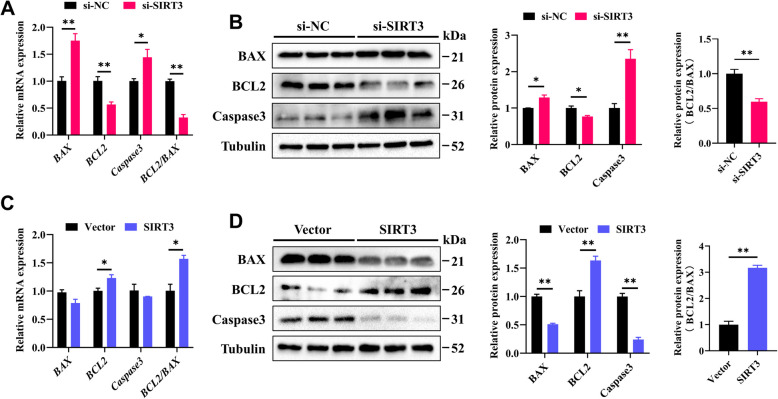
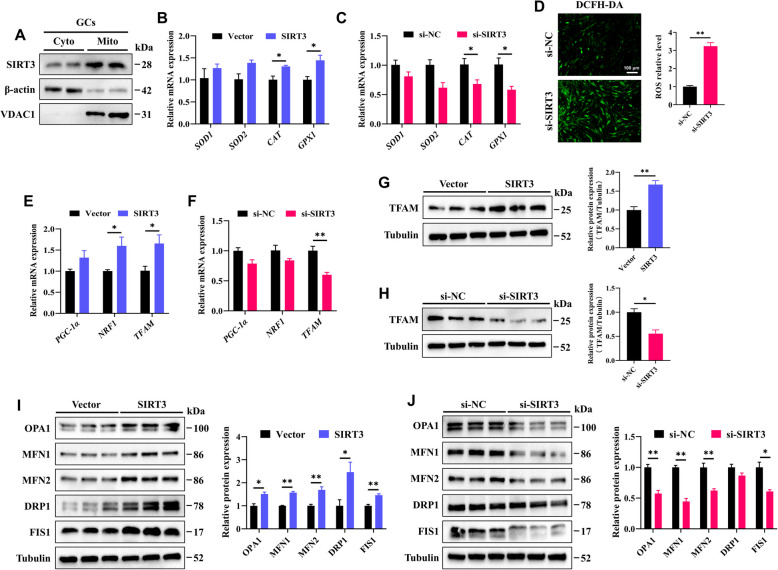
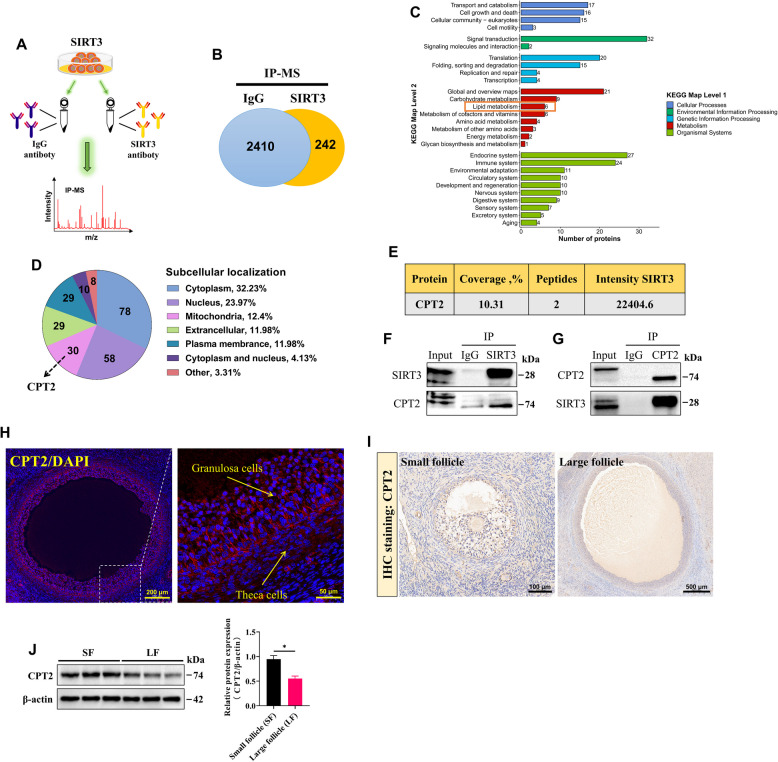
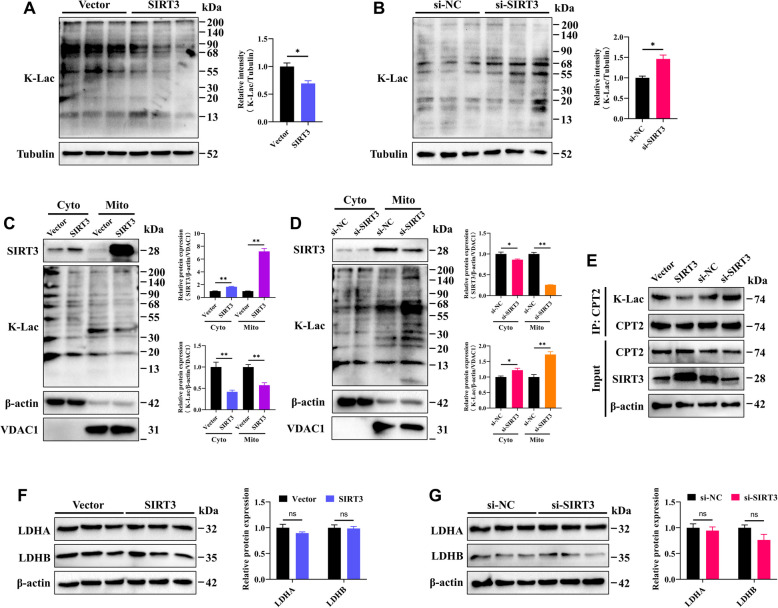
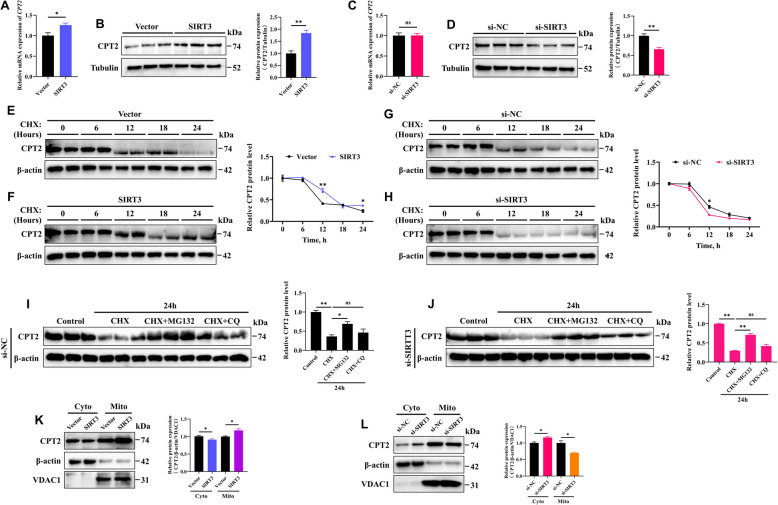
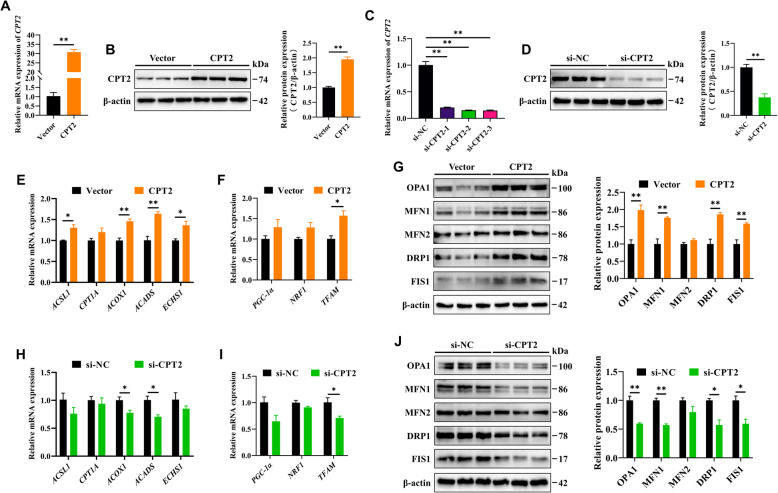
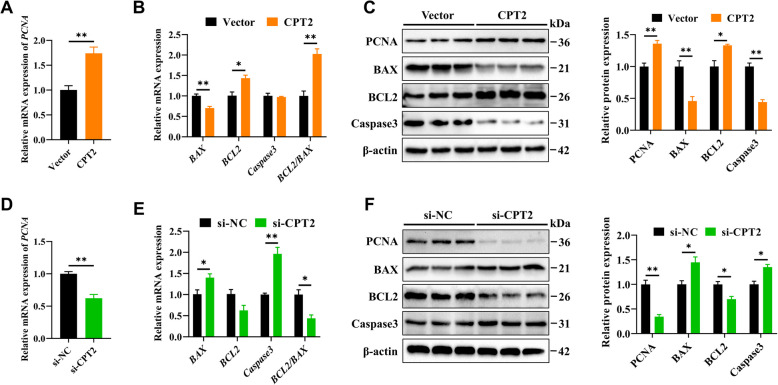
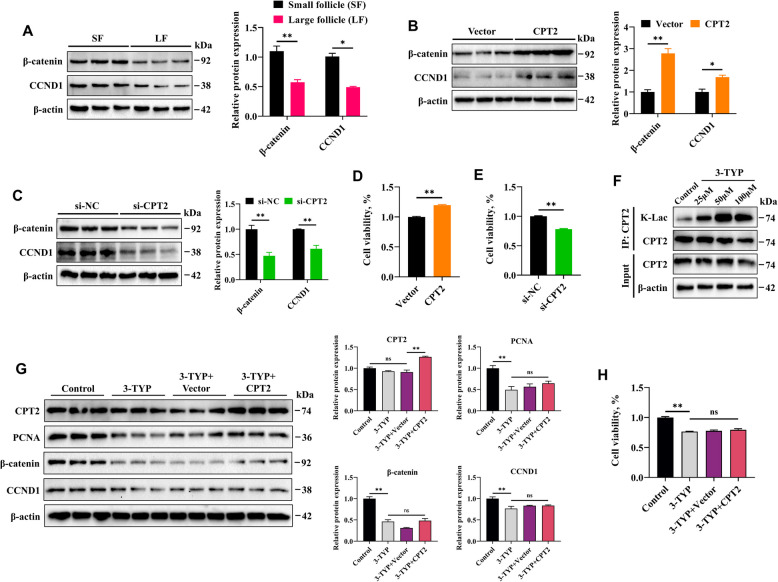
Results: In this study, GCs from small follicles in goat ovaries presented increased proliferative potential and elevated SIRT3 expression levels compared with those from large follicles. In vitro, SIRT3 overexpression enhanced mitochondrial function, promoted proliferation and inhibited apoptosis in GCs. Correspondingly, the inhibition of SIRT3 led to the opposite effects. Notably, SIRT3 interacted with carnitine palmitoyl transferase 2 (CPT2) and stabilized the CPT2 protein by mediating delactylation, which prolonged the half-life of CPT2 and prevented its degradation. Further investigation revealed that CPT2 overexpression enhanced fatty acid β-oxidation and mitochondrial function in GCs. Additionally, CPT2 promoted the proliferation of GCs by increasing the protein levels of β-catenin and its downstream target, cyclin D1 (CCND1). However, this effect was reversed by 3-TYP (a SIRT3 inhibitor).

Conclusions: SIRT3 stabilizes CPT2 protein expression through delactylation, thereby enhancing mitochondrial function and the proliferative capacity of GCs in goats. This study provides novel insights into the molecular mechanisms and regulatory pathways involved in mammalian follicular development.

Keywords: CPT2; Delactylation; Mitochondrial function; Ovarian granulosa cells; Proliferation; SIRT3.


Conflict of interest statement

Declarations. Ethics approval and consent to participate: All animal procedures used in this study were approved by the Animal Ethics Committee of Southwest University, and the approval number is IACUC-20220915-01. Consent for publication: Not applicable. Competing interests: The authors declare that they have no competing interests.

Figures

Fig. 1
Fig. 1
GCs derived from small follicles exhibited increased proliferation potential. A Representative image of small follicles (SF) and large follicles (LF) in goat ovaries. B The mRNA expression levels of PCNA in GCs from small and large follicles were quantified by RT-qPCR. C The protein expression level of PCNA in GCs was analyzed by Western blotting. D The mRNA expression levels of apoptosis-related genes, including BAX, BCL2, and Caspase3, were quantified by RT-qPCR. E Western blot analysis of apoptosis-related proteins in GCs. The data are presented as the mean ± SEM of three independent experiments. Statistical significance was determined using Student’s t-test, *P < 0.05, **P < 0.01
Fig. 2
Fig. 2
SIRT3 is highly expressed in GCs derived from small follicles. A The mRNA expression levels of Sirtuins (SIRT1‒7) in GCs from small and large follicles were quantified by RT-qPCR. B Relative protein expression levels of SIRT1‒7 in GCs from small follicles and large follicles. C Representative images of immunofluorescence staining for SIRT3 in goat ovaries; scale bar = 200 μm (top) and 50 μm (bottom). D Representative images of immunohistochemical staining for SIRT3 in goat ovaries; scale bar = 100 μm (left) and 200 μm (right). The data are presented as the mean ± SEM of three independent experiments. Statistical significance was determined using Student’s t-test, *P < 0.05, **P < 0.01
Fig. 3
Fig. 3
SIRT3 promotes the proliferation of GCs. A and B SIRT3 knockdown efficiency was confirmed after transfection with si-SIRT3 compared with si-NC for 48 h. C and D Relative mRNA and protein expression levels of PCNA in GCs following SIRT3 knockdown. E and F SIRT3 overexpression efficiency was confirmed after transfection with the overexpression plasmid for 48 h. G and H Relative mRNA and protein expression levels of PCNA in GCs following SIRT3 overexpression. I EdU staining assay of GCs following SIRT3 knockdown. Positive cells were stained with EdU in red, and cell nuclei were dyed with DAPI in blue; scale bar = 100 μm. J The cell cycle distribution of GCs was analyzed by flow cytometry. The data are presented as the mean ± SEM of three independent experiments. Statistical significance was determined using Student’s t-test, *P < 0.05, **P < 0.01
Fig. 4
Fig. 4
SIRT3 inhibits the apoptosis of GCs. A The mRNA expression levels of BAX, BCL2, and Caspase3 in GCs following SIRT3 knockdown. B The protein expression levels of BAX, BCL2, and Caspase3 in GCs were analyzed by Western blotting following SIRT3 knockdown. C The mRNA expression of BAX, BCL2, and Caspase3 in GCs following SIRT3 overexpression. D The protein expression levels of BAX, BCL2, and Caspase3 in GCs were analyzed by Western blotting following SIRT3 overexpression. The data are presented as the mean ± SEM of three independent experiments. Statistical significance was determined using Student’s t-test, *P < 0.05, **P < 0.01
Fig. 5
Fig. 5
SIRT3 enhances mitochondrial function in GCs. A Expression and localization of the SIRT3 protein in the cytoplasm (Cyto) and mitochondria (Mito) of GCs. and C The mRNA expression levels of oxidative stress-related genes (SOD1, SOD2, CAT, and GPX1) were quantified by RT-qPCR. D Total ROS levels in GCs transfected with si-NC or si-SIRT3 were measured using DCFH-DA; scale bar = 100 μm. and F The mRNA levels of mitochondrial biogenesis-related genes (PGC-1α, NRF1, and TFAM) were quantified by RT-qPCR. and H Relative expression of the TFAM protein in GCs following different treatments. and J Relative expression levels of mitochondrial dynamics-related proteins (OPA1, MFN1, MFN2, DRP1, and FIS1) in GCs following different treatments. The data are presented as the mean ± SEM of three independent experiments. Statistical significance was determined using Student’s t-test, *P < 0.05, **P < 0.01
Fig. 6
Fig. 6
SIRT3 protein interacts with the CPT2 protein. A Overview of IP‒MS analysis of GCs (n = 1). B Proteins were identified by coimmunoprecipitation with SIRT3 and IgG antibodies in GCs. C KEGG pathway analysis of the identified proteins. D Subcellular localization analysis of the identified proteins. E Intensity of the interaction between SIRT3 and CPT2 in the IP‒MS. and G Co-IP assay was used to reveal the interaction between SIRT3 and CPT2. H Representative images of immunofluorescence staining for CPT2 in goat ovaries; scale bar = 200 μm (left) and 50 μm (right). I Representative images of immunohistochemical staining for CPT2 in goat ovaries; scale bar = 100 μm (left) and 500 μm (right). J The protein expression levels of CPT2 in GCs from small follicles (SF) and large follicles (LF) were analyzed by Western blotting. The data are presented as the mean ± SEM of three independent experiments. Statistical significance was determined using Student’s t-test, *P < 0.05
Fig. 7
Fig. 7
SIRT3 mediates the delactylation of CPT2. A The levels of K-Lac in GCs following SIRT3 overexpression were quantified. B The levels of K-Lac in GCs following SIRT3 knockdown. C The levels of K-Lac in the cytoplasm (Cyto) and mitochondria (Mito) of GCs following SIRT3 overexpression. D The levels of K-Lac in the Cyto and Mito of GCs following SIRT3 knockdown. E Immunoprecipitation of protein extracts from different treatment groups was performed with an anti-CPT2 antibody, followed by immunoblot analysis with an anti-K-Lac antibody. and G Relative protein expression levels of LDHA and LDHB in GCs after different treatments. The data are presented as the mean ± SEM of three independent experiments. Statistical significance was determined using Student’s t-test, *P < 0.05, **P < 0.01, ns, not significant
Fig. 8
Fig. 8
SIRT3 enhances the stability of the CPT2 protein. A and B Relative mRNA and protein expression levels of CPT2 in GCs following SIRT3 overexpression. and D Relative mRNA and protein levels of CPT2 in GCs following SIRT3 knockdown. and F The protein expression levels of CPT2 were analyzed in GCs treated with vector or SIRT3 overexpression, followed by treatment with 20 µg/mL cycloheximide (CHX) for the indicated times. and H The protein expression levels of CPT2 were analyzed in GCs treated with si-NC or si-SIRT3, followed by treatment with 20 µg/mL CHX for the indicated times. and J CHX (20 µg/mL) was added to the GCs following transfection with si-NC and si-SIRT3, and CQ (30 µmol/L) or MG132 (20 µmol/L) was added simultaneously for 24 h. The expression of CPT2 was analyzed by Western blotting. and L The protein expression and localization of CPT2 in the cytoplasm (Cyto) and mitochondria (Mito) in GCs following SIRT3 overexpression or knockdown. The data are presented as the mean ± SEM of three independent experiments. Statistical significance was determined using Student’s t-test, *P < 0.05, **P < 0.01, ns, not significant
Fig. 9
Fig. 9
CPT2 enhances mitochondrial FAO and dynamics in GCs. and B The overexpression efficiency of CPT2 was confirmed following transfection for 48 h. and D The efficiency of CPT2 inhibition was confirmed following transfection with si-CPT2 or si-NC for 48 h. E The mRNA expression levels of FAO-related genes, including ACSL1, CPT1A, ACOX1, ACADS, and ECHS1, were detected by RT-qPCR in GCs after overexpression of CPT2. F The mRNA levels of PGC-1α, NRF1, and TFAM in GCs following CPT2 overexpression. G Relative protein levels of OPA1, MFN1, MFN2, DRP1, and FIS1 in GCs after overexpression of CPT2. H The mRNA levels of FAO-related genes in GCs following CPT2 knockdown. I The mRNA levels of PGC-1α, NRF1, and TFAM in GCs following CPT2 knockdown. J Relative protein levels of OPA1, MFN1, MFN2, DRP1, and FIS1 in GCs following CPT2 knockdown. The data are presented as the mean ± SEM of three independent experiments. Statistical significance was determined using Student’s t-test, *P < 0.05, **P < 0.01
Fig. 10
Fig. 10
CPT2 promotes the proliferation of GCs. A The mRNA levels of PCNA in GCs following CPT2 overexpression. B The mRNA levels of BAX, BCL2, and Caspase3 in GCs following CPT2 overexpression. C The protein levels of PCNA, BAX, BCL2, and Caspase3 in GCs following CPT2 overexpression. D The mRNA levels of PCNA in GCs following CPT2 knockdown. E The mRNA levels of BAX, BCL2, and Caspase3 in GCs following CPT2 knockdown. F The protein levels of PCNA, BAX, BCL2, and Caspase3 in GCs following CPT2 knockdown. The data are presented as the mean ± SEM of three independent experiments. Statistical significance was determined using Student’s t-test, *P < 0.05, **P < 0.01
Fig. 11
Fig. 11
CPT2 promotes GC proliferation via the β-catenin/CCND1 pathway. A The protein levels of β-catenin and CCND1 in GCs from small follicles (SF) and large follicles (LF) were analyzed by Western blotting. B The protein levels of β-catenin and CCND1 in GCs following CPT2 overexpression were analyzed by Western blotting. C The protein levels of β-catenin and CCND1 in GCs following CPT2 knockdown were analyzed by Western blotting. D and E CCK-8 assay for detecting cell viability. F Immunoprecipitation was used to analyze the effects of different concentrations of 3-TYP on the K-Lac level of CPT2. G Relative protein expression levels of CPT2, PCNA, β-catenin, and CCND1 in GCs following different treatments. H CCK-8 assay for detecting cell viability following different treatments. The data are presented as the mean ± SEM of three independent experiments. Statistical significance was determined using Student’s t-test, *P < 0.05, **P < 0.01

Similar articles

References

    1. Chen W, Han Y, Chen Y, Liu X, Liang H, Wang C, et al. Potential candidate genes associated with litter size in goats: a review. Animals. 2025;15(1):82. - PMC - PubMed
    1. Liu W, Chen C, Gao Y, Cui X, Zhang Y, Gu L, et al. Transcriptome dynamics and cell dialogs between oocytes and granulosa cells in mouse follicle development. Genom Proteom Bioinform. 2024;22(2):qzad001. - PMC - PubMed
    1. Wang H, Huang Z, Shen X, Lee Y, Song X, Shu C, et al. Rejuvenation of aged oocyte through exposure to young follicular microenvironment. Nat Aging. 2024;4(9):1194–210. - PubMed
    1. Khan S, Jamal MA, Khan IM, Ullah I, Jabbar A, Khan NM, et al. Factors affecting superovulation induction in goats (Capra hericus): an analysis of various approaches. Front Vet Sci. 2023;10:1152103. - PMC - PubMed
    1. Zhao Z, Zou X, Lu T, Deng M, Li Y, Guo Y, et al. Identification of mRNAs and lncRNAs involved in the regulation of follicle development in goat. Front Genet. 2020;11:589076. - PMC - PubMed

LinkOut - more resources