. 2025 Jul 16;16(1):382.
doi: 10.1186/s13287-025-04449-5.

Endothelial cell-secreted bone targeting exosomes promote angiogenesis coupling with osteogenesis via the PERK-ATF4-CRELD2 pathway

Affiliations

Endothelial cell-secreted bone targeting exosomes promote angiogenesis coupling with osteogenesis via the PERK-ATF4-CRELD2 pathway

Zhilong Pi et al. Stem Cell Res Ther. .

Abstract

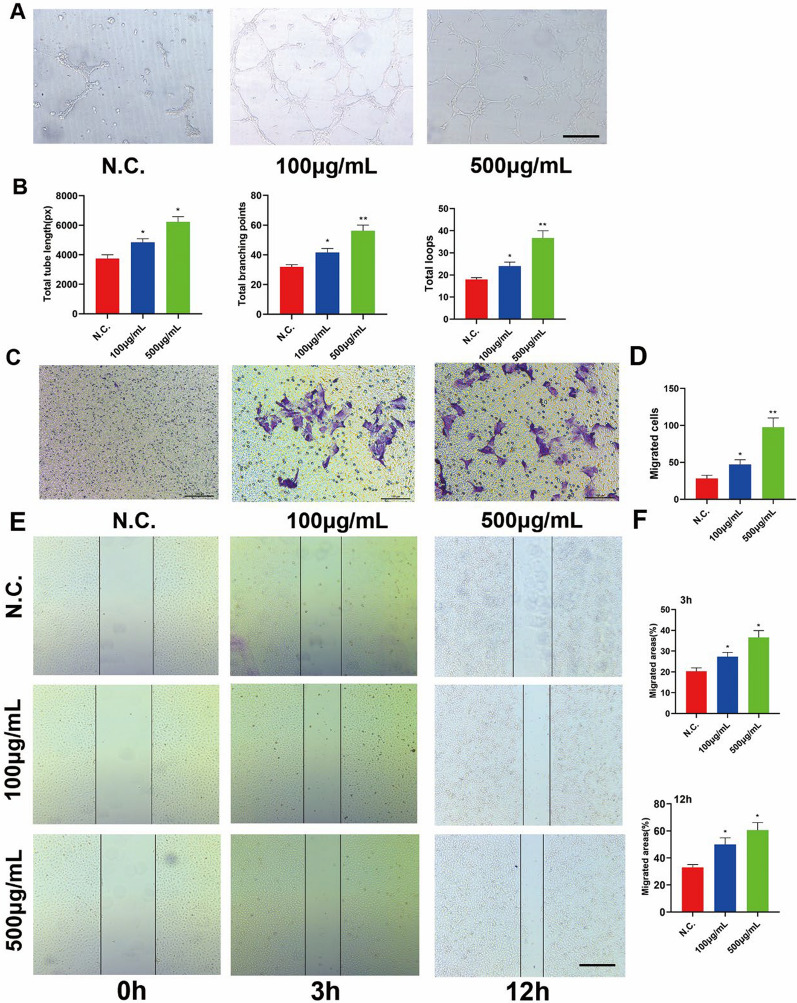
The role of endoplasmic reticulum (ER) stress in bone metabolism and the management of associated diseases has garnered significant interest. However, its role in regulating bone homeostasis and skeletal development remains largely unclear. Osteoblast development and bone formation are enhanced by a particular subtype of CD31hi endomucinhi (CD31hiEMCNhi) endothelium. However, it is still unclear how endothelial exosomes contribute to the production of CD31hiEMCNhi endothelium and bone formation. This research revealed that human umbilical vein endothelial cells (HUVECs)-exosomes (Exos) enhanced the formation of osteoblast and angiogenic effects in vitro. Furthermore, in mice treated with HUVECs-Exos, osteoblast production, and CD31hiEmcnhi vessels were significantly increased. The mechanism by which HUVECs-Exos CRELD2 improved angiogenesis coupling with osteogenesis involved triggering the PERK-ATF4-CRELD2 pathway's ER stress. As a result, HUVECs-Exos CRELD2 may be used as a potential bone metabolic disease nanodrug.

Keywords: Angiogenesis; CRELD2; Endoplasmic reticulum stress; Endothelium; Exosome; Osteogenesis.


Conflict of interest statement

Declarations. Ethics approval and consent to participate: This study was approved by the Medical Research Ethics Board of the General Hospital of Southern Theater Command of PLA (title: exosomal CRELD2 promotes angiogenesis and osteogenesis via the PERK-ATF4-CRELD2 pathway. Approval number: No. 2023110101. Date of approval: 20231101). All methods were carried out in accordance with relevant guidelines and regulations. HUVECs were purchased from a commercial vendor (Procell, China), which information and ethics can be found on its official website (Information and ethics can be found on its official website ( https://www.procell.com.cn/view/2230.html ). Consent for publication: Not applicable. Competing interests: The authors declare that they have no conflicts of interest. The authors declare that they have not use AI-generated work in this manuscript.

Figures

Fig. 1
Fig. 1
BMSC osteogenesis was stimulated by HUVEC-Exos. A Representative TEM of Exos (scale bar = 500 nm). B Nanoparticle tracking analysis of HUVEC-Exos. C Representative western blot images of Exos classical markers (TSG101, CD9 and CD63) D Representative IF analysis of BMSCs treated with DiO-labelled HUVEC-Exos for 2 h. Scale bar: 100 μm. E Representative images of ALP (top) and ARS staining (bottom) in BMSCs treated with different concentrations of HUVEC-Exos. Scale bar: 100 μm. F Quantitative assessment of the positive ALP area (left) and ARS area (right) in Fig. 1D. G qRT-PCR analysis of the relative levels of BGLAP and Alp mRNA expression in BMSCs at day 14. (*p < 0.05, **p < 0.01)
Fig. 2
Fig. 2
BMEC angiogenesis was enhanced by HUVEC-Exos. A Representative images of the tube formation assay in BMECs. Scale bar: 100 μm. B Quantitative analyses of the total tube length, total branching points, and total loops in Fig. 2A. n = 4 per group. C Representative images of Transwell assays. Scale bar: 100 μm. D Quantitative analyses of migrated cells in Fig. 2C. n = 4 per group. E Representative images of wound-healing assay. F Quantitative analyses of migration area (%) in Fig. 2E. Scale bar: 100 μm. n = 4 per group. *p < 0.05, **p < 0.01
Fig. 3
Fig. 3
HUVEC-Exos promoted CD31hiEmcnhi vessels and bone formation in ovx mice. A Ex vivo fluorescent imaging of the DIR-labeled HUVEC-Exos in different tissues after intravenous injection to mice for 3 h and 12 h. Scale bar: 5 mm. B Representative micro-CT imaging of femora from OVX mice injected with PBS or HUVEC-Exos. Scale bar: 100 μm. n = 5 per group. C Quantification of bone microstructural parameters of femurs from mice in Fig. 3B. D Representative images of CD31 (green), Emcn (red) immunostaining of femora from OVX mice injected with PBS or HUVEC-Exos. Scale bar: 100 μm. n = 5 per group. E Quantification of CD31, Emcn immunostained in Fig. 3D. F Representative H&E staining images in femora from OVX and OVX + HUVEC-Exos mice. Scale bar: 100 μm. n = 5 per group. G Quantification of adipocytes in distal femoral metaphysis regions from OVX and OVX + HUVEC-Exos mice. *p < 0.05, **p < 0.01
Fig. 4
Fig. 4
HUVEC-Exosomal Creld2 promoted osseous formation coupling with angiogenesis via down-regulating endoplasmic reticulum stress from Perk⁃Atf4-Creld2 pathway. A mRNA sequencing results of dysregulated mRNAs in BMSCs treated with PBS or HUVEC-Exos. B qRT-PCR analysis of the relative levels of Creld2 in N.C. and HUVEC-Exos. C Western blot analysis of Creld2 in BMSCs treated with PBS or HUVEC-Exos. D Representative images of ATF4 (green), Nucleus (blue) co-immunostaining or Pperk (green), Nucleus (blue) co-immunostaining of femora from OVX mice injected with PBS or HUVEC-Exos. Scale bar: 100 μm. n = 5 per group. E Quantification of ATF4 (left) and Pperk (right) immunostained in Fig. 4D F qRT-PCR analysis of the relative levels of ATF4 and Pperk. G Western blot analysis of ATF4 and Pperk in BMSCs treated with PBS or HUVEC-Exos. *p < 0.05, **p < 0.01
Fig. 5
Fig. 5
Creld2 promoted osteoblast differentiation and angiogenic effects in vitro. A qRT-PCR analysis of the relative levels of Creld2. B Representative images of ALP (top) and ARS staining (bottom) in BMSCs treated with N.C. or Creld2 Recombinant protein. Scale bar: 100 μm. C Quantitative assessment of the positive ALP area (left) and ARS area (right) in Fig. 5B. D qRT-PCR analysis of the relative levels of Creld2. E Representative images of the tube formation assay in BMECs. Scale bar: 100 μm. F Quantitative analyses of the total tube length, total branching points, and total loops in Fig. 5E. n = 4 per group. G Representative images of Transwell assays. Scale bar: 100 μm. H Quantitative analyses of migrated cells in Fig. 5G. n = 4 per group. I Representative images of wound-healing assay. Scale bar: 100 μm. J Quantitative analyses of migration area (%) in Fig. 5I. Scale bar: 100 μm. n = 4 per group. *p < 0.05, **p < 0.01
Fig. 6
Fig. 6
Creld2 enhanced bone formation in vivo. A Representative micro-CT imaging of femora from OVX mice injected with PBS or Creld2 Recombinant protein. Scale bar: 100 μm. n = 5 per group. B Quantification of bone microstructural parameters of femurs from mice in Fig. 6A. C Representative images of CD31 (green), Emcn (red) immunostaining of femora from OVX mice injected with PBS or Creld2 Recombinant protein. Scale bar: 100 μm. n = 5 per group. D Quantification of CD31, Emcn immunostained in Fig. 6C. E Representative H&E staining images in femora from OVX mice injected with PBS or Creld2 Recombinant protein. Scale bar: 100 μm. n = 5 per group. F Quantification of adipocytes in distal femoral metaphysis regions from OVX mice injected with PBS or Creld2 Recombinant protein. *p < 0.05, **p < 0.01
Fig. 7
Fig. 7
Administration of exosomal Creld2 promotes angiogenesis and osteogenesis in vivo. A Fluorescence microscopy analysis of BMSCs treated with DiO-labelled HUVEC-Exosomal Creld2 for 2 h. Scale bar: 100 μm. B Representative micro-CT imaging of femora from OVX mice injected with Exos or exosomal Creld2. Scale bar: 100 μm. n = 5 per group. C Quantification of bone microstructural parameters of femurs from mice in Fig. 7A. D Representative images of CD31 (green), Emcn (red) immunostaining of femora from OVX mice injected with Exos or exosomal Creld2. Scale bar: 100 μm. n = 5 per group. E Quantification of CD31, Emcn immunostained in Fig. 7C. F Representative H&E staining images in femora from OVX mice injected with PBS or exosomal Creld2. Scale bar: 100 μm. n = 5 per group. G Quantification of adipocytes in distal femoral metaphysis regions from OVX mice injected with PBS or exosomal Creld2. *p < 0.05, **p < 0.01

Similar articles

References

    1. Wang R, Zhang H, Ding W, Fan Z, Ji B, Ding C, Ji F, Tang H. miR-143 promotes angiogenesis and osteoblast differentiation by targeting HDAC7. Cell Death Dis. 2020;11(3):179. - PMC - PubMed
    1. Ramasamy SK, Kusumbe AP, Itkin T, Gur-Cohen S, Lapidot T, Adams RH. Regulation of hematopoiesis and osteogenesis by blood vessel-derived signals. Annu Rev Cell Dev Biol. 2016;32:649–75. - PubMed
    1. Lin X, Xu F, Zhang KW, Qiu WX, Zhang H, Hao Q, Li M, Deng XN, Tian Y, Chen ZH, et al. Acacetin prevents bone loss by disrupting osteoclast formation and promoting type H vessel formation in ovariectomy-induced osteoporosis. Front Cell Dev Biol. 2022;10: 796227. - PMC - PubMed
    1. Gao L, Chen W, Li L, Li J, Kongling W, Zhang Y, Yang X, Zhao Y, Bai J, Wang F. Targeting soluble epoxide hydrolase promotes osteogenic-angiogenic coupling via activating SLIT3/HIF-1alpha signalling pathway. Cell Prolif. 2023;56(7): e13403. - PMC - PubMed
    1. Lei H, Guo W, Pan Y, Lu X, Zhang Q. LOX-1 regulation of H-type vascular endothelial cell regeneration in hyperglycemia. Acta Diabetol. 2024;61(4):515–24. - PubMed

LinkOut - more resources