

Drug Interaction PBPK Modeling: Review of the Literature Exposes the Need for Increased Verification of Model Inputs and Outputs as Part of Credibility Assessment
- PMID: 40671325
- PMCID: PMC12267664
- DOI: 10.1111/cts.70299
Drug Interaction PBPK Modeling: Review of the Literature Exposes the Need for Increased Verification of Model Inputs and Outputs as Part of Credibility Assessment
Abstract
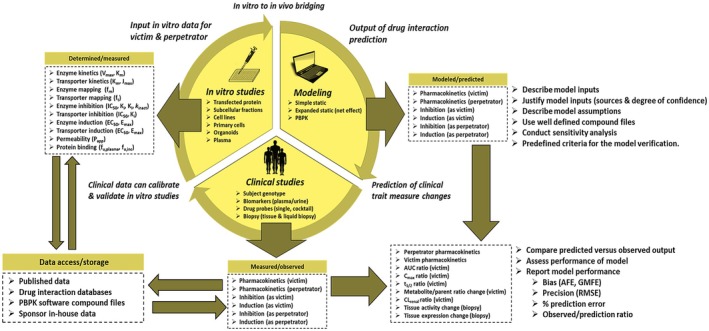
In vitro data are routinely used to support both static and physiologically based pharmacokinetic (PBPK) model-based drug-drug interaction (DDI) predictions. Such efforts are possible after years of rapid progress, enabled by the greater availability of in vitro reagents, kinetic models, and ready access to PBPK software packages with increased computing power supported by drug-specific compound files. While acknowledging the progress, however, various investigators have documented the challenges and pitfalls associated with PBPK modeling and have called for improved model verification, credibility assessment, and greater confidence building. As summarized in the current narrative, a review of the DDI literature does expose the need for PBPK model parameter (input and output) verification. Representative examples of PBPK-based modeling involving induction (cytochrome P450 (CYP) 3A4 and organic anion transporting polypeptide 1B1 and 1B3), pregnancy-associated upregulation (CYP2D6), and inhibition (CYP1A2-mediated metabolism and creatinine renal clearance) are described. The narrative also includes the clinical application of biomarkers (e.g., CYP3A4 and CYP2D6) and tissue biopsy expression profiling as a means of providing additional mechanistic information and DDI data that are independent and complementary to PBPK models. With the advent of in vitro microphysiological systems, biomarkers, burgeoning plasma-based (liquid) biopsy protocols, and the possibility of machine learning-enabled literature searches integrated with modeling software, it is envisioned that such tools could be used jointly to further enhance PBPK model verification efforts within a predefined credibility assessment framework. Ultimately, the goal is to deploy PBPK modeling with greater confidence in lieu of time and resource-intensive clinical DDI studies.
Keywords: PBPK; biopsy; drug interaction; induction; inhibition; modeling.
© 2025 Incyte and The Author(s). Clinical and Translational Science published by Wiley Periodicals LLC on behalf of American Society for Clinical Pharmacology and Therapeutics.
Conflict of interest statement
David Rodrigues and Christopher Gibson are employees and stockholders of Incyte Corporation, Wilmington, DE, USA. No artificial intelligence (AI) or AI‐related tools were used in the preparation of this manuscript.
The authors declare no conflicts of interest.
Figures


Similar articles
-
Physiologically based pharmacokinetic modeling of aldehyde oxidase drug-drug interactions mediated by erlotinib.Drug Metab Dispos. 2025 Aug;53(8):100113. doi: 10.1016/j.dmd.2025.100113. Epub 2025 Jun 23. Drug Metab Dispos. 2025. PMID: 40683226
-
Physiologically Based Pharmacokinetic (PBPK) Modeling and Simulation Approaches: A Systematic Review of Published Models, Applications, and Model Verification.Drug Metab Dispos. 2015 Nov;43(11):1823-37. doi: 10.1124/dmd.115.065920. Epub 2015 Aug 21. Drug Metab Dispos. 2015. PMID: 26296709 Free PMC article.
-
Prospective DDI Risk Assessment of Vicasinabin with PBPK Modeling by Integrating In Vitro Data.Clin Pharmacol Ther. 2025 Aug;118(2):428-437. doi: 10.1002/cpt.3686. Epub 2025 Apr 28. Clin Pharmacol Ther. 2025. PMID: 40294080
-
Management of urinary stones by experts in stone disease (ESD 2025).Arch Ital Urol Androl. 2025 Jun 30;97(2):14085. doi: 10.4081/aiua.2025.14085. Epub 2025 Jun 30. Arch Ital Urol Androl. 2025. PMID: 40583613 Review.
-
Short-Term Memory Impairment.2024 Jun 8. In: StatPearls [Internet]. Treasure Island (FL): StatPearls Publishing; 2025 Jan–. 2024 Jun 8. In: StatPearls [Internet]. Treasure Island (FL): StatPearls Publishing; 2025 Jan–. PMID: 31424720 Free Books & Documents.
References
-
- Santos L. G. A., Jaiswal S., Chen K. F., et al., “Real‐World Application of PBPK in Drug Discovery,” Drug Metabolism and Disposition (2023), 10.1124/dmd.122.001036. - DOI
-
- Templeton I. E., Jones N. S., and Musib L., “Pediatric Dose Selection and Utility of PBPK in Determining Dose,” AAPS Journal 20, no. 2 (2018): 31–39. - PubMed
-
- Jones H. M., Parrott N., Jorga K., and Lavé T., “A Novel Strategy for Physiologically Based Predictions of Human Pharmacokinetics,” Clinical Pharmacokinetics 45, no. 5 (2006): 511–542. - PubMed
-
- Sun Z., Zhao N., Zhao X., Wang Z., Liu Z., and Cui Y., “Application of Physiologically Based Pharmacokinetic Modeling of Novel Drugs Approved by the U.S. Food and Drug Administration,” European Journal of Pharmaceutical Sciences 200 (2024): 106838. - PubMed
Publication types
MeSH terms
Substances
LinkOut - more resources
Full Text Sources
Research Materials
