. 2025 Jul 8;53(13):gkaf658.
doi: 10.1093/nar/gkaf658.

Splice-modulating antisense oligonucleotides targeting a pathogenic intronic variant in adult polyglucosan body disease correct mis-splicing and restore enzyme activity in patient cells

Affiliations

Splice-modulating antisense oligonucleotides targeting a pathogenic intronic variant in adult polyglucosan body disease correct mis-splicing and restore enzyme activity in patient cells

Ria Thomas et al. Nucleic Acids Res. .

Abstract

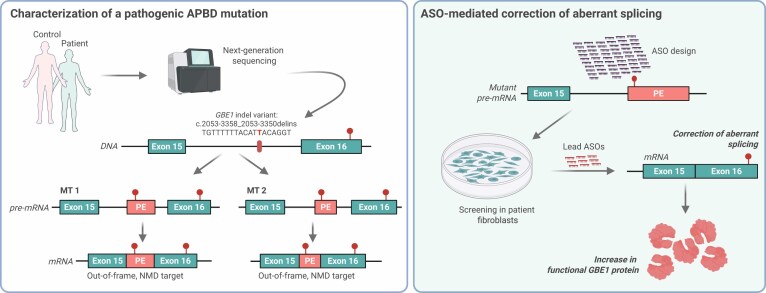
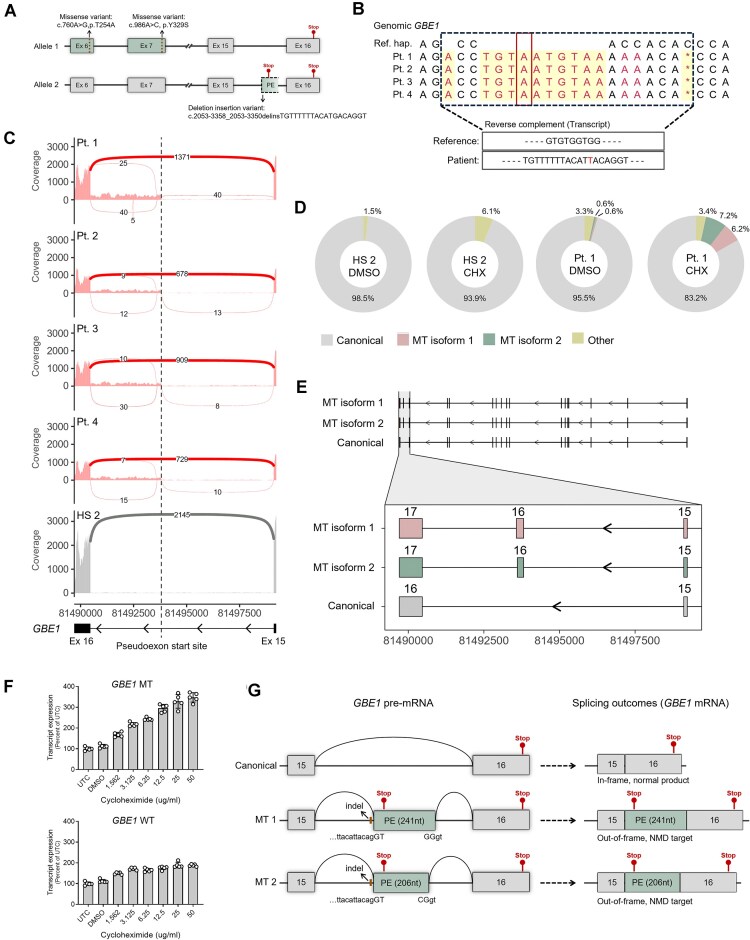
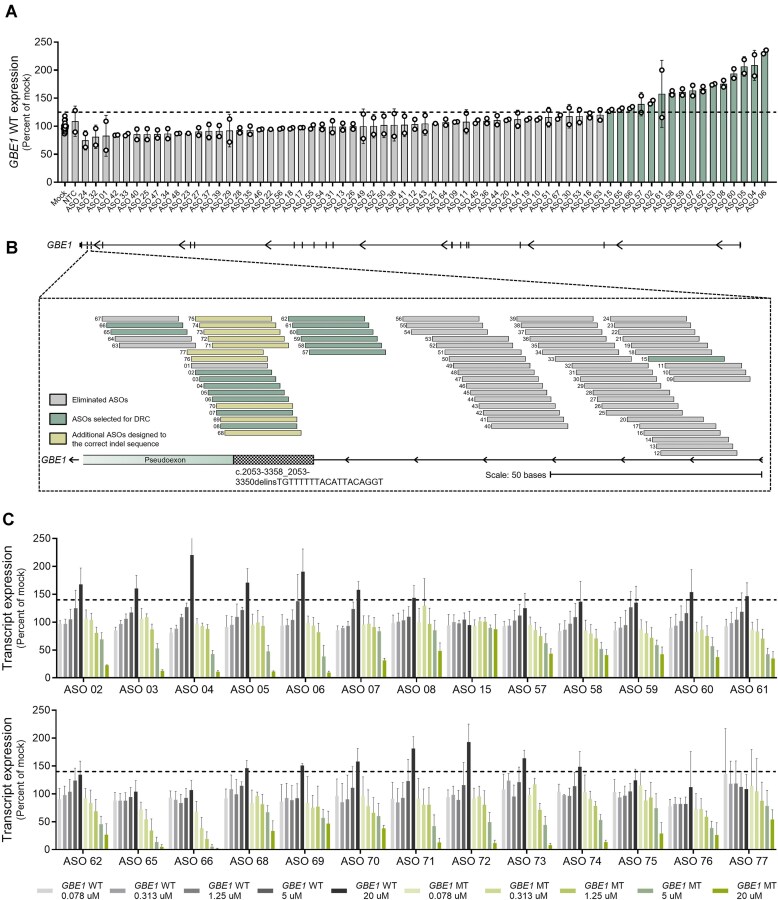
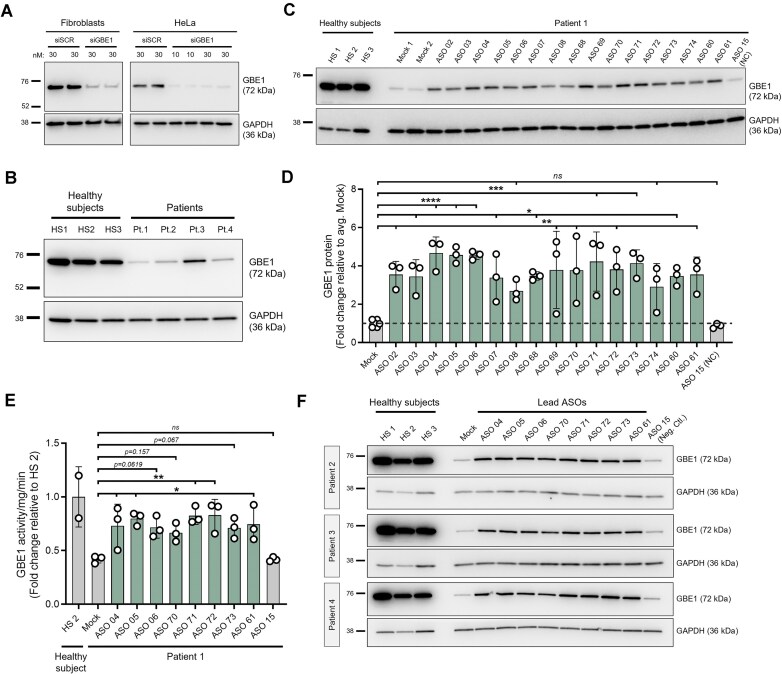
Adult polyglucosan body disease (APBD) is a rare, adult-onset neurodegenerative disorder caused by loss-of-function variants in the glycogen branching enzyme (GBE1) gene, essential for glycogen biosynthesis. The second most common pathogenic mutation in APBD (c.2053-3358_2053-3350delinsTGTTTTTTACATGACAGGT) is a deep intronic deletion insertion (indel) variant creating an ectopic splice acceptor site, resulting in a mutant transcript with a pseudoexon encoding an unstable truncated protein. Such mutations can be effectively targeted with splice-modulating antisense oligonucleotides (ASOs) to restore normal splicing. Here, we characterized the indel in-depth using long-read sequencing techniques and discovered several new features of the mutant transcript. The indel sequence varies from the previously identified sequence by a nucleotide, and the usage of the ectopic splice site results in two mutant isoforms, both of which are targets of cellular nonsense-mediated decay. High-throughput screening in patient-derived fibroblasts identified multiple lead candidates that effectively blocked the ectopic splice site and increased the canonical GBE1 transcript and protein. Functional analysis confirmed that treatment with the lead ASOs significantly improved GBE1 enzyme activity in patient cells, validating their therapeutic potential. Taken together, our data demonstrate the successful discovery of ASOs that correct mis-splicing, thus offering a promising treatment for a subset of APBD patients.


Conflict of interest statement

D.E.M. is on scientific advisory boards at Oxford Nanopore Technologies (ONT) and Basis Genetics, is engaged in a research agreement with ONT, has received research and travel support from ONT and PacBio, and holds stock options in MyOme and Basis Genetics. All n-Lorem authors are compensated by n-Lorem. S.T.C., Chairman and CEO of n-Lorem receives no compensation. As a nonprofit n-Lorem does not provide stock options or RSUs.

Figures

Graphical Abstract
Graphical Abstract
Figure 1.
Figure 1.
Characterization of the GBE1 MT variant. (A) Schematic depicting the missense and intronic indel mutations present in the GBE1 gene in our cohort of four APBD patients. Canonical exons are shown in boxes with solid line and the pseudoexon resulting from the usage of the ectopic splice site in the MT transcript is indicated by a box with discontinuous line. Ex = exon; PE = pseudoexon. (B) Reference haplotype (Ref. hap.) and the indel consensus sequence identified in each patient from phased WGS reads covering chr3:81493811-81493824. Bases with only 1 read were removed. Non-reference bases are in red, and indels are highlighted in yellow. Deletion is denoted by *. Reverse complement of the indel sequence is given below. (C) Sashimi plots comparing short-read RNA-seq reads from fibroblast samples from the four APBD patients (Pt. 1, Pt. 2, Pt. 3, Pt. 4) and a HS control (HS 2) at the GBE1 exon 15–16 locus (chr3:81489703-81499227). Arcs represent exon junctions with a minimum read count of 3. (D) Donut plots showing GBE1 isoform count proportions per sample. Two noncanonical isoforms have been grouped as “other.” (E) Transcript structure of GBE1 MT isoforms and the canonical isoform identified with long-read RNA-seq. Zoomed inset shows the pseudoexon with exon numbers for each transcript labeled above. (F) GBE1 WT and MT transcript expression in fibroblasts from Pt. 1 treated with varying concentrations of cycloheximide and vehicle control (DMSO) for 16 h. Expression levels were normalized to PPIA and are presented as percentage relative to mock treatment. Data represented as mean ± SD. (G) Schematic illustrating exon and pseudoexon boundaries at the mutation locus for canonical, MT1 and MT2 pre-mRNAs, and their splicing outcomes at the mRNA level.
Figure 2.
Figure 2.
Single-dose and dose-response screenings identify lead ASOs that modulate GBE1 transcripts in a concentration-dependent manner. (A) GBE1 WT transcript expression in fibroblasts from Pt. 1 treated with 67 ASOs (ASOs 1–67) at 20 μM for 16–20 h. A NTC control ASO was included as negative control. Data points represent technical replicates (2 per ASO). Expression levels were normalized to PPIA and are presented as percentage relative to mock treatment. Green bars represent the 16 ASOs that upregulated GBE1 WT transcript by 125% or 1.25-fold of mock (dashed line). (B) Schematic depicting alignment of all tested ASOs to the GBE1 transcript. The diagram shows ASOs that were eliminated during the single-dose screen, ASOs that were selected to proceed to DRC and the additional 10 ASOs (ASOs 68–77) that were designed to the correct indel sequence. (C) GBE1 WT and MT transcript expression measured by qRT-PCR in fibroblast cells from Pt. 1 treated with varying concentrations of ASOs (five-point, four-fold serial dilution starting at 20 μM) for 18–24 h (technical replicates = 4–12 per ASO/condition). Expression levels were normalized to PPIA and are presented as percentage relative to mock treatment. The dashed line represents a threshold of 140% or 1.4-fold of mock. All data are represented as mean ± SD.
Figure 3.
Figure 3.
ASO-mediated rescue of GBE1 protein and enzyme activity in patient cells. (A) Immunoblot performed on HS control fibroblast and HeLa cells treated with varying concentrations of scrambled (siSCR) or GBE1-targeting siRNA (siGBE1) for 3 days. (B) Immunoblot comparing baseline GBE1 expression between three HS control fibroblasts (HS1, HS2, HS3) and the four APBD patients (Pt.1, Pt.2, Pt.3, Pt.4). (C) Representative image and (D) quantitation of GBE1 protein levels in fibroblasts from Pt. 1 treated with the 16 lead ASOs at 40 μM for 4 days (n = 3 independent biological replicates). ASO 15 was included as a negative control (NC) and three HS fibroblast samples (HS 1, HS 2, HS 3) were included as positive controls. The dashed line represents fold change equal to 1. Statistical analysis comparing the means of all treatment conditions to the mean of Mock was performed using one-way ANOVA followed by Dunnett’s post hoc analysis. ns, p < .05; *p < .05; **p < .01; ***p< .001; ****p< .0001. (E) GBE1 enzyme activity measurement in patient fibroblast cells treated with lead ASOs at 40 μM for 4 days. ASO 15 was included as a negative control and a HS fibroblast sample (HS 2) was used as the positive control. The dashed line denotes fold change equal to 1. Data points represent independent biological replicates (n = 3). Statistical analysis comparing the means of all treatment conditions to the mean of Mock was performed using one-way ANOVA followed by Dunnett’s post hoc analysis. ns, p< .05; *p< .05, **p < .01. (F) Immunoblot was performed in Pt. 2, 3, and 4 fibroblasts treated with eight lead ASOs at 40 μM for 4 days. All data presented as mean ± SD. GAPDH was used as the loading control for all immunoblots.

Similar articles

References

    1. Mochel F, Schiffmann R, Steenweg ME et al. Adult polyglucosan body disease: natural history and key magnetic resonance imaging findings. Ann Neurol. 2012; 72:433–41. 10.1002/ana.23598. - DOI - PMC - PubMed
    1. Souza PVS, Badia BML, Farias IB et al. GBE1-related disorders: adult polyglucosan body disease and its neuromuscular phenotypes. J Inherit Metab Dis. 2021; 44:534–43. 10.1002/jimd.12325. - DOI - PubMed
    1. Zebhauser PT, Cordts I, Hengel H et al. Characterization of cognitive impairment in adult polyglucosan body disease. J Neurol. 2022; 269:2854–61. 10.1007/s00415-022-10960-z. - DOI - PMC - PubMed
    1. Dugue AG, Abreu NJ, Pillai C et al. Neuro-ophthalmic manifestations of adult polyglucosan body disease. J Neuroophthalmol. 2025; 45:55–62. 10.1097/WNO.0000000000002186. - DOI - PMC - PubMed
    1. Bigio EH, Weiner MF, Bonte FJ et al. Familial dementia due to adult polyglucosan body disease. Clin Neuropathol. 1997; 16:55–62. - PubMed

MeSH terms

Substances

Supplementary concepts

LinkOut - more resources