. 2025 Jul 8;53(13):gkaf666.
doi: 10.1093/nar/gkaf666.

Histone H3 N-terminal recognition by the PHD finger of PHRF1 is required for proper DNA damage response

Affiliations

Histone H3 N-terminal recognition by the PHD finger of PHRF1 is required for proper DNA damage response

Kanishk Jain et al. Nucleic Acids Res. .

Abstract

Plant homeodomain (PHD) fingers are critical effectors of histone post-translational modifications (PTMs), regulating gene expression and genome integrity, and are frequently implicated in human disease. While most PHD fingers recognize unmodified and methylated states of histone H3 lysine 4 (H3K4), the specific functions of many of the over 100 human PHD finger-containing proteins are poorly understood. Here, we present a comprehensive analysis of one such poorly characterized PHD finger-containing protein, PHRF1. Using biochemical, molecular, and cellular approaches, we demonstrate that PHRF1 robustly binds to histone H3, specifically at its N-terminal region. Through integrating RNA-seq and proteomic analyses, we show that PHRF1 regulates transcription and RNA splicing and plays a critical role in DNA damage response (DDR). Crucially, we show that a cancer-associated mutation in the PHRF1 PHD finger (P221L) abolishes its histone interaction and fails to rescue defective DDR in PHRF1 knockout cells. These findings underscore the importance of the PHRF1-H3 interaction in maintaining genome integrity and provide new insight into how PHD fingers contribute to chromatin biology.


Conflict of interest statement

EpiCypher is a commercial developer and supplier of fully defined semi-synthetic nucleosomes and platforms (Captify) used in this study. M.R.M., I.K.P., M.-C.K., and B.D.S. own shares in EpiCypher with M-CK and BDS also board members of same.

Figures

Graphical Abstract
Graphical Abstract
Figure 1.
Figure 1.
The PHD finger of PHRF1 binds to the N-terminus of histone H3. (A) Domain schematic of PHRF1 protein, highlighting the RING finger (purple oval), PHD finger (brown oval), and SRI region (green rectangle). (B) Structural homology model (generated in Alphafold-Multimer) of the PHD region of PHRF1 (shown as a translucent protein surface with electrostatics calculated through APBS in PyMOL) docked to a peptide comprised of the first eight residues of histone H3 (H3[1-8]ARTKQTAR), shown as a peptide in brown. P221 of PHRF1 and the first four residues of the H3 peptide are also shown as stick representations. This model was generated in Alphafold-Multimer. (C) A zoomed in region of the PHRF1 PHD: H3[1-8] structural homology model highlighting a binding pocket formed by PHRF1 P221 for H3 A1 to enter. (D) Sequence schematic of GST-tagged PHRF1 constructs used for in vitro experiments. (E) Biotinylated histone peptide microarray binding images with GST-PHRF1PHD (top), GST-PHRF1RP (middle), and GST-PHRF1RP(P221L) (bottom). Triplicate red dots indicate a positive histone peptide binding event (each peptide is arrayed in triplicate). Regions outlined by yellow boxes indicate antirabbit positive controls. (F) A heatmap comparing binding intensities observed in the peptide microarrays for each of the three GST-PHRF1 constructs to select peptides (indicated on the y-axis). Binding strength is represented on a color gradient from red to blue (stronger to weaker) (n = 4). For full peptide microarray data, please see Supplementary File 1. (G) Representative western blots of pulldowns between differentially modified biotinylated nucleosomes (top) and GST-PHRF1 constructs (right). Anti-GST blots represent PHRF1 signal and anti-H3 blots are shown as loading controls. Key: H3 NΔ2 and NΔ32 are nucleosomes lacking H3 residues 1-2 or 1-32 on H3, respectively, and H3 tetra-ac = H3 K4acK9acK14acK18ac.
Figure 2.
Figure 2.
PHRF1 associates with splicing and DDR-related proteins in vivo. (A) Schematic of miniTurbo-PHRF1 and the experimental approach for the proximity-based biotinylation assay. (B) Volcano plot of the miniTurbo-PHRF1 BioID MS analysis, color-highlighting protein groups related to splicing, transcription, DDR, cell cycle, PHRF1 itself (labeled), and other significant hits. X-axis shows enrichment [log2(fold-change)] of proteins in miniTurbo-PHRF1 samples compared to miniTurbo-GFP and NLS-miniTurbo-GFP negative controls; Y-axis shows significance of enrichment [−log(P-value)]. Dashed lines at log2(fold-change) = 1 and P-value = .05 signify cutoffs for statistical significance. Experiment done in biological duplicate. (C) Pathway analysis of significant hits from the BioID assay using DAVID. X-axis is fold enrichment, GO terms are ordered in decreasing fold enrichment along the Y-axis. The size of each bubble represents gene count and statistical significance is shown as a purple to pink gradient with all terms having a P-value < .05. (D) Representative confocal IF of HeLa cells expressing PHRF1-Emerald (green) stained with anti-SRSF1 (red) antibody, anticoilin (magenta), and DAPI (blue); diagonal white line through the “Merge” image (with all four channels) represents a nuclear cross-section to examine colocalization. Scale bar is 10 μm. (E) Quantification of PHRF1/SRSF1/Coilin signal colocalization across the plane defined in the merged image shown in panel (D).
Figure 3.
Figure 3.
Loss of PHRF1 affects the expression of DDR and splicing-related pathways in HeLa cells. (A) Volcano plot comparing the expression of genes in ΔPHRF1 and control HeLa cells. After applying an FDR cutoff of 0.0001, significant hits that are upregulated in ΔPHRF1 cells are shown in red and significant hits that are downregulated in ΔPHRF1 cells are shown in blue. X-axis shows fold change in ΔPHRF1 cells over control cells (log2(fold-change); Y-axis shows statistical significance [−log(FDR)]. Inset: immunoblot analysis of PHRF1 protein levels in control and ΔPHRF1 HeLa cells. Experiments were done in biological triplicate. (B) Pathway analysis of statistically significant changes in gene expression (FDR < 0.0001) using IPA. The x-axis shows activation scores (z-score) of canonical pathways listed on the y-axis, with a positive z-score meaning upregulation and a negative z-score meaning downregulation. Bubble size represents gene ratio and each pathway’s statistical significance is indicated by a color gradient from brown to white. (C) Summary pie chart of total alternative splicing identified by rMATS from the significant reads from panel (A) after filtering out events with an FDR of > 0.05 and ΔΨ values of < 0.01. (D) Summary table of events represented in panel (C). Specifically, the number of differential alternative splicing events as well as the number of corresponding genes are indicated for each of the five annotated splicing event types. (E) GO term analysis of differentially alternatively spliced genes from panel (D) using Enrichr and the GO Biological Process 2023 database. X-axis shows enrichment of each pathway as gene ratio, the bubble sizes represent gene count, and significance is denoted by a color gradient from blue to white.
Figure 4.
Figure 4.
Loss of PHRF1 results in a defective DDR. (A) Experimental schematic of zeocin DDR assay in HeLa cells. Time points indicate when cells were collected for analysis along the experimental trajectory. (B) Representative confocal IF of control and ΔPHRF1 cells stained with anti-γH2A.X (red) antibody and DAPI (blue) at indicated time points along the zeocin DDR assay. Scale bar is 10 μm. (C) Quantitative analysis of γH2A.X intensity/nucleus in control (gray) and ΔPHRF1 (mustard green) cells in the zeocin DDR assay. Median values are shown with solid black lines. (D) qGAM of γH2A.X signal accumulation over time from panel (C) for control (gray) and ΔPHRF1 (mustard green) cells. Median values are represented as solid, colored circles connected by dashed lines. The qGAM generated models are represented with smooth lines and shaded in 95% confidence intervals. Statistical significance was determined using a Wald test. ****P-value < .0001. See Supplementary Table S1 for full statistical analysis.
Figure 5.
Figure 5.
PHRF1 is highly expressed in HCT116 colorectal cancer cells and is required for appropriate expression of genes involved in splicing and DDR-related pathways. (A) Boxplots illustrate distribution of PHRF1 expression levels [log2(TPM + 1)] in cancer cells from the CCLE collapsed into the indicated tissue types on the Y-axis. The central line in each box represents the median. PHRF1 expression in each cell line is represented as a gray circle. (B) Immunoblot of PHRF1 protein levels in the indicated cancer cell lines and their corresponding cancer type category. (C) Volcano plot comparing the expression of genes in ΔPHRF1 and control HCT116 cells. After applying an FDR cutoff of 0.05, significant hits that are upregulated in ΔPHRF1 cells are shown in red and significant hits that are downregulated in ΔPHRF1 cells are shown in blue. X-axis shows fold change in ΔPHRF1 cells over control cells [log2(fold-change) and the Y-axis shows statistical significance (−log(FDR)]. Inset: western blot analysis of PHRF1 protein levels in control and ΔPHRF1 HCT116 cells. Experiments were done in biological triplicate. (D) Pathway analysis of statistically significant changes in gene expression (FDR < 0.05) using IPA, as in Fig. 3B. Bubble size represents gene ratio and each pathway’s statistical significance is indicated by a color gradient from brown to white. (E, F) Venn diagram comparison of the number of upregulated (E) and downregulated (F) pathways identified from HeLa and HCT116 RNAseq experiments.
Figure 6.
Figure 6.
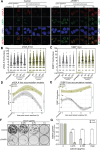
Loss of PHRF1 results in defective cellular DDR and cell survival in HCT116 cells. (A) Representative confocal IF of control and ΔPHRF1 cells stained with anti-γH2A.X (red), anti-53BP1 (green) antibodies, and DAPI (blue) at indicated time points along the zeocin DDR assay, as described in Supplementary Fig. S6A. The scale bar is 10 μm. (B, C) Quantitative analysis of γH2A.X (B) and 53BP1 (C) foci/ nucleus in control (gray) and ΔPHRF1 (mustard green) HCT116 cells. Median values are shown with solid black lines. (D, E) qGAM of γH2A.X (D) and 53BP1 (E) foci/nucleus accumulation over time for control (gray) and ΔPHRF1 (mustard green) cells. Median values are represented as solid, colored circles connected by dashed lines. The qGAM-generated models are represented with smooth lines and shaded in 95% confidence intervals. Statistical significance was determined using a Wald test. ****P-value < .0001. See Supplementary Table S2 for full statistical analysis. (F) Representative images of a CFA comparing growth in control and ΔPHRF1 HCT116 cells at the indicated concentrations of zeocin. This experiment was conducted in biological triplicate. (G) Quantification of growth from the CFA in panel (F), comparing control (gray) and ΔPHRF1 (mustard green) HCT116 cells. Statistical significance was determined through a Kruskal–Wallis test; ****P-value < .0001, ns = not significant.
Figure 7.
Figure 7.
PHD finger binding activity of PHRF1 is required for proper cellular DDR. (A) Representative images of a CFA comparing growth in Control + EV and ΔPHRF1 + indicated complemented HCT116 cells at the indicated concentrations of zeocin. This experiment was conducted in biological triplicate. (B) Quantification of growth from the CFA in panel (A), comparing ΔPHRF1 + EV (mustard green) cells to Control + EV (gray), ΔPHRF1 + 3XFlag-PHRF1WT (green), and ΔPHRF1 + 3XFlag-PHRF1P221L (red) HCT116 cells. Error bars are standard deviation. Statistical significance was determined through a Kruskal–Wallis test; ****P-value < .0001, ***P-value < .001, **P-value < .01, *P-value < .05, and ns = not significant.
Figure 8.
Figure 8.
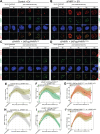
PHD finger binding activity of PHRF1 is required for proper cellular DDR. (A–D). Representative confocal IF of Control + EV (A), ΔPHRF1 + EV (B), ΔPHRF1 + 3XFlag-PHRF1WT (C), and ΔPHRF1 + 3XFlag-PHRF1P221L (D) cells stained with anti-γH2A.X (red), anti-53BP1 (green) antibodies, and DAPI (blue) at indicated time points along the zeocin DDR assay, as described in Supplementary Fig. S6A. The scale bar is 10 μm. (E–J) qGAM of γH2A.X (E–G) and 53BP1 (H–J) foci/nucleus accumulation over time, comparing ΔPHRF1 + EV (mustard green) with Control + EV (gray; E, H), ΔPHRF1 + 3XFlag-PHRF1WT (green; F, I), and ΔPHRF1 + 3XFlag-PHRF1P221L (red; G, J) cells. Median values are represented as solid, colored circles connected by dashed lines. The qGAM-generated models are represented with smooth lines and shaded in 95% confidence intervals. Statistical significance was determined using a Wald test. ****P-value < .0001, **P-value < .01, and ns = not significant. See Supplementary Table S3 for full statistical analysis.

Update of

References

    1. Su Z, Denu JM Reading the combinatorial histone language. Mol Cell. 2016; 11:179–204. 10.1021/acschembio.5b00864. - DOI - PMC - PubMed
    1. Strahl BD, Allis CD The language of covalent histone modifications. Nature. 2000; 403:41–5. 10.1038/47412. - DOI - PubMed
    1. Jenuwein T, Allis CD Translating the histone code. Science (1979). 2001; 293:1074–80. - PubMed
    1. Biswas S, Rao CM Epigenetic tools (The Writers, The Readers and The Erasers) and their implications in cancer therapy. Eur J Pharmacol. 2018; 837:8–24. 10.1016/j.ejphar.2018.08.021. - DOI - PubMed
    1. Weinzapfel EN, Fedder-Semmes KN, Sun ZW et al. Beyond the tail: the consequence of context in histone post-translational modification and chromatin research. Biochem J. 2024; 481:219–44. 10.1042/BCJ20230342. - DOI - PMC - PubMed

LinkOut - more resources