. 2025 Aug;34(8):e70219.
doi: 10.1002/pro.70219.

A computational dynamic model of combination treatment for type II inhibitors with asciminib

Affiliations

A computational dynamic model of combination treatment for type II inhibitors with asciminib

J Roadnight Sheehan et al. Protein Sci. 2025 Aug.

Abstract

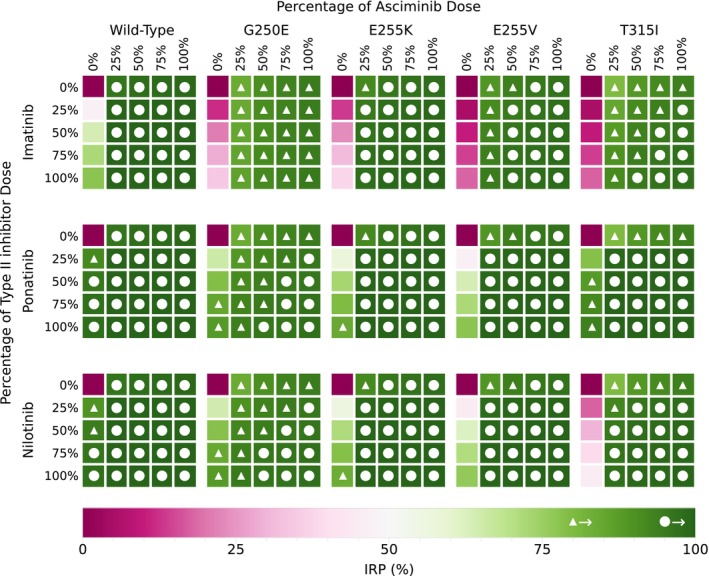
Despite continuous strides forward in drug development, resistance to treatment looms large in the battle against cancer as well as communicable diseases. Chronic myeloid leukemia (CML) is treated with targeted therapy and treatment is personalized when resistance arises. It has been extensively studied and is used as a model for targeted therapy. In this study, we examine combination treatments of type II Abl1 inhibitors and asciminib (an allosteric regulator) through a computational model at patient relevant concentrations. Due to the separate binding sites of type II inhibitors and asciminib, we propose their combination treatment as potentially robust to resistance. We find that the simultaneous cobinding of type II inhibitors and asciminib is high in synergetic combinations. As an aid to designing and comparing combination treatments, we put forward an equation that expands on the previously published effective ratio of IC50 (ERIC). Unlike usual comparisons of IC50 values, ERIC takes patient plasma concentrations into account. This study shows that the product of two ERIC values ( ERIC combo $$ {\mathrm{ERIC}}_{\mathrm{combo}} $$ ) creates comparable approximations of the effectiveness of combination treatments with low levels of synergy or antagonism at different concentrations. Its simple formulation is done without experiments and requires less computation and input data than the current standard of ZIP values. As such, the new scheme is a useful complement to experiments that deal with synergy in drug use.

Keywords: asciminib; kinase inhibitor; leukemia; resistance mutations.


Figures

FIGURE 1
FIGURE 1
Simulated inhibitor plasma concentrations at 100% doses, calculated as outlined in Section 5.1.4 for the first 10 days of treatment.
FIGURE 2
FIGURE 2
Example of an output of a 50% dose of imatinib combined with a 50% dose of the once‐daily regime of asciminib for the mutant T315I enzyme for the first 10 days of treatment. A close‐up of the near‐zero section on the tenth day is given to emphasize how little the single binding of imatinib (red) and asciminib to the active state (purple) contribute to this system. Abbreviations for the enzyme states are further explained in Section 5.
FIGURE 3
FIGURE 3
Heat map of the mean concentration of enzymes that are bound to both the asciminib and a type II inhibitor on day 10 for different combinations of doses of type II inhibitor and the once‐daily regime of asciminib.
FIGURE 4
FIGURE 4
An example of the product formation rates produced in the system with 100% dose of nilotinib as monotherapy for the first 10 days of treatment. Mutant T315I is associated with resistance to nilotinib, yet it does not have the highest product formation rate, showing that the absolute size of the product rate does not give an indication of resistance.
FIGURE 5
FIGURE 5
Heat map of associated resistance to type II inhibitors for mutants and the IRP values of 100% dose single drug therapy. Dark gray indicates that resistance is associated with the mutant and light gray indicates resistance associated with the mutation in combination mutations. The IRP values are for the midpoint of the range of product formation rate on day 10. The IRP values reflect the associated resistance. Also shown are the same IRP midpoints for both asciminib regimes, asciminib is not associated with resistance to these mutants.
FIGURE 6
FIGURE 6
Heat map of IRP values for the midpoint of the range of product formation rate on day 10 for different combinations of doses of type II inhibitor and once‐daily doses of asciminib. The white triangles and circles indicate IRPs that are over 80% and 95%, respectively. An equivalent figure for twice‐daily doses of asciminib can be found in Figure S2, along with separate heat maps for each type II inhibitor and asciminib regime combination with individual IRP values labeled (Figures S3–S5). This shows how different combination therapies can create similar outcomes in IRP.
FIGURE 7
FIGURE 7
Heat map of the product of the Effective Ratios of IC50 (ERICcombos) for each combination of drugs, dose and mutant with once‐daily dose regime of asciminib. The inhibitor concentration values used are the midpoint of the range of inhibitor concentration on day 10. The white triangles and circles indicate ERIC that are under 0.2 and 0.05, respectively. An equivalent figure for twice‐daily doses of asciminib can be found in Figure S6 (with full ERICcombo values detailed in Figures S7–S9). Comparing this to Figure 6 shows how well ERICcombo values can indicate effectiveness of treatment.
FIGURE 8
FIGURE 8
Comparison of IRP, IRPZIP, δZIP, and the product of Effective Ratios of IC50 (ERICcombo) for 25% dose of type II inhibitors and 25% dose of once‐daily asciminib. An equivalent figure for the twice‐daily asciminib regime can be found in Figure S10 (with full IRPZIP and δZIP values detailed in Figures S11–S16). The values of δIRP show low amounts of synergy for all mutants except G250E, which experiences low levels of antagonism, for these doses of combination therapy. The ERICcombo values reflect the same trends seen in IRP and IRPZIP.
FIGURE 9
FIGURE 9
Fold‐IC50 values from the WT of each drug for each mutant. Fold‐IC50 value for asciminib in the upper right triangles and the fold‐IC50 value for the type II inhibitors in the lower left triangles.
FIGURE 10
FIGURE 10
A simple illustration of the simplified model of the Abl1 enzyme system in focus. The states, molecules they bind to, the transitions between states, and the rate constants for each transition are shown. The Abl1 enzyme is represented by the peach‐colored E‐shape in both its active (round corners) and inactive (sharp corners) states; a type II inhibitor is illustrated by the dark blue T‐shape (either imatinib, ponatinib, or nilotinib); the small yellow shape represents an asciminib molecule; and the remaining shapes depict the ATP with its phosphate groups and the protein substrate that is phosphorylated. Transition arrows are accompanied by their rate constants. The rates between states will differ depending on the mutation and type II inhibitor present in the system.
FIGURE 11
FIGURE 11
Details and labelling conventions for the enzyme states and their relative weights within the system in quasi‐equilibrium. β is the reciprocal of the product of Boltzmann's constant and the temperature (β=1/kBT); ΔG is the change in Gibbs free energy between the active and inactive enzymes, and it describes the preference of the unbound enzyme between the active and inactive states; S is the concentration of the substrate (it is assumed that ATP is in surplus relative to the substrate and its concentration is therefore not treated explicitly by the model); KM is the Michaelis constant of the binding of the substrate to the active enzyme state; [A] is the concentration of asciminib in the system; KAA,I is the dissociation constant of the binding of asciminib for the enzyme in either active (A) or inactive (I) state; [R] is the concentration of the type II inhibitor in the system; and KR is the dissociation constant of the binding of the type II inhibitor drug.

References

    1. Abumiya M, Takahashi N, Yoshioka T, Kameoka Y, Miura M. Evaluation of the plasma concentration of ponatinib in a chronic myeloid leukaemia patient with ponatinib intolerance. J Clin Pharm Ther. 2020;46(1):219–222. - PubMed
    1. Advani AS, Pendergast AM. Bcr–abl variants: biological and clinical aspects. Leuk Res. 2002;26(8):713–720. - PubMed
    1. Albe KR, Butler MH, Wright BE. Cellular concentrations of enzymes and their substrates. J Theor Biol. 1990;143(2):163–195. - PubMed
    1. Braun TP, Eide CA, Druker BJ. Response and resistance to bcr‐abl1‐targeted therapies. Cancer Cell. 2020;37(4):530–542. - PMC - PubMed
    1. Copland M. Treatment of blast phase chronic myeloid leukaemia: a rare and challenging entity. Br J Haematol. 2022;199(5):665–678. - PMC - PubMed

MeSH terms