. 2025 Jul 2:16:1609796.
doi: 10.3389/fendo.2025.1609796. eCollection 2025.

Interleukin-4 prevents increased endothelial permeability by inducing pericyte survival and modulating microglial responses in diabetic retinopathy

Affiliations

Interleukin-4 prevents increased endothelial permeability by inducing pericyte survival and modulating microglial responses in diabetic retinopathy

Jang-Hyuk Yun. Front Endocrinol (Lausanne). .

Abstract

Introduction: Retinal vascular leakage due to increased endothelial permeability is a major contributor to the pathogenesis of diabetic retinopathy (DR) and visual impairment. Pericyte loss and microglia-mediated inflammation exacerbate this vascular dysfunction. Interleukin-4 (IL-4) is known for its anti-inflammatory and tissue-protective properties, but its role in DR remains unclear.

Methods: We evaluated IL-4 expression and signaling in the retinas of streptozotocin-induced diabetic mice. In vitro assays were conducted under high-glucose and TNF-α conditions using retinal endothelial cells, pericytes, and microglia to assess IL-4's effects on barrier function, cell viability, and inflammatory state. Pathway-specific analyses were performed to investigate PI3K/AKT and STAT6 signaling.

Results: IL-4 expression and downstream signaling were significantly reduced in diabetic retinas. IL-4 promoted pericyte survival via PI3K/AKT activation and modulated microglial functional profiles through STAT6 signaling, favoring an anti-inflammatory phenotype. These effects contributed to restored endothelial barrier integrity and tight junction protein expression under diabetic stress conditions in vitro.

Conclusion: IL-4 supports retinal vascular stabilization in DR by preserving pericyte viability and modulating microglial activity. These findings highlight IL-4 as a potential therapeutic target for preventing or slowing DR progression and warrant further preclinical investigation.

Keywords: diabetic retinopathy; endothelial permeability; interleukin-4; microglia functional states; pericytes; signal transducer and activator of transcription 6.


Conflict of interest statement

The author declares that the research was conducted in the absence of any commercial or financial relationships that could be construed as a potential conflict of interest.

Figures
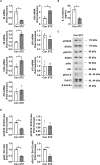
Figure 1
Figure 1
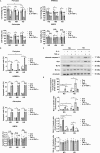
IL-4 expression and downstream signaling activity in retinas of STZ-induced diabetic mice. (A) mRNA levels of Il4, Il1b, Il6, Il10, Il12b, Il13, and Il18 measured using qRT-PCR in retinas from 3-month-old STZ-induced diabetic mice (STZ) and age-matched control mice (Con). (B) IL-4 protein levels measured using ELISA in retinal lysates from 3-month-old STZ and Con mice. (C) Expression of phosphorylated and total STAT6, STAT5, Akt, and Erk1/2 in retinal lysates assessed using western blot analysis. β-tubulin was used as a loading control. (D) Densitometric quantification of the immunoblot bands in (C). Bar graphs in A–C show mean ± SD (n = 3). *P < 0.05 assessed using Student’s t-test. IL-4, interleukin-4; STZ, streptozotocin; qRT-PCR, quantitative reverse transcription polymerase chain reaction; Con, control; ELISA, enzyme-linked immunosorbent assay; pSTAT6, phosphorylated signal transducer and activator of transcription 6; pSTAT5, phosphorylated STAT5; pAkt, phosphorylated protein kinase B; pErk1/2, phosphorylated extracellular signal-regulated kinase 1/2; β-tubulin, beta-tubulin.
Figure 2
Figure 2
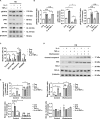
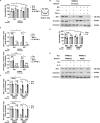
IL-4 promotes pericyte survival under high-glucose conditions. (A, B) Cell viability assessed using the MTT assay (A), and apoptosis analyzed using annexin V/PI staining followed by flow cytometry (B) in pericytes, HRMECs, astrocytes, and HMO6 cells cultured under normal glucose (NG; 5 mmol/L glucose), high mannitol (HM; 20 mmol/L mannitol + 5 mmol/L glucose), or high glucose (HG; 25 mmol/L glucose) conditions with or without IL-4 (50 ng/mL) and TNF-α (100 ng/mL) treatments for 48 h (C) Expression levels of cleaved caspase-3, Bax, Bcl-2, and Bcl-xL in pericyte lysates assessed using western blot analysis under NG or HG conditions, with or without IL-4 and TNF-α treatment for 48 h β-tubulin was used as a loading control. (D) Quantitative densitometric analysis of western blot bands in (C), showing protein expression normalized to β-tubulin. In (A, B, D) bar graphs represent mean ± SD (n = 3). Statistical analyses were performed using two-way ANOVA followed by Tukey’s post hoc test. *P < 0.05. IL-4, interleukin-4; HRMECs, human retinal microvascular endothelial cells; HMO6, human microglia clone 6; TNF-α, tumor necrosis factor-alpha; MTT, (3-(4,5-dimethylthiazol-2-yl)-2,5-diphenyltetrazolium bromide) assay; PI, propidium iodide; Bax, Bcl-2-associated X protein; Bcl-2, B-cell lymphoma 2; Bcl-xL, B-cell lymphoma-extra large; β-tubulin, beta-tubulin. n.s., not significant.
Figure 3
Figure 3
IL-4 promotes pericyte survival through the Akt signaling pathway. (A) Western blot analysis of phospho-STAT6 (pSTAT6), STAT6, phospho-Akt (pAkt), Akt, phospho-Erk1/2 (pErk1/2), and Erk1/2 in lysates from pericytes treated with or without IL-4 (50 ng/mL) and TNF-α (100 ng/mL) for 30 min under high glucose (HG; 25 mmol/L) conditions. β-tubulin was used as a loading control. (B) Densitometric quantification of protein expression in (A), normalized to β-tubulin. (C) Cell apoptosis assessed using annexin-V/PI staining and flow cytometric analysis in pericytes pretreated with AS1517499 (1 μM), wortmannin (1 μM), or PD98059 (25 μM) for 1 h, followed by IL-4 and/or TNF-α treatment for 48 h under HG conditions. (D) Western blot analysis of cleaved caspase-3, Bax, Bcl-2, and Bcl-xL in lysates from pericytes pretreated with wortmannin (1 μM) for 1 h and subsequently treated with or without IL-4 and TNF-α for 48 h under high glucose conditions. β-tubulin was used as a loading control. (E) Densitometric quantification of protein expression in (D), normalized to β-tubulin. In (B, C, E) bar graphs represent mean ± SD (n = 3). Statistical analysis was performed using two-way ANOVA followed by Tukey’s post hoc test. n.s., not significant; *P < 0.05. IL-4, interleukin-4; TNF-α, tumor necrosis factor-alpha; pSTAT6, phosphorylated STAT6; pAkt, phosphorylated Akt; pErk1/2, phosphorylated extracellular signal-regulated kinase 1/2; Bax, Bcl-2-associated X protein; Bcl-2, B-cell lymphoma 2; Bcl-xL, B-cell lymphoma-extra large; PI, propidium iodide; β-tubulin, beta-tubulin.
Figure 4
Figure 4
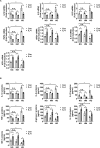
IL-4 regulates inflammatory factor expression in HMO6 microglia under high glucose conditions. (A, B) Expression levels of IL1B, IL6, IL23, TNFA, Arg1, IL10, and IGF1 mRNA (A, B) proteins in HMO6 cells cultured under normal glucose (NG; 5 mmol/L glucose), high mannitol (HM; 20 mmol/L mannitol + 5 mmol/L glucose), or high glucose (HG; 25 mmol/L glucose) conditions with or without IL-4 (50 ng/mL) for 48 h measured using qRT-PCR (A) and ELISA (B). Bar graphs show mean ± SD (n = 3). Statistical analyses were performed using two-way ANOVA followed by Tukey’s post hoc test. n.s., not significant; *P < 0.05. Arg-1, arginase-1; IL-10, interleukin-10; IGF-1, insulin-like growth factor 1.
Figure 5
Figure 5
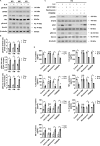
IL-4 activates STAT6 signaling in HMO6 microglia under high glucose conditions. (A) Western blot analysis of phosphorylated and total STAT6, Akt, and Erk1/2 performed on lysates from HMO6 cells treated with or without IL-4 (50 ng/mL) for 30 min under NG, HM, or HG conditions. β-tubulin was used as a loading control. (B) Densitometric quantification of protein bands in (A) normalized to β-tubulin. (C) Western blot analysis of pSTAT6, STAT6, pAkt, Akt, pErk1/2, and Erk1/2. HMO6 cells were pretreated with AS1517499 (1 μM), wortmannin (1 μM), or PD98059 (25 μM) for 1 h and then exposed to IL-4 for 30 min under HG conditions. β-tubulin was used as a loading control. (D) Protein levels of IL-1β, IL-6, IL-23, TNF-α, Arg-1, IL-10, and IGF-1 in culture supernatants measured using ELISA. HMO6 cells were pretreated as in (C) and exposed to IL-4 for 48 h under HG conditions. In B and D, bar graphs show mean ± SD (n = 3). Statistical analyses were performed using two-way ANOVA followed by Tukey’s post hoc test. n.s., not significant; *P < 0.05.
Figure 6
Figure 6
Conditioned media from IL-4-treated microglia affects pericyte apoptosis. (A) Apoptosis in HMO6 cells pretreated with AS1517499 (1 μM), wortmannin (1 μM), or PD98059 (25 μM) for 1 h and then cultured with or without IL-4 for 48 h under HG conditions assessed using annexin-V/PI staining and flow cytometry. (B) Expression of cleaved caspase-3, Bax, Bcl-2, and Bcl-xL in HMO6 cells pretreated with AS1517499 and exposed to IL-4 under NG or HG conditions for 48 h assessed using western blot analysis. Conditioned media were applied to pericytes for 48 h β-tubulin was used as a loading control. (C) Densitometric quantification of protein bands in (B) normalized to β-tubulin. In A and C, data show mean ± SD (n = 3). Statistical analyses were performed using two-way ANOVA followed by Tukey’s post hoc test. n.s., not significant; *P < 0.05.
Figure 7
Figure 7
IL-4 affects endothelial permeability through actions on pericytes and microglia. (A) Permeability measured using Evans blue dye assay (n = 5). (B) Western blot analysis of ZO-1 and occludin in lysates from HRMECs. β-tubulin was used as a loading control. In A and B, pericytes and HRMECs were co-cultured on opposite sides of a Transwell insert and exposed to NG or HG conditions with or without IL-4 (50 ng/mL) and TNF-α (100 ng/mL) for 48 h. (C) Densitometric quantification of protein bands in (B) normalized to β-tubulin. (D) Permeability measured using Evans blue dye assay (n = 5). (E) Western blot analysis of ZO-1 and occludin in lysates from HRMECs. In (D, E) HRMECs were co-cultured with HRMECs or HMO6 cells on opposite sides of a Transwell insert and exposed to NG or HG conditions with or without IL-4 for 48 h β-tubulin was used as a loading control. (F) Densitometric quantification of protein bands in (E) normalized to β-tubulin. In A, C, D, and F, data represent mean ± SD (n = 3). Statistical analyses were performed using two-way ANOVA followed by Tukey’s post hoc test. n.s., not significant; *P < 0.05.

Similar articles

References

    1. Seo H, Park SJ, Song M. Diabetic retinopathy (DR): mechanisms, current therapies, and emerging strategies. Cells. (2025) 14. doi: 10.3390/cells14050376 - DOI - PMC - PubMed
    1. Lam NV. Adult eye conditions: diabetic retinopathy and age-related macular degeneration. FP Essent. (2022) 519:24–8. - PubMed
    1. Ji L, Waduge P, Wu Y, Huang C, Kaur A, Oliveira P, et al. Secretogranin III selectively promotes vascular leakage in the deep vascular plexus of diabetic retinopathy. Int J Mol Sci. (2023) 24. doi: 10.3390/ijms241310531 - DOI - PMC - PubMed
    1. Huang H. Pericyte-endothelial interactions in the retinal microvasculature. Int J Mol Sci. (2020) 21. doi: 10.3390/ijms21197413 - DOI - PMC - PubMed
    1. Yun JH, Jeong HS, Kim KJ, Han MH, Lee EH, Lee K, et al. beta-Adrenergic receptor agonists attenuate pericyte loss in diabetic retinas through Akt activation. FASEB J. (2018) 32:2324–38. doi: 10.1096/fj.201700570RR - DOI - PubMed

MeSH terms