. 2025 Jul 2:70:1608217.
doi: 10.3389/ijph.2025.1608217. eCollection 2025.

Global, Regional, and National Burden of Smoking-Related Diseases and Associations With Health Workforce Distribution, 1990-2021: Analysis From the Global Burden of Disease Study 2021

Affiliations

Global, Regional, and National Burden of Smoking-Related Diseases and Associations With Health Workforce Distribution, 1990-2021: Analysis From the Global Burden of Disease Study 2021

Yuzhou Cai et al. Int J Public Health. .

Abstract

Objectives: To analyze global trends in smoking-related disease burden from 1990-2021 and examine associations with health workforce distribution across countries.

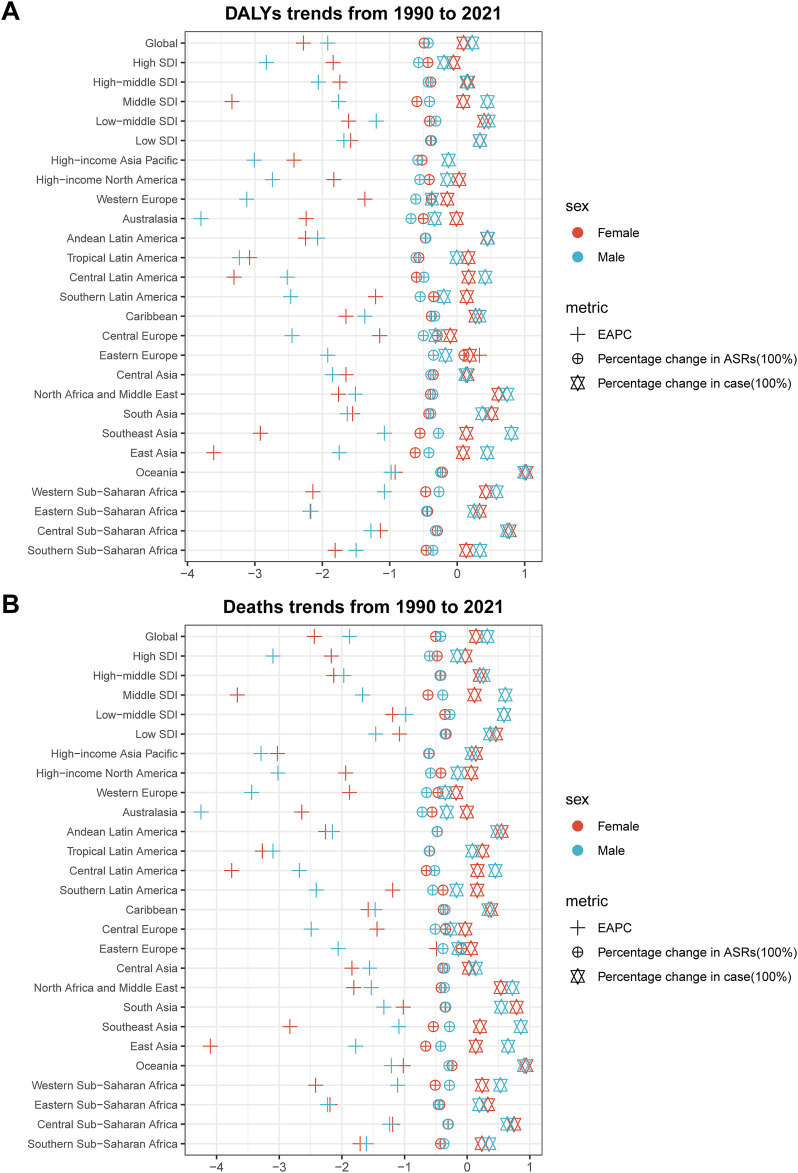
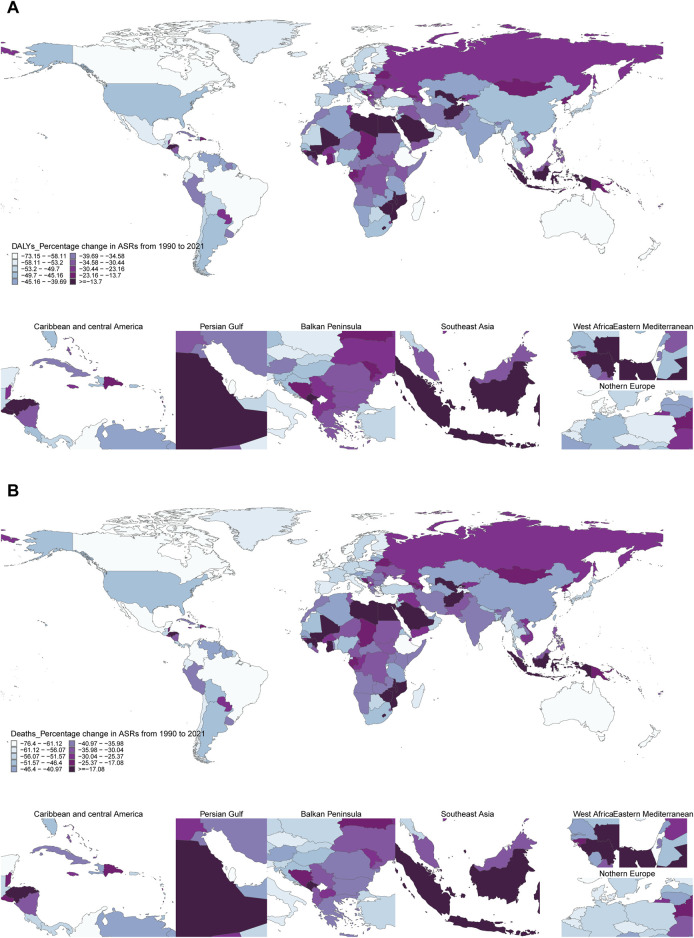
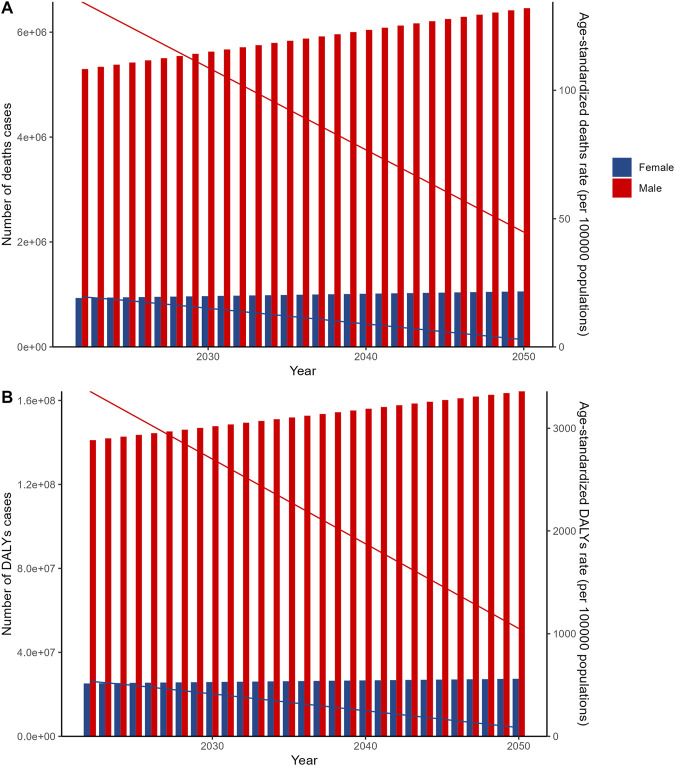
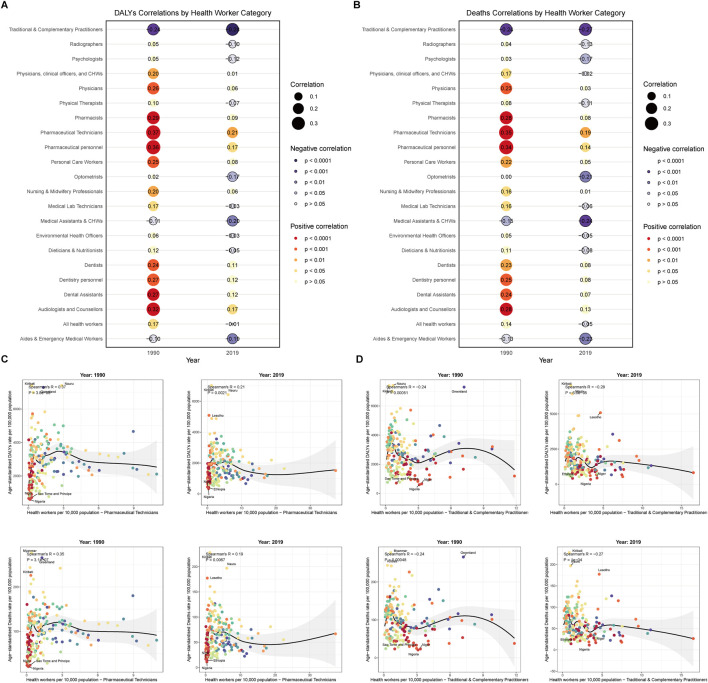
Methods: We analyzed smoking-related deaths and disability-adjusted life years using Global Burden of Disease 2021 data for 204 countries. Age-standardized rates were calculated for 27 geographic regions. Linear regression assessed temporal trends, while autoregressive integrated moving average models projected future burden to 2050. Correlation analyses examined relationships between 22 health workforce categories and disease burden.

Results: Globally, age-standardized death rates from smoking-related diseases increased by 12.3% from 1990-2021, with males showing higher rates than females across all regions. Middle Socio-demographic Index regions exhibited the highest burden. Pharmaceutical technicians demonstrated strong positive correlations with disease burden (r = 0.35-0.37, p < 0.001), while traditional practitioners showed negative correlations (r = -0.24 to -0.28, p < 0.001). Projections indicate continued increases through 2050.

Conclusion: Smoking-related disease burden demonstrates significant geographic and temporal variations, with distinct associations between health workforce composition and disease patterns, highlighting the need for targeted prevention strategies.

Keywords: disease trends; global health burden; health workforce; prevention strategies; smoking-related diseases.


Conflict of interest statement

The authors declare that they do not have any conflicts of interest.

Figures

FIGURE 1
FIGURE 1
Age-specific rates of smoking-related diseases by global regions and Socio-demographic Index regions, 1990–2021. (A) Age-specific disability-adjusted life years rates of smoking-related diseases for both sexes across global regions and Socio-demographic Index regions from 1990 to 2021. Heat map shows rates per 100,000 population across 14 age groups (30–34 to 95+ years) for 27 geographic regions including global, 5 Socio-demographic Index regions, and 21 Global Burden of Disease regions. Color intensity represents rate magnitude with darker colors indicating higher rates. (B) Age-specific death rates of smoking-related diseases for both sexes across global regions and Socio-demographic Index regions from 1990 to 2021. Heat map shows rates per 100,000 population across 14 age groups (30–34 to 95+ years) for 27 geographic regions. Color intensity represents rate magnitude with darker colors indicating higher death rates. Data source: Global Burden of Disease Study 2021; coverage: global, regional, and national estimates; study period: 1990–2021.
FIGURE 2
FIGURE 2
Trends in smoking-related diseases by sex across global regions and Socio-demographic Index regions, 1990–2021. (A) Trends in disability-adjusted life years of smoking-related diseases by sex across global regions and Socio-demographic Index regions, 1990–2021. Scatter plot displays percentage changes in cases (squares), percentage changes in age-standardized rates (diamonds), and estimated annual percentage changes (triangles) for males (blue) and females (red) across 27 geographic regions. (B) Trends in deaths from smoking-related diseases by sex across global regions and Socio-demographic Index regions, 1990–2021. Scatter plot displays percentage changes in cases (squares), percentage changes in age-standardized rates (diamonds), and estimated annual percentage changes (triangles) for males (blue) and females (red) across 27 geographic regions. Data source: Global Burden of Disease Study 2021; coverage: global, regional, and national estimates; study period: 1990–2021.
FIGURE 3
FIGURE 3
Global distribution of percentage changes in age-standardized rates of smoking-related diseases by country, 1990–2021. (A) Percentage change in age-standardized disability-adjusted life years rates of smoking-related diseases by country, 1990–2021. World map displays the percentage change in age-standardized disability-adjusted life years rates per 100,000 population for 204 countries and territories. Colors represent deciles of percentage change, with detailed regional insets for the Caribbean and Central America, Persian Gulf, Balkan Peninsula, Southeast Asia, West Africa, Eastern Mediterranean, and Northern Europe regions. Countries with insufficient data are shown in gray. (B) Percentage change in age-standardized death rates of smoking-related diseases by country, 1990–2021. World map displays the percentage change in age-standardized death rates per 100,000 population for 204 countries and territories. Colors represent deciles of percentage change, with detailed regional insets for seven key geographic regions. Countries with insufficient data are shown in gray. Data source: Global Burden of Disease Study 2021; coverage: global, regional, and national estimates; study period: 1990–2021.
FIGURE 4
FIGURE 4
Autoregressive integrated moving average (ARIMA) model projections of global smoking-related diseases by sex, 2022–2050. (A) Autoregressive integrated moving average (ARIMA) model projections of global deaths from smoking-related diseases by sex and age-standardized death rates by sex, 2022–2050. (B) Autoregressive integrated moving average (ARIMA) model projections of global disability-adjusted life years from smoking-related diseases by sex and age-standardized disability-adjusted life years rates by sex, 2022–2050. Data source: Global Burden of Disease Study 2021; coverage: global, regional, and national estimates; study period: 1990–2021.
FIGURE 5
FIGURE 5
Correlation between health workforce density and smoking-related disease burden across countries. (A) Overall correlation patterns between health workforce categories and smoking-related disease burden, 1990 and 2019. Heat map displays correlation coefficients between 22 health workforce categories and smoking-related deaths and disability-adjusted life years rates across countries for both time periods. Red colors indicate positive correlations, blue colors indicate negative correlations, with color intensity representing correlation strength. (B) Overall correlation patterns between health workforce categories and smoking-related deaths across countries, 1990 and 2019. Heat map showing correlation coefficients specifically for death rates, with separate panels for 1990 and 2019 data. (C) Correlation between pharmaceutical technicians density and smoking-related disease burden across countries, 1990 and 2019. Scatter plots show the relationship between pharmaceutical technicians per 10,000 population and disability-adjusted life years rates (upper panels) and death rates (lower panels) of smoking-related diseases for 1990 (left) and 2019 (right). Linear regression lines with 95% confidence intervals are displayed. Correlation coefficients and p-values are indicated. (D) Correlation between traditional and complementary practitioners density and smoking-related disease burden across countries, 1990 and 2019. Scatter plots show the relationship between traditional and complementary practitioners per 10,000 population and disability-adjusted life years rates (upper panels) and death rates (lower panels) of smoking-related diseases for 1990 (left) and 2019 (right). Linear regression lines with 95% confidence intervals are displayed. Correlation coefficients and p-values are indicated. Data source: Global Burden of Disease Study 2021; coverage: global, regional, and national estimates; study period: 1990–2021.

Similar articles

References

    1. Agbonlahor O, Mattingly DT, Rai J, Hart JL, McLeish AC, Walker KL. Differences in Health Care Provider Screening for Tobacco Use Among Youth in the United States: The National Youth Tobacco Survey, 2021. Prev Med (2023) 175:107718. 10.1016/j.ypmed.2023.107718 - DOI - PMC - PubMed
    1. Anderer S. Rise in Vaping Keeps Tobacco Use High. JAMA (2025) 333(18):1570. 10.1001/jama.2025.4024 - DOI - PubMed
    1. Reddy KP, Kruse GR, Lee S, Shuter J, Rigotti NA. Tobacco Use and Treatment of Tobacco Dependence Among People with Human Immunodeficiency Virus: A Practical Guide for Clinicians. Clin Infect Dis Off Publ Infect Dis Soc Am (2022) 75(3):525–33. 10.1093/cid/ciab1069 - DOI - PMC - PubMed
    1. Lee PN, Farsalinos K. Comparing Smoking-Related Disease Rates from E-Cigarette Use with Those from Tobacco Cigarette Use: A Reanalysis of a Recently-Published Study. Harm Reduct J (2025) 22(1):78. 10.1186/s12954-025-01230-y - DOI - PMC - PubMed
    1. Chugh A, Arora M, Jain N, Vidyasagaran A, Readshaw A, Sheikh A, et al. The Global Impact of Tobacco Control Policies on Smokeless Tobacco Use: A Systematic Review. Lancet Glob Health (2023) 11(6):e953–e968. 10.1016/S2214-109X(23)00205-X - DOI - PubMed

LinkOut - more resources