. 2025 Jul 16;8(3):e70092.
doi: 10.1002/jsp2.70092. eCollection 2025 Sep.

Short-Term Dynamic Unloading of Bovine Tail Discs in Culture Partially Mitigates Induced Degeneration After One-Strike Trigger

Affiliations

Short-Term Dynamic Unloading of Bovine Tail Discs in Culture Partially Mitigates Induced Degeneration After One-Strike Trigger

Astrid Soubrier et al. JOR Spine. .

Abstract

Introduction: Intervertebral disc (IVD) degeneration is driven by a vicious circle of interrelated biological and biomechanical factors. Dynamic unloading, defined as dynamic partial decompression, promotes water and metabolite flow, which is essential for IVD homeostasis. However, the mechanobiological effects of unloading remain poorly understood. IVD organ cultures offer a valuable model for studying IVD degeneration and regeneration at the molecular level. This study investigated the biological and biomechanical effects of induced degeneration and the subsequent short-term dynamic unloading of bovine tail IVDs in a bioreactor culture system.

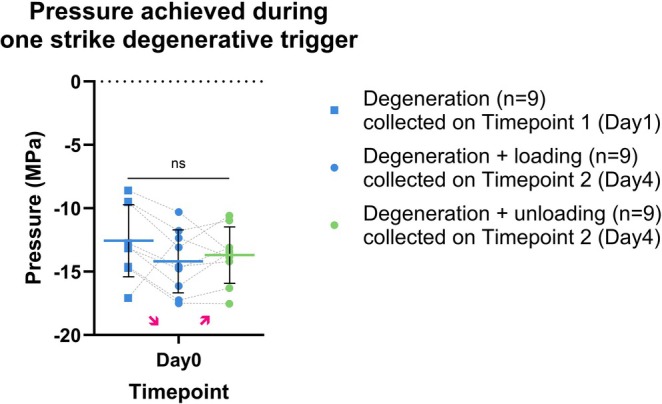
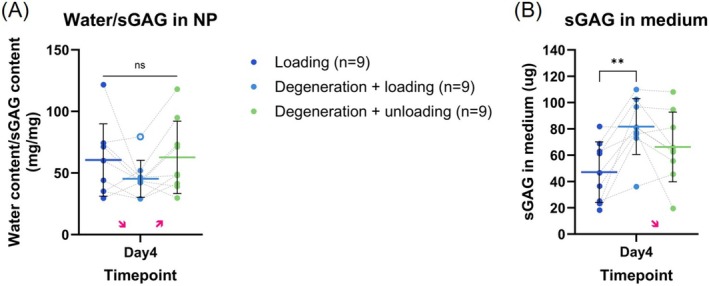
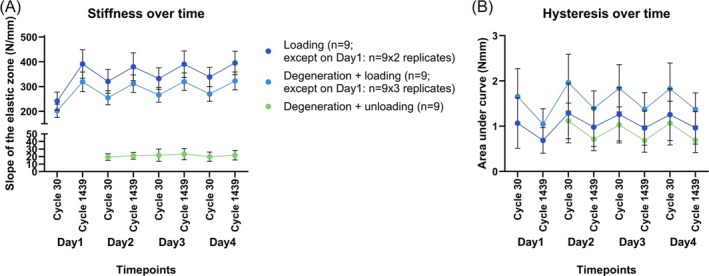
Methods: We applied a one-strike degenerative trigger on Day 0 and assessed its immediate effects after 1 day of culture under bioreactor loading (Timepoint 1). The impact of dynamic unloading for three additional days (Timepoint 2) was evaluated in comparison to continued loading. We evaluated biological outcomes, namely cell viability, gene expression, water/sulfated glycosaminoglycan (sGAG) ratio, and sGAG release. Mechanical readouts included disc height, slope of the elastic zone, area under the curve, and neutral zone characteristics.

Results: On Timepoint 1, we demonstrated degeneration in the nucleus pulposus with altered viability, increased inflammatory and catabolic gene expression, elevated sGAG release, a decreased slope of the elastic zone, and an increased area under the curve. On Timepoint 2, we noticed a sustained degenerative cascade in both degeneration groups. However, unloading showed a trend towards partial mitigation of the induced degeneration with decreased iNOS and TRPV4 expression, an increased water/sGAG ratio, reduced sGAG release, and recovery of the disc height.

Conclusion: This first ex vivo study on unloading mechanobiology of bovine degenerated IVDs unveils encouraging preliminary insights. The findings suggest potential benefits of unloading and, more broadly, therapeutic movement as regenerative strategies for degenerated IVDs. These results underscore the need for further studies and encourage research combining mechanical and biological approaches in organ culture models.

Keywords: bioreactor organ model; catabolism; inflammation; intervertebral disc; intervertebral disc degeneration; intervertebral disc regeneration; mechanobiology; traction; unloading.


Conflict of interest statement

The authors declare no conflicts of interest.

Figures

FIGURE 1
FIGURE 1
Study groups represented on a dissected tail illustrating the intervertebral discs (IVDs) harvested (IVD 1–IVD 6). The IVD height (Δx) is the distance between the two growth plates, identified as the widest parts of the IVD segment and indicated, for IVD 4, by the two red arrows.
FIGURE 2
FIGURE 2
Study description including the study timeline, the study design, the loading regimes, the modified bioreactor system, with the lid and spring of the intervertebral disc chamber that allows controlled static loading, and the study evaluation parameters. From Day 2 to Day 4, the loading command is represented as starting at 0.00 MPa to facilitate the readability of the illustration; however, due to the technical limitations of the mechanical testing device, we effectively started the loading at −0.01 MPa as described in the text.
FIGURE 3
FIGURE 3
Pressure achieved during the 50% disc height compression of the one‐strike on Day 0 was similar in the samples spread over the different groups. The small differences observed between the different groups, indicated by pink arrows, did not lead to differences in the evaluation parameters. The data are represented as mean ± standard deviation (SD).
FIGURE 4
FIGURE 4
Biological and biomechanical evaluation parameters on Timepoint 1 illustrating the degeneration induced by the one‐strike. Compared to the control Loading group, the nucleus pulposus (NP) samples from the Degeneration group showed, on the biological side, (A) a lower viability (p < 0.05), (B, C) a higher gene expression of MMP3 (p < 0.0001) and iNOS (p < 0.01) and (D) a higher sGAG/water ratio (trend, indicated by the pink arrow, when outlier included and p < 0.05 when outlier excluded). (E) The sGAG release in the medium was also higher in the Degeneration group compared to the loading group (p < 0.0001). Looking at the mechanical evaluation parameters, the Degeneration group presented (F) a lower stiffness of the elastic zone (p < 0.0001), (G) a lower stiffness increase during the loading session (p < 0.05) and (H) a higher hysteresis (p < 0.001). The data are represented as mean ± standard deviation except for (D) where the median is indicated. The log10 transformations are reported on the graphs. If any, the outliers, defined by the Grubbs' test, are indicated with empty symbols (□) and the results of the statistical tests, with and without outliers, are described and specified on the graphs with a gray significance symbol (*). (A, D) In both cases, excluding the statistical outlier resulted in a normal distribution of the data. (A) Excluding the statistical outlier did not influence the level of statistical significance of the paired t‐test. (A) *One of the NP tissue samples lacked in the histological section. (D) *From one sample, we could not collect enough NP tissue to analyze the water/sGAG content in the tissue.
FIGURE 5
FIGURE 5
Viability of the nucleus pulposus on Timepoint 2 suggested less cells alive in the two degeneration groups. Compared to the control group Loading, the nucleus pulposus (NP) samples from the DegLd and DegUnld group showed a trend, indicated by the pink arrow, towards a lower viability (with Loading >< DegUnld p < 0.05 when outlier excluded). The data are represented as mean ± standard deviation. The outlier, defined by the Grubbs' test, is indicated with an empty symbol (□) and the results of the statistical tests, with and without outlier, are described and specified on the graphs with a gray significance symbol (*). The exclusion of the statistical outlier resulted in a normal distribution of the data. *One of the NP tissue samples lacked in the histological section.
FIGURE 6
FIGURE 6
Gene expression of COL1A1, MMP3, iNOS, TRPV4, and AQP1 in the nucleus pulposus (NP) on Timepoint 2 indicated a trend towards a decreased inflammatory and osmosensing gene expression in the DegUnld group. (A) COL1A1 was higher expressed in the DegLd and DegUnld groups compared to the Loading group (p < 0.0001 and p < 0.0001). (B) MMP3 was higher expressed in the DegLd and DegUnld groups compared to the Loading group (p < 0.0001 and p < 0.0001). (C) iNOS was also higher expressed in the DegLd and DegUnld groups compared to the Loading group with a greater difference between the DegLd and Loading groups than between the DegUnld and Loading groups (p < 0.01 and p < 0.05 respectively). (D) TRPV4 was only higher expressed in the DegLd group compared to the Loading group. (E) AQP1 was less expressed in the DegLd and DegUnld groups compared to the Loading group (p < 0.05 and p < 0.01 respectively). The data are represented as mean ± standard deviation. The pink arrows indicate trends. All gene expression data were log10 transformed.
FIGURE 7
FIGURE 7
Water/sGAG ratio in the nucleus pulposus (NP) and sGAG release in the medium on Timepoint 2 illustrated in the DegUnld group a trend towards recovery of the water/sGAG ratio to the ratio of the Loading group and a trend towards a decrease in sGAG release in the medium compared to the DegLd group. (A) We observed a trend towards a decrease of the water/sGAG ratio in the DegLd group compared to the Loading and DegUnld groups. The outlier, defined by the Grubbs' test, is indicated with an empty symbol (○). The exclusion of the statistical outlier resulted in a normal distribution of the data but did not influence the results of the ANOVA. (B) The sGAG release in the medium increased in the DegLd group (p < 0.01) compared to the Loading group. We also observed a trend towards a decrease in sGAG release in the medium of the DegUnld group compared to the DegLd group. (A, B) The data are represented as mean ± standard deviation. The pink arrows indicate trends.
FIGURE 8
FIGURE 8
Relative (mean ± standard deviation) and absolute disc height change over time showed a decrease in disc height following the one‐strike that was maintained over time and a recovery of the disc height in the DegUnld group to the disc height of the Loading group. (A, B) The one‐strike degenerative trigger decreased the disc height. Globally, the reduced disc height in the DegLd group was maintained over time. In the Loading and DegLd groups, the disc height decreased during the dynamic sessions but increased during the static loading, in contrast to what was observed in the DegUnld group. Additionally, the DegUnld group showed increasing disc height over time, in contrast to the other two groups (p < 0.0001 and p < 0.0001), and the DegUnld group had a disc height similar to the Loading group.
FIGURE 9
FIGURE 9
Evolution of the stiffness of the elastic zone and the hysteresis over time illustrated a persistent lower stiffness and higher hysteresis over time in the DegLd group. (A) The stiffness increased during the dynamic sessions (Cycles 30 to 1439) and decreased during the static loading (Cycles 1439 to 30). The three groups exhibited a similar pattern over time. (B) The hysteresis showed the opposite pattern. (A, B) The impact of the one‐strike degenerative trigger, expressed as a lower stiffness and higher hysteresis in the DegLd group compared to the Loading group, persisted over time (p < 0.0001 on every measurement point). The data are represented as mean ± standard deviation.
FIGURE 10
FIGURE 10
Evolution over time of the different characteristics of the neutral zone (force, displacement and stiffness) in the DegUnld group showed a decrease in the displacement during the unloading sessions and over time. The displacement range of the neutral zone decreased while the force range of the neutral zone increased during the unloading sessions and over time. The data are represented as mean ± standard deviation. Despite the high standard deviation, the mean is representative of the individual data points.

Similar articles

References

    1. Hoy D., March L., Brooks P., et al., “The Global Burden of Low Back Pain: Estimates From the Global Burden of Disease 2010 Study,” Annals of the Rheumatic Diseases 73, no. 6 (2014): 968–974, 10.1136/annrheumdis-2013-204428. - DOI - PubMed
    1. The L. R., “The Global Epidemic of Low Back Pain,” Lancet Rheumatol 5, no. 6 (2023): e305, 10.1016/s2665-9913(23)00133-9. - DOI - PubMed
    1. Videman T., Battié M. C., Parent E., Gibbons L. E., Vainio P., and Kaprio J., “Progression and Determinants of Quantitative Magnetic Resonance Imaging Measures of Lumbar Disc Degeneration: A Five‐Year Follow‐Up of Adult Male Monozygotic Twins,” Spine 33, no. 13 (2008): 1484–1490, 10.1097/BRS.0b013e3181753bb1. - DOI - PubMed
    1. Battie M. C., Videman T., Kaprio J., et al., “The Twin Spine Study: Contributions to a Changing View of Disc Degeneration,” Spine Journal 9, no. 1 (2009): 47–59, 10.1016/j.spinee.2008.11.011. - DOI - PubMed
    1. Adams M. A., Freeman B. J., Morrison H. P., Nelson I. W., and Dolan P., “Mechanical Initiation of Intervertebral Disc Degeneration,” Spine 25, no. 13 (2000): 1625–1636, 10.1097/00007632-200007010-00005. - DOI - PubMed

LinkOut - more resources