. 2025 May 15:54:101314.
doi: 10.1016/j.lanepe.2025.101314. eCollection 2025 Jul.

External exposome and incident asthma across the life course in 14 European cohorts: a prospective analysis within the EXPANSE project

Collaborators, Affiliations

External exposome and incident asthma across the life course in 14 European cohorts: a prospective analysis within the EXPANSE project

Zhebin Yu et al. Lancet Reg Health Eur. .

Abstract

Background: The joint impact of exposure to multiple urban environmental factors on asthma remains unclear.

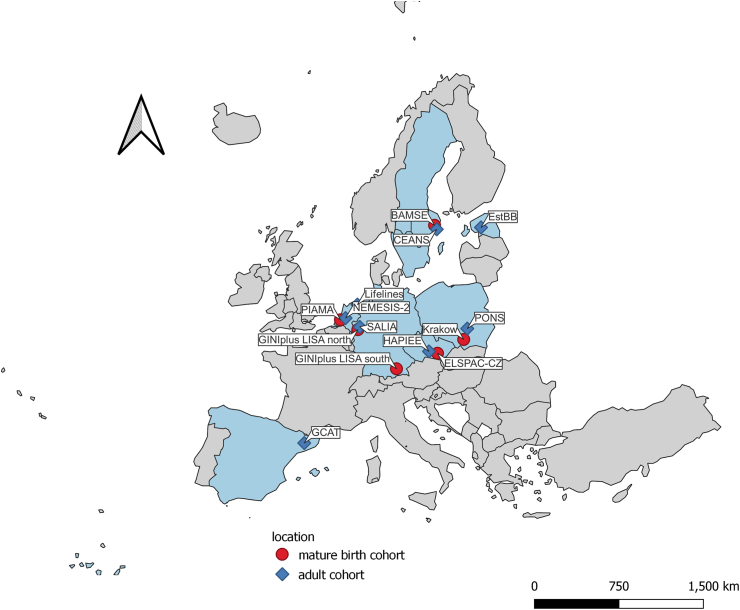
Methods: We analysed data from 14 European cohorts to assess the impact of the urban exposome on asthma incidence across the life course. We linked three external exposome domains (air pollution, built environment, ambient temperature) to the participants' home addresses at baseline. We performed k-means clustering within each domain and assessed associations of clusters with asthma adjusting for potentially relevant covariates in cohort-specific analyses, with subsequent separate meta-analyses for birth and adult cohorts. An environmental risk score using a coefficient-weighted sum approach was used to assess the impact of combining the three domains.

Findings: A total of 7428 incident asthma cases were identified among 349,037 participants (from birth up to age 70+). Overall, we observed higher risks of asthma for clusters characterized by high particulate matter and nitrogen dioxide exposure in adults (ORmeta = 1.13, 95%CI:1.01-1.25), and clusters characterized by high built-up area and low levels of greenness in both children and adults (ORmeta = 1.36, 95%CI: 1.14-1.64 for birth cohorts and ORmeta = 1.15, 95%CI: 1.03-1.28 for adult cohorts, respectively). The joint exposure using the environment risk score combining the three domains was consistently associated with higher risks of incident asthma (ORmeta = 1.13, 95%CI: 1.07-1.20 for birth cohorts, ORmeta = 1.15, 95%CI: 1.10-1.20 for adult cohorts per 20% increase). On average 11.6% of the incident asthma cases could be attributed to environmental risk score above cohort-specific median levels.

Interpretation: Multiple environmental exposures jointly contribute to incident asthma risk across the life course. Urban planning accounting for these factors may help mitigate asthma development.

Funding: This study was funded by the European Union's Horizon 2020 research and innovation program under agreement No 874627 (EXPANSE).

Keywords: Asthma; Cohort; Exposome; Life course.


Conflict of interest statement

GHK reports research grants from ZON-MW (VICI grant), H2020 (Prominent), Netherlands Lung Foundation, Vertex, Ubbo Emmius Foundation, TEVA the Netherlands, outside the submitted work (Money to institution). His institution received financial compensation for advisory board meetings to Astra Zeneca, and lectures from Boehringer-Ingelheim, Sanofi and Astra Zeneca. EM reports advisory board fees from ALK and AstraZeneca; and lecture fees from ALK, AstraZeneca, Chiesi and Sanofi outside the submitted study. PL reports travel expenses for invited lecture at conference on air pollution and health effects from Fondazione Menarini.

Figures

Fig. 1
Fig. 1
Geographical distribution of included cohorts. Note: The light blue areas indicate countries with participating cohorts. The red dots indicate mature birth cohorts and the blue squares indicate adult cohorts. The locations for cohorts with multiple centers may not be accurately reflected on the map due to space limitations.
Fig. 2
Fig. 2
Distribution of environmental exposures at the baseline across the included cohorts. (A) Air pollution domain (B) Built environment domain (C) Ambient temperature domain. The cohorts were ordered based on the geographic location from north to south, with mature birth cohorts in red and adult cohorts in blue. The lower and upper bounds of the box represent the first quartile (Q1) and third quartiles (Q3). The whiskers extend from the Q1 and Q3 to the smallest and largest data points that lie within 1.5 times the interquartile range (IQR) from Q1 and Q3, respectively. Abbreviations: PM2.5, particulate matter with median aerodynamic diameters <2.5 μm; PM10, particulate matter with median aerodynamic diameters <10 μm; NO2, nitrogen dioxide; O3, Ozone; BSI_DIS, distance to the nearest inland fresh water; BSS_DIS, distance to the nearest sea; GSC_DIS, distance to the nearest green space according to the Corine database; IMP, imperviousness; LAN, light at night; NDVI_mean, average of the normalized difference vegetation index; NDVI_sd, standard deviation of the normalized difference vegetation index; Temp_mean, annual average daily temperature; Temp_mean_cold/warm, average of the daily temperature of the cold/warm season; Temp_SD, standard deviation of the daily temperature of the year; Temp_SD_cold/warm, standard deviation of the daily temperature of the cold/warm season. Note: Ambient temperature exposure is not available for EstBB_1.
Fig. 3
Fig. 3
The clusters identified within three external exposome domains and their associations with incident asthma. Panel A, B, C are the numbers (percentages) for each cluster in air pollution, built environment, ambient temperature domains, respectively. Panel D, E, F are radar plots showing the median level of single exposure by clusters. Levels were averaged for all cohorts weighted by the sample size. Panel G, H, I show the associations between the clusters and asthma incident. Estimates were pooled using random-effect models separated by mature birth cohort and adult cohort. Estimates in the birth cohorts were adjusted depending on the availability in the cohorts for age (dummy variable), sex, parental education, parental asthma/hay fever, breastfeeding, native nationality, day care attendance, older siblings, maternal smoking, environmental tobacco smoking, mould/dampness at home, pets, use of gas cooking, active smoking and mutually adjusted for the other two environmental domains. Estimates in the adult cohorts were adjusted depending on the availability in the cohorts for age, sex, smoking status, BMI, marital status, employment status, education level, area-level SES and mutually adjusted for the other two environmental domains.
Fig. 4
Fig. 4
Associations between the environmental risk score (combining three external exposome domains) and asthma incidence. Dots or bars in blue represent results from the adult cohorts, dots or bars in red indicate results from the mature birth cohorts. (A) Cohort-specific and Meta-analysis associations between environment risk score and asthma incidence across the cohorts. Odds Ratio (OR) (95% confidence intervals (CI)) representing each standard deviation increase in the environmental risk score (B) Meta-analysis associations between environmental risk score and asthma incidence stratified by age groups and sex. (C) Meta-analysis associations between the environmental risk score and asthma incidence using natural splines with three degrees of freedom, with shaded area indicating 95% confidence interval band (D) Cohort-specific population attributable fractions for a reduction of the environmental risk score under 50%, black bars indicating the 95% confidence intervals for the population attributable fractions. Estimates in the birth cohorts were adjusted depending on the availability in the cohorts for age (dummy variable), sex, parental education, parental asthma/hay fever, breastfeeding, native nationality, day care attendance, older siblings, maternal smoking, environmental tobacco smoking, mould/dampness at home, pets, use of gas cooking, active smoking and in the adult cohorts were adjusted depending on the availability in the cohorts for age, sex, smoking status, BMI, marital status, employment status, education level, area-level SES.

References

    1. Stern J., Pier J., Litonjua A.A. Asthma epidemiology and risk factors. Semin Immunopathol. 2020;42(1):5–15. - PubMed
    1. GBD 2021 Diseases and Injuries Collaborators Global incidence, prevalence, years lived with disability (YLDs), disability-adjusted life-years (DALYs), and healthy life expectancy (HALE) for 371 diseases and injuries in 204 countries and territories and 811 subnational locations, 1990-2021: a systematic analysis for the Global Burden of Disease Study 2021. Lancet. 2024;403(10440):2133–2161. - PMC - PubMed
    1. Porsbjerg C., Melén E., Lehtimäki L., Shaw D. Asthma. Lancet. 2023;401(10379):858–873. - PubMed
    1. Melén E., Zar H.J., Siroux V., et al. Asthma inception: epidemiologic risk factors and natural history across the life course. Am J Respir Crit Care Med. 2024;210(6):737–754. - PMC - PubMed
    1. Nations U. Department of Economic and Social Affairs; New York: 2018. The world’s cities in 2018—data booklet. Population Division.

LinkOut - more resources