[Preprint]. 2025 Jul 11:2025.01.02.631100.
doi: 10.1101/2025.01.02.631100.

Immunosuppressants Rewire the Gut Microbiome-Alloimmune Axis Through Time-Dependent and Tissue-Specific Mechanisms

Affiliations

Immunosuppressants Rewire the Gut Microbiome-Alloimmune Axis Through Time-Dependent and Tissue-Specific Mechanisms

Long Wu et al. bioRxiv. .

Abstract

Background: Lifelong immunosuppressive therapy is required to prevent allograft rejection in organ transplantation. Current immunosuppressants effectively suppress adaptive and innate immune responses, but their broad, antigen-non-specific effects often result in severe off-target complications. It remains a significant unmet medical need in transplant medicine.

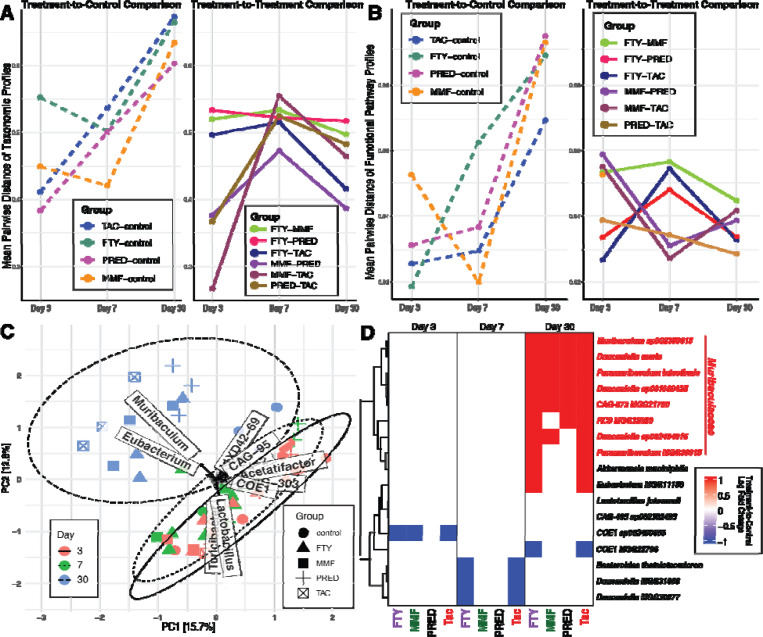
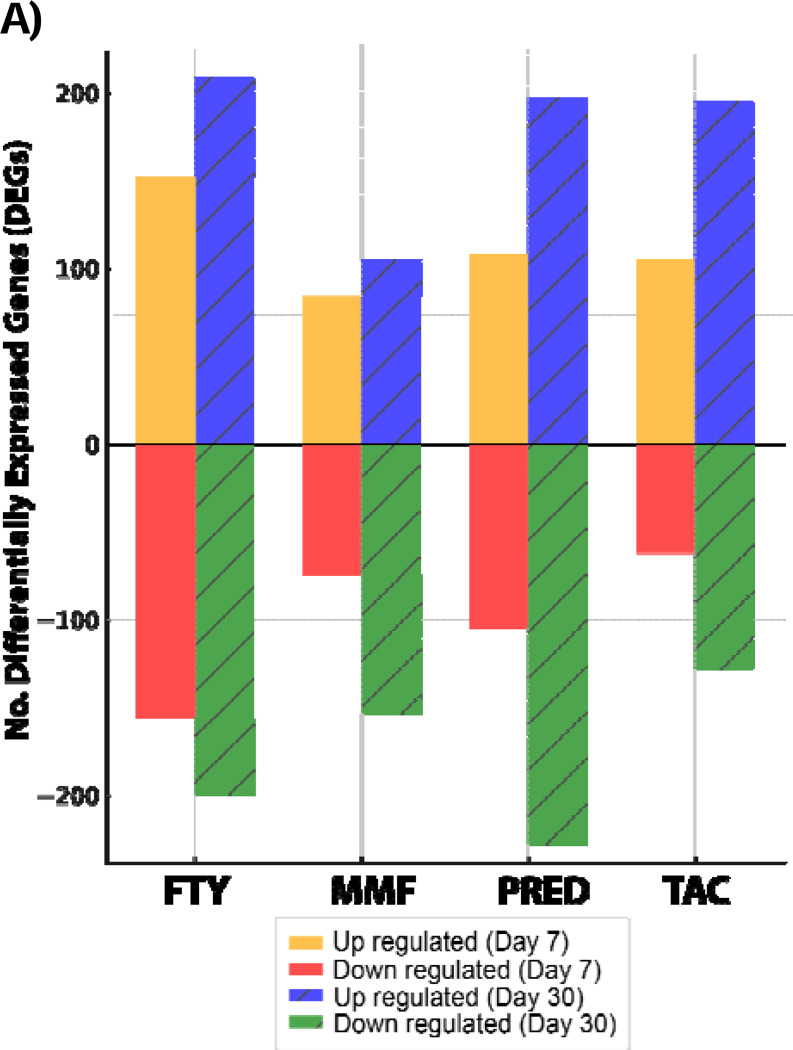
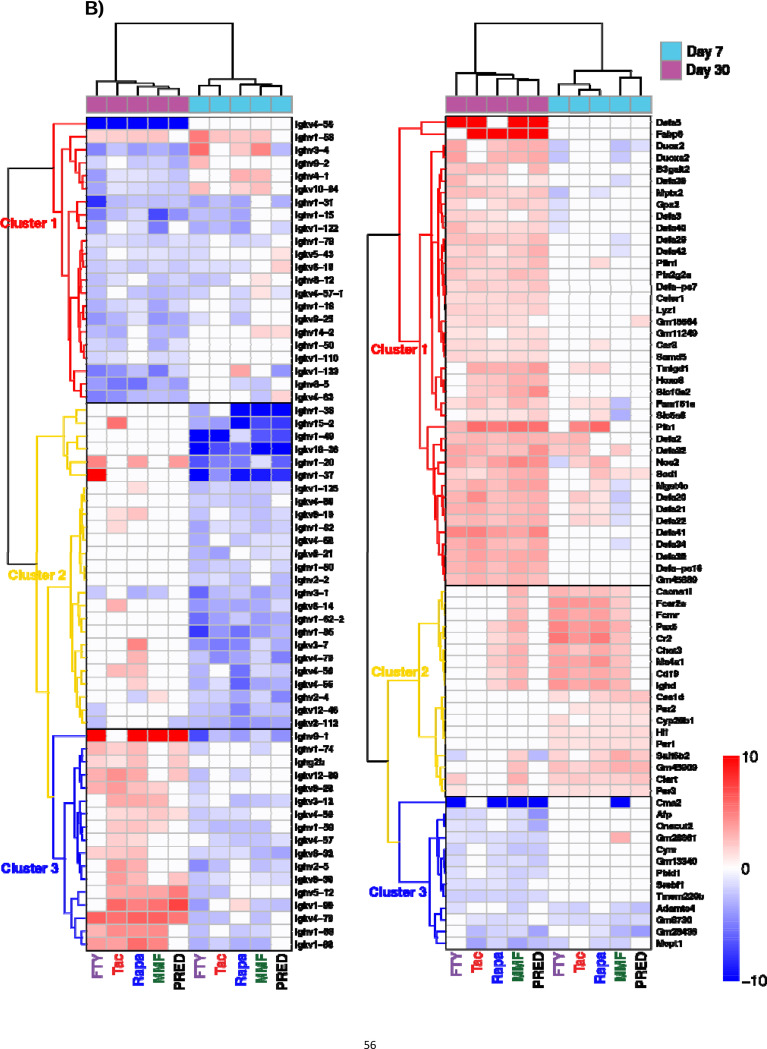
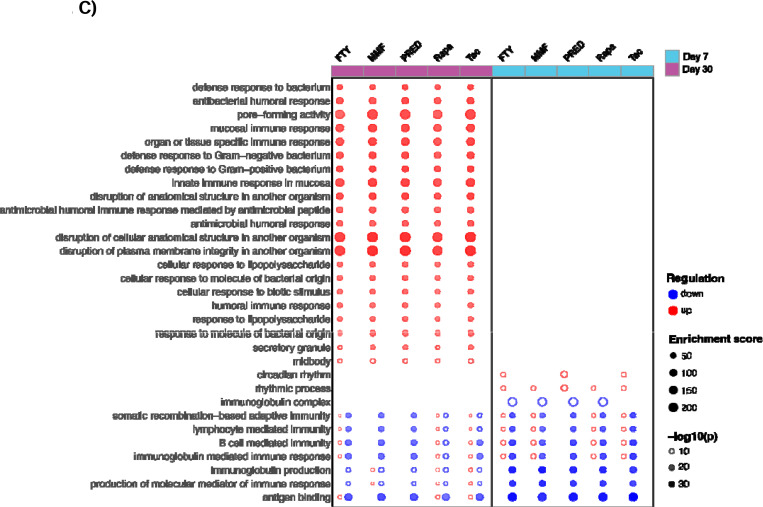
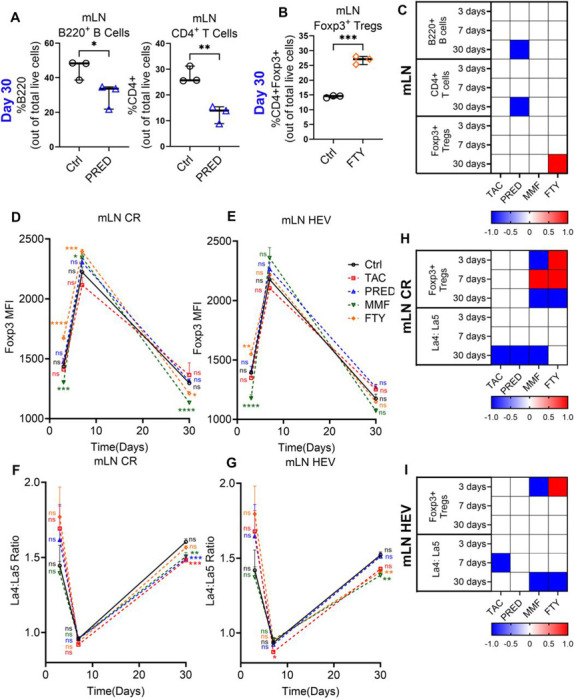
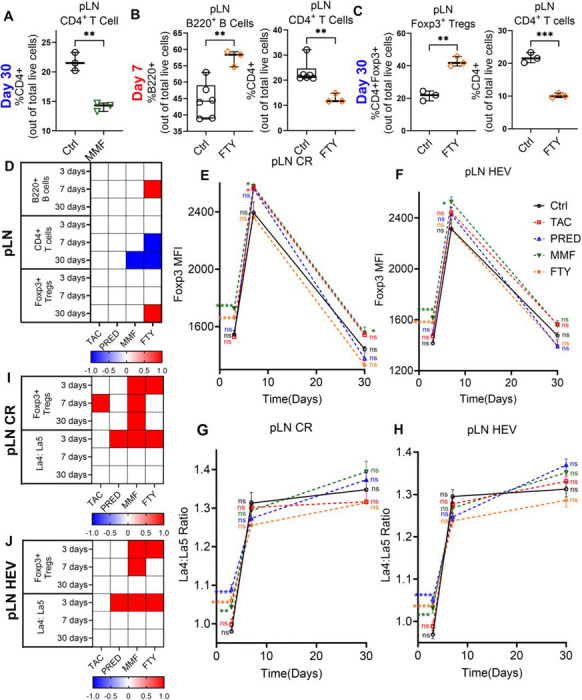
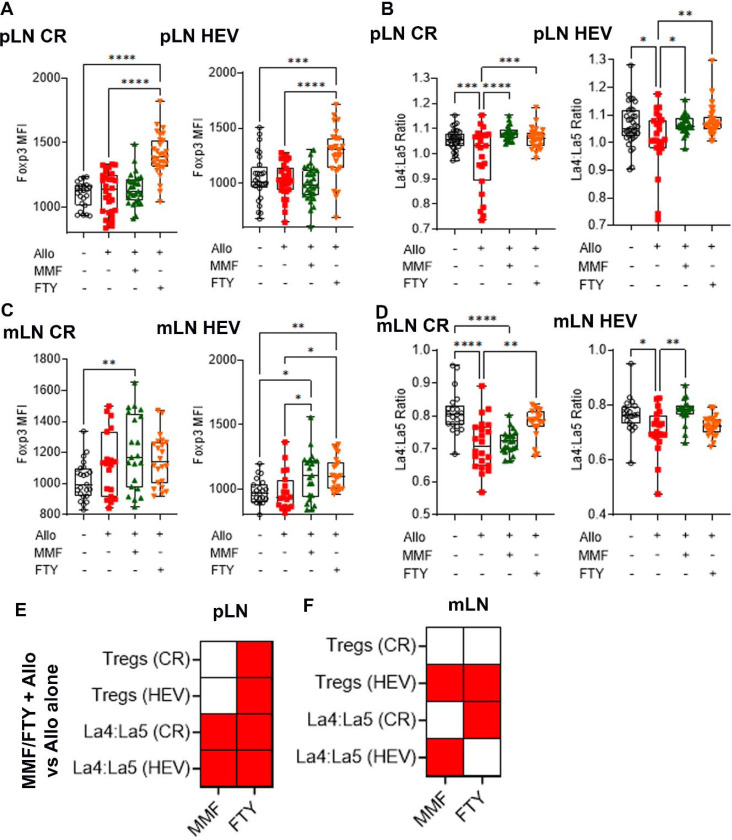
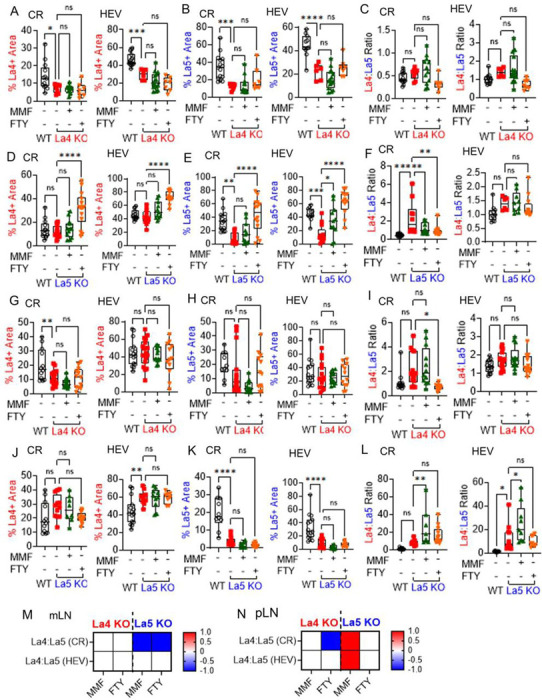
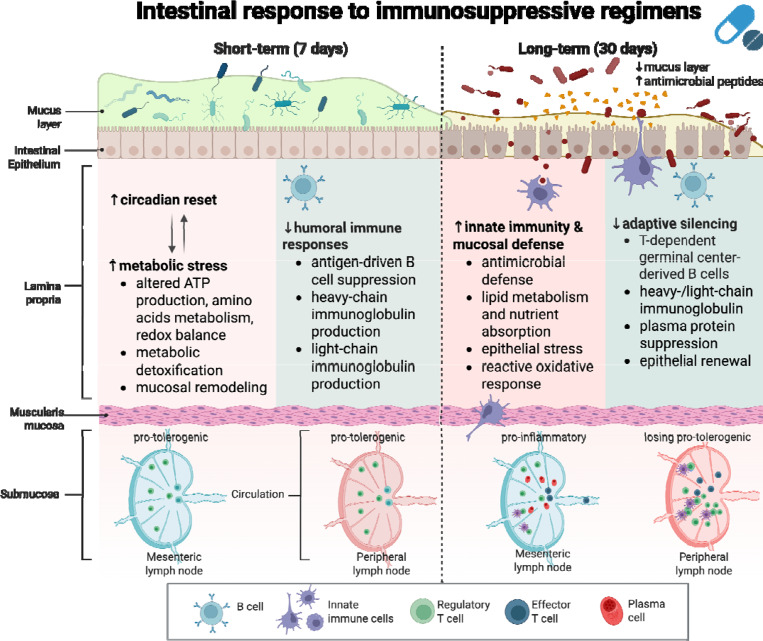
Results: In this study we investigated immunosuppressant effects of four major immunosuppressant classes, including tacrolimus, prednisone, mycophenolate mofetil (MMF), and fingolimod (FTY), on the gut microbiome, metabolic pathways, lymphoid architecture and lymphocyte trafficking after up to 30-day chronic exposure. Despite their distinct mechanisms of action and not designed to target the gut, all immunosuppressive drugs induced profound and time-dependent alterations in both intestine gene expression and gut microbiome composition. Progressive alterations from moderate early, drug-specific changes to a strikingly convergent microbial dysbiosis, marked by significant expansion of pathobionts of Muribaculaceae, occurred across all drug classes. Concurrently, all drugs uniformly induced significant suppression of mucosal immunity including B cell, immunoglobulin, and antigen recognition. Time-dependent changes in lymph node (LN) reorganization and cellular composition were also observed, marked by a progressive shift toward pro-inflammatory phenotypes in gut-draining mesenteric LNs and a gradual loss of tolerogenic architecture in peripheral LNs. Drug-specific metabolic alterations and distinct phases of intestinal transcriptional responses were also characterized. Notably, MMF and FTY demonstrated the most robust immunomodulatory properties, and were able to suppress alloantigen-induced inflammation through mediating regulatory T cell distribution and LN remodeling.

Conclusions: Together, these findings highlight the underappreciated complexity and temporal dynamics immunosuppressants effects, particularly their impact on the gut and compartmentalized regulation of alloimmune in lymphoid tissues. Understanding these relationships offers new opportunities for refining immunosuppressive strategies to reduce treatment-related off-target complications and improve long-term organ transplant outcomes.

Keywords: gut dysbiosis; immunology; immunosuppressants; metabolome; microbiome.


Conflict of interest statement

Competing interests No potential financial and non-financial conflict of interest was reported by the authors.

Figures

Figure 1:
Figure 1:. Impact of immunosuppressant treatment on gut microbiome composition and function.
Pairwise Bray-Curtis distance analysis comparing drug-treated groups to untreated controls and between different treatment groups to measure changes in A) taxonomic composition, and B) functional pathway abundance. Distances represent mean values per group. Untreated mice as control group. C) Principal Components Analysis of gut microbiome composition based on Bray-Curtis distance. Robust centered log ratio transformation applied on count compositional data. D) Differentially abundant taxonomic groups identified by pairwise comparisons between treatment groups and controls. Changes in abundance are expressed as log2 fold changes relative to control group.
Figure 2:
Figure 2:. Immunosuppressants temporally shift intestinal immune responses.
A) Bar plots showing the number of differentially expressed genes (DEGs) after 7 and 30 days of treatment compared to the control group. Yellow and blue bars indicate the number of upregulated genes, while red and green bars represent the number of downregulated genes. B) Heatmap DEGs in intestinal tissue following treatment with five immunosuppressant drugs at days 7 and 30. Transcriptomic data from rapamycin-treated mice from our previously study integrated in current analysis. Genes defined as differentially expressed in at least four of the five drug treatment groups at either time point. Hierarchical clustering performed on both genes (rows) and samples (columns) using Euclidean distance and ward linkage. Color scale indicates normalized Z-scores of expression values, with red denoting upregulation and blue denoting downregulation relative to no-treatment controls. C) Functional enrichment analysis of conserved intestinal transcriptional responses to immunosuppressant treatments. Dot plot showing over-represented Gene Ontology (GO) biological process pathway based on DEGs at days 7 and 30. EnrichGO pathways containing more than three genes were included in this plot. Dot size denotes the normalized enrichment score. Blue downregulated and red upregulated pathways; color shaded based on the –log10(p-value) of enrichment. Abbr: TAC: tacrolimus, MMF: mycophenolate mofetil, PRED: prednisone, FTY: fingolimod, RAPA: rapamycin
Figure 3:
Figure 3:. Effects of TAC, PRED, MMF, and FTY on mLN cell content, cell distribution, and structure.
Flow cytometry analysis of A) B220+ B cells and CD4+ T cells on day 30 after PRED treatment and B) Foxp3+ Tregs on day 30 after FTY treatment in mLNs. C) Heatmaps depict changes in expression with TAC, PRED, MMF, and FTY relative to controls in mLNs after 3, 7, and 30 days of treatment. IHC of D) CR and E) HEV Foxp3+ Tregs on days 3, 7, and 30 in mLNs. IHC of F) CR and G) HEV La4: La5 on days 3, 7, and 30 in mLNs. Barplot showing detailed plots at each timepoint are in Supplemental Figure 6. Heatmaps depict changes in expression with TAC, PRED, MMF, and FTY relative to controls in H) CR and I) around HEV in mLNs. 3 mice/group. 2–3 LNs/mouse, 2–3 sections/LN, 7–30 fields/tissue. One-way ANOVA. * p < 0.05; ** p < 0.01, *** p < 0.001, **** p < 0.0001.
Figure 4:
Figure 4:. Effects of TAC, PRED, MMF, and FTY on pLN cell content, cell distribution, and structure.
Flow cytometry analysis of A) CD4+ T cells on day 30 after MMF treatment, and B) B220+ B cells and CD4+ T cells on day 7 and C) CD4+ T cells and Foxp3+ Tregs after FTY treatment in pLNs. D) Heatmaps depict changes in expression with TAC, PRED, MMF, and FTY relative to controls in pLNs after 3, 7, and 30 days of treatment. IHC of E) CR and F) HEV Foxp3+ Tregs on days 3, 7, and 30 in pLNs. IHC of G) CR and H) La4: La5 on days 3, 7, and 30 in pLNs. Barplot showing detailed plots at each timepoint are in Supplemental Figure 7. Heatmaps depict changes in expression with TAC, PRED, MMF, and FTY relative to controls in I) CR and J) around HEV in pLNs. 3 mice/group. 2–3 LNs/mouse, 2–3 sections/LN, 7–30 fields/tissue. One-way ANOVA. * p < 0.05; ** p < 0.01, *** p < 0.001, **** p < 0.0001.
Figure 5.
Figure 5.. MMF and FTY induce a rapid anti-inflammatory response during allogeneic stimulation.
IHC for Foxp3+ Tregs in the A) pLN and C) mLN. La4:La5 in B) pLN and D) mLN. Heatmap summarizes significant changes in expression comparing allogeneic stimulation plus MMF or FTY to allogeneic stimulation alone in E) pLNs and F) mLNs. 3 mice/group. 2–3 LNs/mouse, 2–3 sections/LN, 7–30 fields/tissue. One-way ANOVA: * p < 0.05, ** p < 0.01, *** p < 0.001, **** p < 0.0001.
Figure 6.
Figure 6.. MMF and FTY decrease the La4:La5 in FRC-Lama5-KO mLNs and pLNs.
IHC showing A, D, G, J) laminin α4; B, E, H, K) laminin α5; and C, F, I, L) La4:La5 in mLNs (A-F, M) and pLNs (G-L, N) of WT and FRC-Lama4-KO (A-C and G-I) and FRC-Lama5-KO mice (D-F and J-L) on day 3. M, N) Heatmap summarizes significant changes relative to controls in M) mLN and N) pLN. 3–5 mice/group. 2–3 LNs/mouse, 2–3 sections/LN, 7–30 fields/tissue. One-way ANOVA: * p < 0.05, ** p < 0.01, *** p < 0.001, **** p < 0.0001.
Figure 7.
Figure 7.
Illustration of shared intestinal responses in response to immunosuppressant regimens. Created in BioRender. Ma, B. (2025) https://BioRender.com/ctcfgx9.

Similar articles

References

    1. Lodhi S.A., Lamb K.E., and Meier-Kriesche H.U. (2011). Solid Organ Allograft Survival Improvement in the United States: The Long-Term Does Not Mirror the Dramatic Short-Term Success. American Journal of Transplantation 11, 1226–1235. 10.1111/j.1600-6143.2011.03539.x. - DOI - PubMed
    1. Dai H., Zheng Y., Thomson A.W., and Rogers N.M. (2020). Transplant Tolerance Induction: Insights From the Liver. Frontiers in Immunology 11. 10.3389/fimmu.2020.01044. - DOI - PMC - PubMed
    1. Fishman J.A. (2017). Infection in Organ Transplantation. Am J Transplant 17, 856–879. 10.1111/ajt.14208. - DOI - PubMed
    1. Gallagher M.P., Kelly P.J., Jardine M., Perkovic V., Cass A., Craig J.C., Eris J., and Webster A.C. (2010). Long-term cancer risk of immunosuppressive regimens after kidney transplantation. J Am Soc Nephrol 21, 852–858. 10.1681/ASN.2009101043. - DOI - PMC - PubMed
    1. Schmitz V., Klawitter J., Bendrick-Peart J., Schoening W., Puhl G., Haschke M., Klawitter J., Consoer J., Rivard C.J., Chan L., et al. (2009). Metabolic profiles in urine reflect nephrotoxicity of sirolimus and cyclosporine following rat kidney transplantation. Nephron Exp Nephrol 111, e80–91. 10.1159/000209208. - DOI - PubMed

Publication types

LinkOut - more resources