[Preprint]. 2025 Jul 7:2025.07.07.663474.
doi: 10.1101/2025.07.07.663474.

Identification and characterization of functional and trans-dominant negative HERV-K (HML-2) Rec proteins encoded in the human genome

Affiliations

Identification and characterization of functional and trans-dominant negative HERV-K (HML-2) Rec proteins encoded in the human genome

Katarzyna Zurowska et al. bioRxiv. .

Abstract

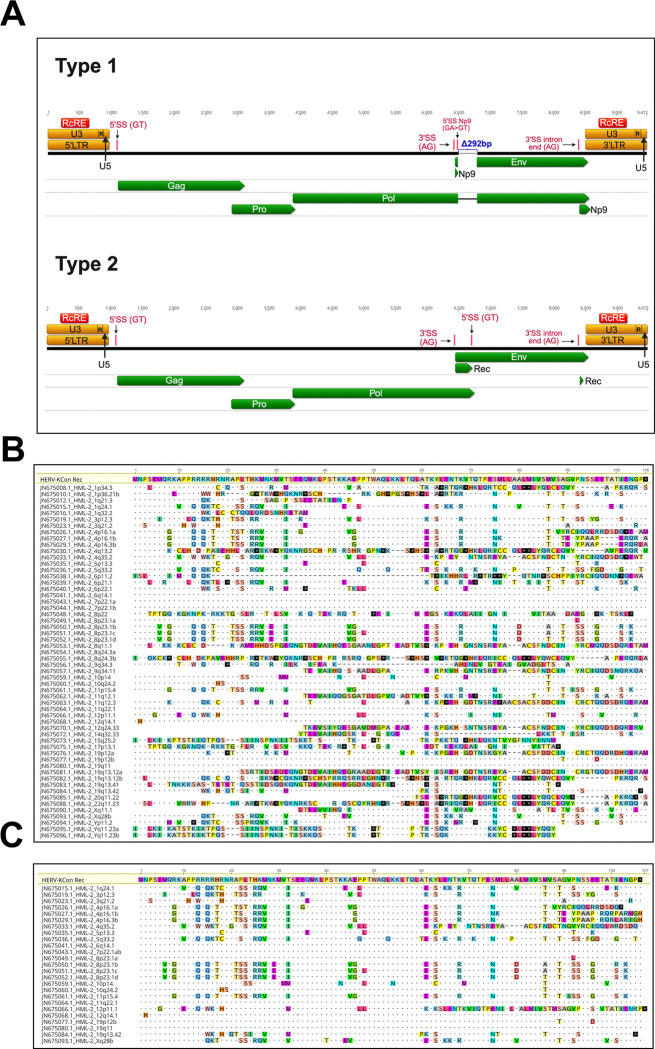
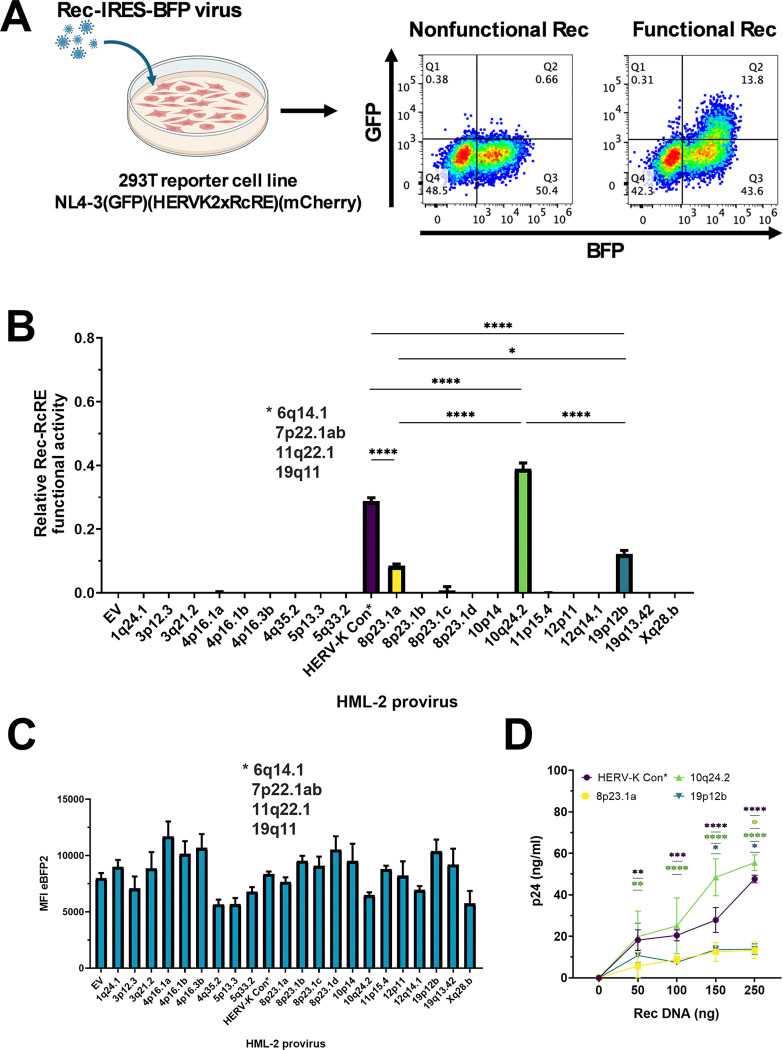
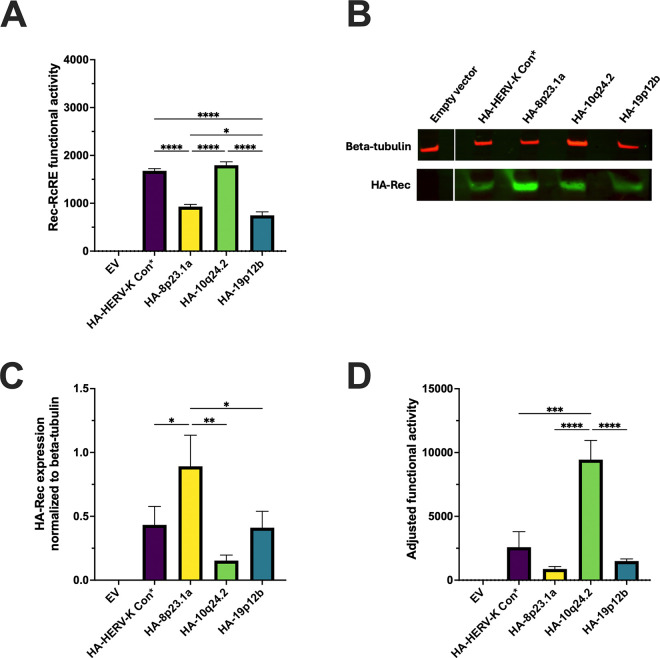
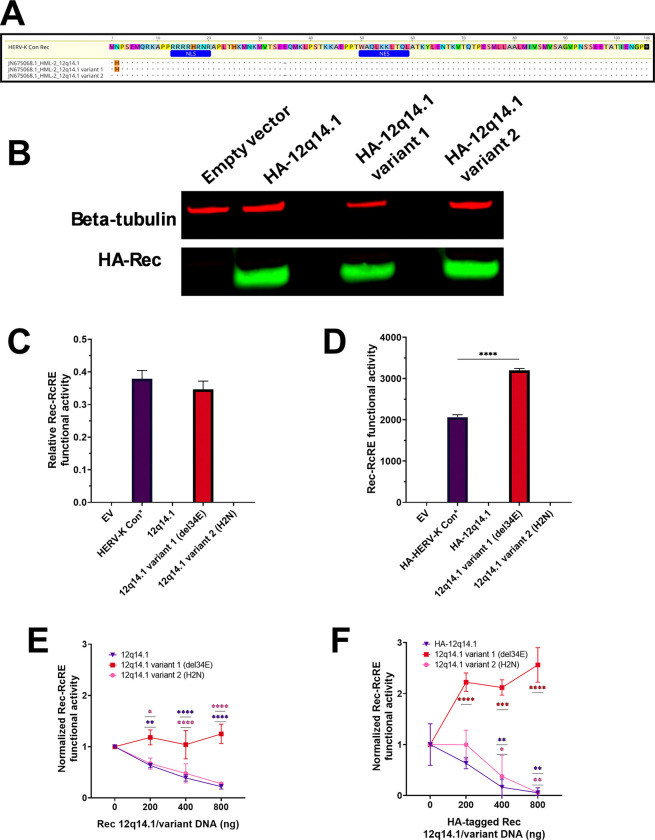
Human Endogenous Retroviruses K (HERV-K) of the HML-2 subgroup are the most recently integrated and biologically active retroviral elements within the human genome. The HERV-K Rec protein, a functional homolog of HIV Rev and HTLV Rex, is necessary for the nuclear export of viral mRNAs with retained introns. However, the diversity of Rec proteins encoded in the human genome and their functional capacities have remained largely unexplored. We identified full-length Rec protein sequences in the human genome and selected 23 variants for functional characterization. Using a dual-color fluorescent reporter and a complementary ELISA assay, we found that Rec proteins from only 7 genomic loci were functional. In addition, a subset of the non-functional Rec proteins exerted trans-dominant negative effects. Detailed mutational analysis of the most potent inhibitory variant, encoded by the HERV-K provirus 12q14.1, displayed only 2 amino acid changes (H2N and del34E) relative to the prototypical functional Rec protein encoded by the reconstructed consensus HERV-K (HERV-K Con). Insertion of a glutamic acid at position 34 restored the functional activity, while the substitution of histidine with asparagine at position 2 did not. Our results unveil an unexpected complexity in HERV-K (HML-2) post-transcriptional regulation, with Rec variants displaying a spectrum of activities ranging from robust nuclear export of RNA with retained introns to trans-dominant negative inhibition of Rec function. These findings expand our understanding of the regulatory landscape governing HERV-K (HML-2) expression and suggest mechanisms by which different HERV-K Rec proteins may influence host cell biology and pathology, including oncogenesis.


Figures

Figure 1:
Figure 1:. Bioinformatic characterization and selection of HERV-K HML-2 Rec Proteins for functional analysis.
(A) Diagram of the primary features of the HERV-K Con provirus, including long terminal repeats (LTRs), open reading frames (ORFs), and specific splice sites. This schema was used for the annotation of type 1 (modified version with a 292 bp deletion in the pol-env junction: top panel) and type 2 (the original HERV-K Con: bottom panel) proviral reference genomes. Relative to type 2, there is an A to T point mutation in many type 1 viruses that introduces a stop codon in the env reading frame. This also creates a new 5’ splice site, which allows for the generation of a doubly spliced mRNA that encodes the Np9 protein. Eight bases downstream from the splice site, the 292 bp deletion removes most of the first coding exon of rec. A downstream methionine in type 1 viruses may allow for translation of a N-terminally truncated Env protein. This protein would not be expected to be glycosylated, as it lacks a signal peptide. (B) Alignment of translated Rec coding sequences (extracted and joined using the known splice sites in type 2 proviruses) to the HERV-K Con Rec protein. This process yielded 56 distinct Rec protein sequences. Differences relative to the HERV-K Con Rec protein sequence are highlighted in color. Dots represent identical amino acid residues, while dashes represent a deletion. Stop codons are highlighted as black squares with a * symbol. (C) Comparative sequence analysis of the 26 full-length Rec proteins. Differences relative to the HERV-K Con Rec sequence are highlighted in color. Dots represent identical amino acid residues, while dashes represent a deletion. Stop codons are highlighted as black squares with a * symbol.
Figure 2:
Figure 2:. Functional Analysis of HERV-K Rec Proteins.
(A) Schematic of the dual-color Rec-RcRE reporter assay using retroviral vectors expressing Rec and eBFP2. The cells contain a reporter vector that constitutively produces mCherry from a fully spliced transcript. Upon transduction with the Rec-expressing vectors, the mCherry-positive cells also express eBFP2. Functional Rec proteins interact with the RcRE, promoting nuclear export of the unspliced mRNA encoding GFP (right flow chart). Non-functional Rec proteins result in only eBFP2 expression (left flow chart). (B) Quantification of Rec functional activity using the dual-color reporter assay by flow cytometry analysis performed 72 hours post-transduction. 293T RcRE reporter cells were transduced with vectors expressing the various Rec proteins and eBFP2. Rec activity was assessed by gating on mCherry-positive cells, selecting eBFP2-positive cells (indicating Rec vector expression), and measuring GFP and eBFP2 expression. Rec-RcRE activity was calculated as the ratio of GFP mean fluorescence intensity to eBFP2 mean fluorescence intensity. The HERV-K Con Rec sequence represents four identical Rec proteins (6q14.1, 7p22.1ab, 11q22.1, 19q11) (marked with an asterisk). The data is shown as the mean value ± SD from three independent experiments. Significant differences were assessed by ordinary One-Way ANOVA with Tukey’s post-hoc test (*p<0.05, ****p<0.0001). (C) Transduction of the 293T/17 RcRE reporter cells with Rec and eBFP2 expressing vectors. The MFI of eBFP2 expressed from each of the individual transductions in (B) was determined using flow cytometry. Data shown as mean ± SD from three independent experiments. (D) Validation of Rec activity using a p24 release assay. 293T/17 cells were co-transfected with equal amounts of a Gag-Pol-RcRE reporter vector (1500 ng) and increasing amounts of functional Rec vectors (50, 100, 150, 250 ng). An empty vector was used to normalize the total DNA input to 2000 ng. Supernatants were collected at 72 hours post-transfection and p24 was then measured by ELISA. The data shown are the mean values ± SD from three independent experiments. Statistical significance was assessed by ordinary Two-Way ANOVA with Dunnett’s multiple comparisons post-hoc test (*p<0.05, **p<0.01, ***p<0.001, ****p<0.0001).
Figure 3:
Figure 3:. Functional Analysis and Quantitation of HA-Tagged Rec Proteins
(A) Functional activity of HA-tagged Rec variants. 293T RcRE reporter cells were transfected using lipofectamine 3000 with vectors expressing the various Rec proteins. GFP MFI was measured 72 hours post-transfection as an indication of Rec functional activity. HERV-K Con Rec (marked with an asterisk) represents four identical Rec protein sequences (6q14.1, 7p22.1ab, 11q22.1, 19q11). Statistical significance assessed by ordinary One-Way ANOVA with Tukey’s post-hoc test (*p<0.05, **p<0.01, ***p<0.001, ****p<0.0001). (B) Western blot analysis of HA-tagged Rec protein expression. Upper panel: β-tubulin loading control; lower panel: HA-tagged Rec detection. Representative Western blot from two independent experiments using two different plasmid preparations. (C) Quantification of HA-tagged Rec protein expression levels normalized to β-tubulin loading control. Data represent the mean value ± SD from two independent experiments with triplicate samples using two different plasmid preparations. Statistical significance assessed by ordinary One-Way ANOVA with Tukey’s post-hoc test (*p<0.05, ***p<0.001). (D) Functional activity of HA-Rec variants normalized to protein expression. Rec-RcRE functional activity (from panel A) was normalized to HA-tagged protein expression levels (panel C) by calculating the ratio of GFP MFI to normalized HA-Rec levels. Data represents the mean value ± SD from 2 independent experiments with triplicate samples using two different plasmid preparations.
Figure 4:
Figure 4:. Analysis of selected non-functional HERV-K Rec proteins and their trans-dominant negative effects.
(A) Multiple sequence alignment of selected non-functional Rec proteins (3q21.2, 5p13.3, 10p14, and 12q14.1) to the reference HERV-K Con Rec. Selected variants contain fewer than 15 amino acid changes compared to the consensus sequence. Amino acid differences are highlighted in color and shown in uppercase letters. Dots indicate residues identical to HERV-K Con Rec; dashes represent deletions. Position numbers correspond to HERV-K Con Rec sequence. Functional domains are annotated in blue (NLS: nuclear localization signal; NES: nuclear export signal). (B) Western blot analysis of non-functional Rec protein expression. Upper panel: β-tubulin loading control; lower panel: HA-tagged Rec protein detection. A Western blot representative of two independent experiments using two different plasmid preparations is shown. (C) Trans-dominant negative activity analysis using untagged Rec variants in 293T/17 RcRE reporter cells. Cells were co-transfected with a constant amount of HERV-K Con Rec (100 ng) and increasing amounts (0–800 ng) of non-functional Rec-expressing plasmids, maintaining total DNA at 2000 ng with empty vector. Control samples received 100 ng HERV-K Con Rec plus 1900 ng empty vector. GFP expression was measured by flow cytometry 72 hours post-transfection and normalized, with the control sample set to 1.0. Rec-RcRE functional activity was plotted as mean fluorescence intensity (MFI) of GFP. Data represent the mean value ± SD from three independent experiments. Statistical significance was assessed by ordinary Two-Way ANOVA with Dunnett’s multiple comparisons post-hoc test (*p<0.05, **p<0.01, ****p<0.0001). (D) Trans-dominant negative activity analysis using HA-tagged Rec variants in 293T/17 RcRE reporter cells. Cells were co-transfected with HERV-K Con Rec (100 ng) and increasing amounts (0–800 ng) of HA-tagged non-functional Rec variants. Data was collected, analyzed and normalized as described in (C). Data represent the mean value ± SD from three independent experiments. Statistical significance assessed by ordinary Two-Way ANOVA with Dunnett’s multiple comparisons post-hoc test (**p<0.01, ***p<0.001, ****p<0.0001).
Figure 5:
Figure 5:. Mutational Analysis of the Trans-dominant Negative Rec 12q14.1.
(A) Sequence alignments of Rec 12q14.1 variants relative to the HERV-K Con Rec sequence. The alignments show the HERV-K Con Rec sequence, the original Rec 12q14.1, and the two generated variants: Variant 1 (del34E) and Variant 2 (H2N). Amino acid differences are highlighted in color and shown in uppercase letters. Dots represent identical residues to the consensus sequence; dashes indicate deletions. Position numbers correspond to the HERV-K Con Rec consensus sequence. Functional domains are annotated in blue (NLS: nuclear localization signal; NES: nuclear export signal). (B) Western blot analysis of Rec variant protein expression. Upper panel: β-tubulin loading control; lower panel: HA-tagged Rec protein detection. A Western blot representative of two independent experiments using two different plasmid preparations is shown. (C) Functional analysis of Rec variants in 293T/17 RcRE reporter cells. Cells were transduced with retroviral vectors expressing each variant or HERV-K Con Rec (positive control). Fluorescent protein expression was then measured by flow cytometry 72 hours post-transduction. Rec-RcRE functional activity is plotted as the ratio of GFP MFI to eBFP2 MFI. Data represent the mean value ± SD from three independent experiments. Statistical significance was assessed using ordinary One-Way ANOVA with Tukey’s multiple comparisons post-hoc test. D) Functional analysis of HA-tagged Rec variants in 293T/17 2xRcRE reporter cells. Cells were transfected with retroviral vectors expressing each HA-tagged variant or HERV-K Con Rec (positive control). GFP expression was measured by flow cytometry 72 hours post-transduction. Rec-RcRE functional activity was plotted as MFI of GFP. The data represent the mean value ± SD from three independent experiments. Statistical significance assessed using ordinary One-Way ANOVA with Tukey’s multiple comparisons post-hoc test (***p<0.001). (E) Trans-dominant negative activity analysis using untagged Rec variants. 293T/17 2xRcRE reporter cells were co-transfected with HERV-K Con Rec (100 ng) and increasing amounts (0–800 ng) of untagged variants, keeping total DNA at 2000 ng with empty vector. The data were collected, analyzed and normalized as described in Figure 4C. The data represent the mean value ± SD from three independent experiments. Statistical significance was assessed by ordinary Two-Way ANOVA with Dunnett’s multiple comparisons post-hoc test (*p<0.05, **p<0.01, ****p<0.0001). (F) Trans-dominant negative activity analysis using HA-tagged Rec variants under identical conditions as panel (E). Cells were co-transfected with HERV-K Con Rec (100 ng) and increasing amounts (0–800 ng) of HA-tagged variants. The data were collected, analyzed and normalized as described in Figure 4C. Data represent the mean value ± SD from three independent experiments. Statistical significance assessed by ordinary Two-Way ANOVA with Dunnett’s multiple comparisons post-hoc test (*p<0.05, **p<0.01, ***p<0.001, ****p<0.0001).

Similar articles

References

    1. Bannert N, Kurth R. 2006. The evolutionary dynamics of human endogenous retroviral families. Annu Rev Genomics Hum Genet 7:149–73. - PubMed
    1. Katzourakis A, Rambaut A, Pybus OG. 2005. The evolutionary dynamics of endogenous retroviruses. Trends Microbiol 13:463–8. - PubMed
    1. Stoye JP. 2012. Studies of endogenous retroviruses reveal a continuing evolutionary saga. Nat Rev Microbiol 10:395–406. - PubMed
    1. Mayer J, Blomberg J, Seal RL. 2011. A revised nomenclature for transcribed human endogenous retroviral loci. Mob DNA 2:7. - PMC - PubMed
    1. Subramanian RP, Wildschutte JH, Russo C, Coffin JM. 2011. Identification, characterization, and comparative genomic distribution of the HERV-K (HML-2) group of human endogenous retroviruses. Retrovirology 8:90. - PMC - PubMed

Publication types

LinkOut - more resources