[Preprint]. 2025 Jul 8:2025.06.25.661453.
doi: 10.1101/2025.06.25.661453.

Autophagy activators normalize aberrant Tau proteostasis and rescue synapses in human familial Alzheimer's disease iPSC-derived cortical organoids

Affiliations

Autophagy activators normalize aberrant Tau proteostasis and rescue synapses in human familial Alzheimer's disease iPSC-derived cortical organoids

Sergio R Labra et al. bioRxiv. .

Abstract

Alzheimer's disease (AD) is the most common form of dementia worldwide. Despite extensive progress, the cellular and molecular mechanisms of AD remain incompletely understood, partially due to inadequate disease models. To illuminate the earliest changes in hereditary (familial) Alzheimer's disease, we developed an isogenic AD cerebrocortical organoid (CO) model. Our refined methodology produces COs containing excitatory and inhibitory neurons alongside glial cells, utilizing established isogenic wild-type and diseased human induced pluripotent stem cells (hiPSCs) carrying heterozygous familial AD mutations, namely PSEN1ΔE9/WT, PSEN1M146V/WT, or APPswe/WT. Our CO model reveals time-progressive accumulation of amyloid beta (Aβ) species, loss of monomeric Tau, and accumulation of aggregated high-molecular-weight (HMW) phospho(p)-Tau species. This is accompanied by neuronal hyperexcitability, as observed in early human AD cases on electroencephalography (EEG), and synapse loss. Single-cell RNA-sequencing analyses reveal significant differences in molecular abnormalities in excitatory vs. inhibitory neurons, helping explain AD clinical phenotypes. Finally, we show that chronic dosing with autophagy activators, including a novel CNS-penetrant mTOR inhibitor-independent drug candidate, normalizes pathologic accumulation of Aβ and HMW p-Tau, normalizes hyperexcitability, and rescues synaptic loss in COs. Collectively, our results demonstrate these COs are a useful human AD model suitable for assessing early features of familial AD etiology and for testing drug candidates that ameliorate or prevent molecular AD phenotypes.

Keywords: Alzheimer’s disease; Amyloid Beta Precursor Protein; Autophagy; Cortical organoids; Presenilin 1; Tau; chronic treatment; human model; iPSC-derived; oligomers; pTau.


Conflict of interest statement

DECLARATION OF INTERESTS J.W.K. discloses that he receives royalties for Tafamidis sales as an inventor and has received additional payments from Pfizer. J.W.K is a founder and major shareholder of Protego, which is developing immunoglobulin light chain kinetic stabilizers and other stabilizers for misfolding diseases; he serves on its Board of Directors and Scientific Advisory Board and acts as a consultant. He serves as a consultant for the Dominantly Inherited Alzheimer Network Trial Unit in reviewing drug candidates. S.A.L discloses that he is an inventor on worldwide patents for the use of memantine and NitroSynapsin (aka NitroMemantine, YQW-036, or EM-036) for neurodegenerative and neurodevelopmental disorders. Per Harvard University guidelines, S.A.L. participates in a royalty-sharing agreement with his former institution Boston Children’s Hospital/Harvard Medical School, which licensed the drug memantine (Namenda®) to Forest Laboratories, Inc./Actavis/Allergan/AbbVie. S.A.L. was scientific founder of Adamas Pharmaceuticals, Inc. (now owned by Supernus Pharmaceuticals, Inc.), which developed or comarketed FDA-approved forms of memantine- or amantadine-containing drugs (NamendaXR®, Namzaric®, and GoCovri®). NitroSynapsin is licensed to the biotechnology company EuMentis Therapeutics, Inc., for which SAL is scientific founder and chair of the Scientific Advisory Board (SAB). SAL is also a member of the SAB of Point 6 Bio. Ltd., and has recently served as a consultant to Circumvent Pharmaceuticals, Inc. Further, SAL discloses that he is a named inventor on patent(s) filed by his current institution, The Scripps Research Institute, for novel MEF2 and NRF2 transcriptional activators in the treatment of systemic and nervous system diseases via neuroprotective, anti-inflammatory, and antioxidant actions

Figures

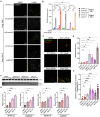
Figure 1:
Figure 1:. Generation of isogenic AD Cos
(A) Schematic describing the differentiation of cerebrocortical organoids (COs) with representative brightfield images. Scale bar, 1 mm. (B) Quantification of the CO maximal cross-sectional area distribution across genotypes at approximately week 5 in culture, n = 13–26 COs per genotype for isogenic Set 1, n = 6–9 COs per genotype; each from 4 independent CO induction batch experiments. Data are mean ± SD. Analysis by ANOVA with Dunnett’s post-hoc test. (C) Representative immunofluorescence (IF) stains of neuroepithelial (SOX2+) and neuronal progenitor (TUJ1+) cells at ~7-week timepoint COs. Scale bar, 100 μm. (D) Representative IF stains of mature postmitotic neurons (MAP2+) in COs at ~7-week timepoint. Scale bar, 100 μm. (E) Representative IF stains for mature cortical layer neurons (TBR1+) cells in a 7-week timepoint CO with two highlighted insets to the right. Scale bar, 100 μm. (F) Representative IF stains for deep layer V (CTIP2+) and upper layer II-III (SATB2+) cells in a 3-month timepoint CO with inset to the right. Scale bars, 100 μm. (G) Representative IF stains of astrocytes (S100β+) 3-month timepoint COs. Scale bars, 25 μm. (H) Representative IF stains of oligodendrocytes (PLP1+) 3-month timepoint COs. Scale bar, 25 μm. See also Figure S1.
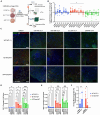
Figure 2:
Figure 2:. COs recapitulate key cellular diversity
(A) Annotated UMAP clustering of CO’s single cell-RNA-seq at 2-month and 3-month timepoints, n = 27 COs in total from 5 independent experiments, processed into 4 sequencing runs. (B) Feature plots demonstrating the specific segregation of cell-types by the hallmark gene marker expression of key cell type markers. Highlighted here are Excitatory neurons (NEUROD6 and SLC17A6, aka VGLUT2); Inhibitory neurons (GAD1 and SLC32A1); Astroglia (S100B), and Oligodendrocytes (PLP1). (C) Heatmap ordered by similarity showing the differential expression of hallmark marker genes in all identified cell subtypes. See also Figure S2F. (D) Bar plot showing the relative composition or abundance of cell types in the COs at 3-month timepoint. See also Figures S2, S3, S4, and S5.
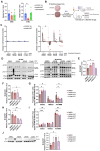
Figure 3:
Figure 3:. AD COs recapitulate amyloid and pTau pathologic signatures
(A) Aβ1–40 and Aβ1–42 concentrations in conditioned media from 5–6 months-of-age COs. n = 4–5 independent CO replicates per genotype. (B) Ratio of Aβ1–42 to Aβ1–40 from panel A. (C) Immunostaining of 3 months-of-age COs for Paired Helical Filament (PHF)-Tau (AT8, green) and MAP2 (mature neurons, red). Scale bar, 20 μm; alongside the final quantification. Isog. Set 1: n = 10–18 COs per genotype from 3 independent experiments; Isog. Set 2: n = 10–11 COs per genotype from 2 independent experiments. (D) Representative western blots (WB) of CO lysates at 1.5-month timepoint for phosphorylated Tau pT217, pT181 at its MS-validated monomeric molecular weight, pan-Tau at monomeric molecular weight (mTau hereafter), and -Tubulin (a-Tub). (E) WB Quantification of monomeric Tau (mTau) in CO lysates at the 1.5- (left), 3- (center), and 6-month (right) timepoints, as normalized to -Tubulin (a-Tub). n = 8–14 COs per genotype from 3 independent experiments. (E’) Representative WB of mTau and a-Tub in late-stage (4.5-month timepoint) CO lysates. (F-G) WB Quantification of phospho-Tau pT217 at its monomeric (~50 kDa)(F), and strongest high-molecular-weight (HMW)(~100 kDa)(G) bands in CO lysates at the 1.5, 3, and 6-month timepoints, as normalized to mTau. n = 5–12 COs per genotype from 3 independent experiments per timepoint. (H-I) WB Quantification of the pTau T181 bands at monomeric (~50 kDa) (K) and strongest HMW (~150 kDa) (L) bands at 3- and 6-month timepoints normalized to mTau. Data are mean ± SD. Analyses by ANOVA with Dunnett’s post-hoc test. See also Figures S6 and S7.
Figure 4:
Figure 4:. Autophagy can be efficiently activated in the AD COs
(A and B) Autophagosome staining via DAPRed live staining of COs in Neural Media (N.Media), with an overnight treatment of DMSO or 300 nM of Bafilomycin A1 (BafA1) as controls, along puncta quantification. Scale bar, 50 μm. (B) Quantification of average DAPRed+ puncta count per image. n = 3 COs per condition. Analysis by 2-way ANOVA with Dunnett’s and Sidak’s post-hoc tests for inter- and intra-genotype comparisons, respectively. (C) Representative immunofluorescence (IF) staining images of DALGreen and DAPRed signal in COs (pictured here: PSEN1delE9/WT) after a 24-hour treatment with either different concentrations of autophagy activators Rapamycin (Rapa), CCT020312 (CCT), Torin 1 (Torin1), or vehicle. Scale bar, 50 μm. (D and E) Quantification of the average IF DAPRed+ puncta count per image (D) and DALGreen to DAPRed puncta counts ratio (E). n = 5–10 images from 3–4 COs per condition from 1–2 independent experiments. (F) Representative WB of the dose-dependent LC3-II abundance increase in COs (pictured here: WT/WT (2)) after a 24-hour treatment with CCT. (G) WB Quantification of the relative LC3-II abundance in 24-hour-treated COs, normalized to their respective DMSO values. Data are mean ± SD. Analyses by ANOVA with Dunnett’s post-hoc test.
Figure 5:
Figure 5:. Chronic mTOR-independent autophagy activation reduces AD-associated Aβ and pTau aggregates, and hyperexcitability.
(A) Diagram describing the experimental set-up of the 4-week-long treatment of 2 months-of-age COs (3-month timepoint by end of treatment). (B) Measured change in the conditioned media levels of LDH (U/ml) at the end of treatment (4 weeks), compared to their basal levels at treatment day 0 (T0) (LDH at end of treatment minus LDH at T0). Data was Log-transformed to achieve normality. (C) Representative immunofluorescence (IF) images of the COs at the end of the treatment period. Scale bar, 100um. (D) Quantification of the beta amyloid percent coverage normalized to nuclei number of the COs. n = 3 COs per condition. (E) Quantification of the Pre-Helical Filament aggregated pTau (AT8+) percent coverage normalized to nuclei number of the COs. n = 3 COs per condition. (F) Average weighted mean firing rate of the WT/WT (1) and M146V/WT COs in the 12–24 hours period after treatment. n = 7–9 COs per genotype from 2 independent experiments. Data are mean ± SD. Analyses by ANOVA with Dunnett’s post-hoc test (B, D, and E) or Kruskal-Wallis 2-tailed non-parametric test (F). See also Figures S9, S10, and S11.
Figure 6:
Figure 6:. Chronic mTOR-independent autophagy activation with CCT rescues mTau, monomeric pTau, and synapses in the M146V mutant.
(A) Immunoblot quantification of synaptophysin-1 (Syn1 normalized to a-Tub) in CO lysates at 6 and 9 months-of-age. n = 3–4 COs per genotype. For each timepoint, Syn1 levels shown relative to WT/WT (isogenic set 1) levels. Unpaired t test with Welch’s correction with post-hoc FDR-adjusted p-values: p=0.0461 (M146V-vs-WT(1)), p=0.9082 (APPswe-vs-WT(1)). (B) Schematic describing the treatment of 6 months-of-age COs with CCT and its assessment at the end of a 6-week treatment regimen (harvested at 7.5 month-timepoint). (C) Quantification of LDH in conditioned media after 1, 2, and 4 weeks of treatment with DMSO vehicle vs. 100 nM, 500 nM, or 2.5 μM CCT for WT/WT (1) or M146V/WT. n = 5–6 COs per condition for WT/WT (1); n = 3 COs per condition for M146V/WT. (D) Representative immunoblots of WT/WT and M146V/WT CO lysates for pT217, pT181, mTau after 6-week treatment. (E) Quantification of monomeric Tau (mTau normalized to a-Tub) in CO lysates after 6-week treatment relative to DMSO. (F) Quantification of phosphorylated Tau T181 (pT181 normalized to a-Tub) in CO lysates after 6-week treatment relative to DMSO. (G) Quantification of pT181 bands (normalized to a-Tub) at various molecular weights (MW); specifically, at the monomeric band (50 kDa), major validated high-molecular-weight (HMW) band (150 kDa), and all HMW signals (75–250 kDa). (H) Quantification of phosphorylated Tau T217 (pT217, normalized to -Tubulin) relative to DMSO levels. (I) Quantification of pT217 bands (normalized to a-Tub) at various molecular weights (MW); specifically, at the monomeric band (50 kDa), major HMW band (100 kDa), and all HMW signals (75–250 kDa). (J) Representative immunoblot of DMSO vehicle- vs. CCT-treated M146V/WT CO lysates for Syn1 and a-Tub after 6-week treatment (left) with quantification (right). n = 3 COs per condition. Data are mean ± SD. Analyses by ANOVA with Dunnett’s post-hoc test.

Similar articles

References

    1. Brookmeyer R., Abdalla N., Kawas C.H., and Corrada M.M. (2018). Forecasting the prevalence of preclinical and clinical Alzheimer’s disease in the United States. Alzheimer’s & Dementia 14, 121–129. - PMC - PubMed
    1. Dubois B., Hampel H., Feldman H.H., Scheltens P., Aisen P., Andrieu S., Bakardjian H., Benali H., Bertram L., and Blennow K. (2016). Preclinical Alzheimer’s disease: definition, natural history, and diagnostic criteria. Alzheimers Dement 12. 10.1016/j.jalz.2016.02.002. - DOI - PMC - PubMed
    1. Jack C.R., Knopman D.S., Jagust W.J., Shaw L.M., Aisen P.S., Weiner M.W., Petersen R.C., and Trojanowski J.Q. (2010). Hypothetical model of dynamic biomarkers of the Alzheimer’s pathological cascade. The Lancet Neurology 9, 119–128. - PMC - PubMed
    1. Duyckaerts C., Potier M.-C., and Delatour B. (2008). Alzheimer disease models and human neuropathology: similarities and differences. Acta neuropathologica 115, 5–38. - PMC - PubMed
    1. Cullen N.C., Novak P., Tosun D., Kovacech B., Hanes J., Kontsekova E., Fresser M., Ropele S., Feldman H.H., and Schmidt R. (2024). Efficacy assessment of an active tau immunotherapy in Alzheimer’s disease patients with amyloid and tau pathology: A post hoc analysis of the “ADAMANT” randomised, placebo-controlled, double-blind, multi-centre, phase 2 clinical trial. EBioMedicine 99. - PMC - PubMed

Publication types

LinkOut - more resources