[Preprint]. 2025 Jul 11:2025.04.22.649933.
doi: 10.1101/2025.04.22.649933.

Stochastic activity in low-rank recurrent neural networks

Affiliations

Stochastic activity in low-rank recurrent neural networks

Francesca Mastrogiuseppe et al. bioRxiv. .

Update in

Abstract

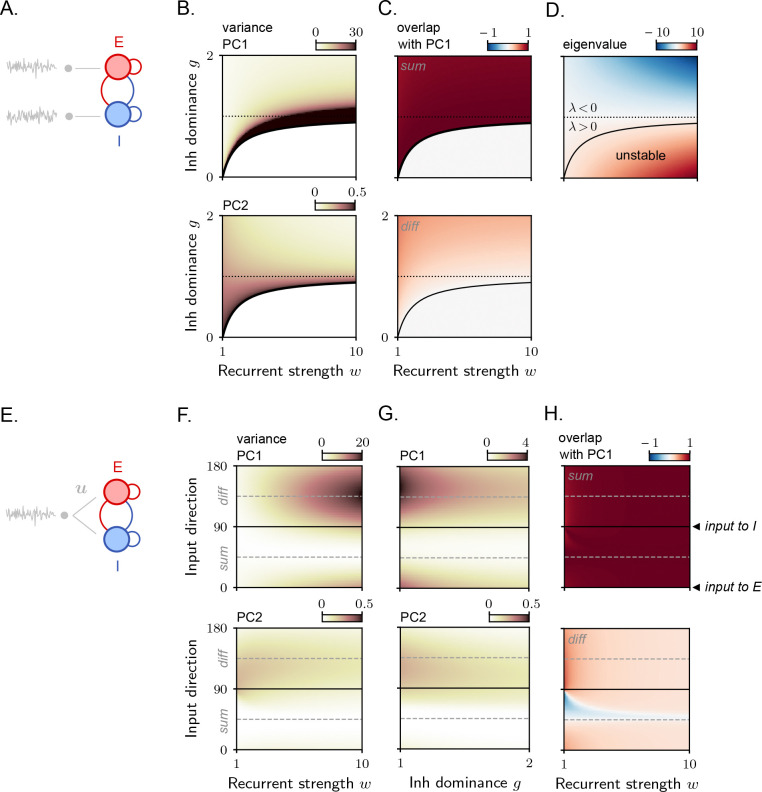
The geometrical and statistical properties of brain activity depend on the way neurons connect to form recurrent circuits. However, the link between connectivity structure and emergent activity remains incompletely understood. We investigate this relationship in recurrent neural networks with additive stochastic inputs. We assume that the synaptic connectivity can be expressed in a low-rank form, parameterized by a handful of connectivity vectors, and examine how the geometry of emergent activity relates to these vectors. Our findings reveal that this relationship critically depends on the dimensionality of the external stochastic inputs. When inputs are low-dimensional, activity remains low-dimensional, and recurrent dynamics influence it within a subspace spanned by a subset of the connectivity vectors, with dimensionality equal to the rank of the connectivity matrix. In contrast, when inputs are high-dimensional, activity also becomes potentially high-dimensional. The contribution of recurrent dynamics is apparent within a subspace spanned by the totality of the connectivity vectors, with dimensionality equal to twice the rank of the connectivity matrix. Applying our formalism to excitatory-inhibitory networks, we discuss how the input configuration also plays a crucial role in determining the amount of amplification generated by non-normal dynamics. Our work provides a foundation for studying activity in structured brain circuits under realistic noise conditions, and offers a framework for interpreting stochastic models inferred from experimental data.


Conflict of interest statement

Competiting interests The authors have declared that no competing interests exist.

Figures

Figure 1:
Figure 1:
Setup. A. Left: model architecture. Right: sample activity traces from three randomly chosen neurons. B. Rank-one recurrent connectivity. C. Illustration of a sample activity trajectory in the high-dimensional space where each axis corresponds to the activity of a different neuron. Activity (black arrow) is given by the sum of two components (Eq. 7, blue arrows); the direction of the component generated from recurrent interactions is fixed, and is aligned with the connectivity vector m.
Figure 2:
Figure 2:
Rank-one RNN receiving one-dimensional stochastic inputs. A. Model architecture. B. Activity covariance is low-dimensional, and is spanned by connectivity vector m together with the external input vector u. As a consequence, activity is contained within the plane collinear with these two vectors. C–D–E. Example of a simulated network with ρnu=0. In C: covariance spectrum. Components larger than 10 are not displayed (they are all close to zero). In D: overlap between the dominant principal components estimated from simulated activity and the theoretically-estimated PCs (left), or the vectors m and u (right). Overlaps are quantified via Eq. 4, with input vectors u chosen to be normalized. Note that here, but not in G, only one principal component can be identified. In E: simulated activity projected on the two dominant PCs. F–G–H. Same as in C–D–E, example with ρnu>0.
Figure 3:
Figure 3:
Rank-one RNN receiving high-dimensional stochastic inputs. A. Model architecture. B. The activity covariance is high-dimensional, with all eigenvalues taking identical values except for two – one larger and one smaller. The principal components associated with these two eigenvalues lie within the plane spanned by the connectivity vectors m and n. C. Covariance eigenvalues as a function of overlap between connectivity vectors. The dashed vertical line indicates the value of ρmn for which dynamics becomes unstable. Black arrows indicate the value of ρmn that is used for simulations in Fig. 4. D. Dimensionality. Horizontal black lines indicate the maximum (N) and the minimum (1) possible values. E. Components of v+ (or PC1 vector, left) and v- (or PCN vector, right) along connectivity vectors m and n, as from Eq. 24. F. Overlap (Eq. 4) between the principal components v+ and v- (after normalization) and the connectivity vectors m and n.
Figure 4:
Figure 4:
Rank-one RNN receiving high-dimensional stochastic inputs. A–B–C. Example of a simulated network with ρmn=-0.5. In A: covariance spectrum. In B: overlap between two principal components (the strongest and the weakest) estimated from simulated activity and the theoretically-estimated vectors v+ and v- (top), or vectors m and n (bottom). Overlaps are quantified via Eq. 4. In C: simulated activity projected on two different pairs of PCs. D–E–F. Same as in A–B–C, example with ρmn=0.3. Note that, although the qualitative behaviour of activity in the two examples is similar, activity in the example network in A–B–C is overall higher dimensional.
Figure 5:
Figure 5:
Stochastic activity in rank-two recurrent neural networks. A. Rank-two connectivity. B. Eigenvalues of the covariance matrix that are different than the reference value μref. As connectivity is rank-two, four eigenvalues are perturbed; we sort them in ascending order. Violin plots show the distribution of perturbed eigenvalues for different values of the parameters ρm1n1 and ρm2n2. Note that, for all sets of parameters, two eigenvalues are increased and two decreased with respect to μref. C. Dimensionality as a function of ρm1n1 and ρm2n2. The black dashed lines indicate the parameter values for which dynamics becomes unstable. The tiny black square indicates the parameter values that are used for simulations in F–G. In both B and C, we keep the values of ρm1m2 and ρn1n2 fixed to zero (see Methods 7). D–E. Same as for B–C, but for a different parametrization, where we keep ρm1n1 and ρm2n2 fixed to zero. F–G. Example of a simulated network, parameters indicated in C. In F: covariance spectrum. In G: overlap between four selected principal components (the strongest and the weakest) estimated from simulated activity and the theoretically-estimated covariance eigenvectors (left) and the connectivity vectors (right). Overlaps are quantified via Eq. 4. The theoretical expressions for this case are reported in Methods 7.
Figure 6:
Figure 6:
Stochastic activity in a rank-one excitatory-inhibitory circuit. A. E-I circuit with high-dimensional inputs. B. Variance explained by PC1 (top) and PC2 (bottom) as a function of the overall recurrent connectivity strength w and the relative dominance of inhibition g. In B–C–D, the black solid line separates the regions for which the non-zero eigenvalue λ is larger or smaller than one. The black dotted line separates the regions for which the non-zero eigenvalue λ is larger or smaller than zero. Note the different color scales in the top and bottom plots. C. Overlap between PC1 and the sum (top) and diff (bottom) directions. D. Non-zero eigenvalue of the synaptic connectivity matrix λ=w(1-g). E. E-I circuit with one-dimensional inputs. F. Variance explained by PC1 (top) and PC2 (bottom) as a function of the overall recurrent connectivity strength w and the direction of the input vector u. The input direction is parametrized by an angle θ (see Methods 8), so that θ=0 (resp. 90°) correspond to inputs entering only E (resp. I), while θ=45 (resp. 135°) corresponds to inputs aligned with the sum (resp. diff) direction. G. Variance explained by PC1 (top) and PC2 (bottom) as a function of the relative dominance of inhibition g and the direction of the input vector u. H. Overlap between PC1 and the sum (top) and diff (bottom) direction.

References

    1. Landau I. and Sompolinsky H.. Coherent chaos in a recurrent neural network with structured connectivity. PLOS Comput. Biol., 14(12):1–27, 12 2018. - PMC - PubMed
    1. Huang C., Ruff D., Pyle R., Rosenbaum R., Cohen M., and Doiron B.. Circuit models of low-dimensional shared variability in cortical networks. Neuron, 101:337–348, 2019. - PMC - PubMed
    1. Dahmen D., Layer M., Deutz L., Anna Dąbrowska P., Voges N., von Papen M., Brochier T., Riehle A., Diesmann M., Grün S., and Helias M.. Global organization of neuronal activity only requires unstructured local connectivity. eLife, 11:e68422, 2023. - PMC - PubMed
    1. Gao P. and Ganguli S.. On simplicity and complexity in the brave new world of large-scale neuroscience. Curr. Opin. Neurobiol., 32:148–55, 2015. - PubMed
    1. Wang J., Narain D., Hosseini E., and Jazayeri M.. Flexible timing by temporal scaling of cortical responses. Nat. Neurosci., 21(1):102–110, 2018. - PMC - PubMed

Publication types

LinkOut - more resources