[Preprint]. 2025 Jul 10:2025.07.07.660342.
doi: 10.1101/2025.07.07.660342.

Sex chromosome identification and genome curation from a single individual with SCINKD

Affiliations

Sex chromosome identification and genome curation from a single individual with SCINKD

Brendan J Pinto et al. bioRxiv. .

Abstract

In most animal species, the sex determining pathway is typically initiated by the presence/absence of a primary genetic cue at a critical point during development. This primary genetic cue is often located on a single locus-referred to as sex chromosomes-and can be limited to females (in a ZZ/ZW system) or males (in an XX/XY system). One trademark of sex chromosomes is a restriction or cessation of recombination surrounding the sex-limited region (to prevent its inheritance in the homogametic sex). This may lead to-through a variety of mechanisms-higher amounts of genetic divergence within this region, i.e. between the X/Z and Y/W chromosomes, especially when compared to their autosomal counterparts. Recent advances in genome sequencing and computation have brought with them the ability to resolve haplotypes within a diploid individual, permitting assembly of previously challenging genomic regions like sex chromosomes. Leveraging these advances, we identified replicable diagnostic characteristics between typical autosomes and sex chromosomes (within a single genome assembly). Under this framework, we can use this information to identify putative sex chromosome linkage groups across divergent vertebrate taxa and simultaneously curate misassembled regions on autosomes. Here, we present this conceptual framework and associated tool for identifying candidate sex chromosome linkage groups from a single, diploid individual dubbed Sex Chromosome Identification by Negating Kmer Densities, or SCINKD.


Conflict of interest statement

Conflict of interest statement: None declared.

Figures
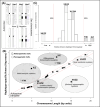
Figure 1:
Figure 1:
Simplified visual description of the SCINKD framework: (A) In many taxa, autosomes and sex chromosomes show disparate patterns where the region of restricted recombination (black) possesses increased haplotype-specific kmer (hap-mer) densities relative to the autosomal background. (B) This pattern drives overall increases in the number of hap-mers beyond what would be expected by chance (i.e. given the length of the chromosome). Each ‘bubble’ on the plot displays a hypothetical example of where the sex chromosomes of any given taxon could appear on the plot, including those that would be undetectable by SCINKD. (C) This deviation in hap-mers is detectable as a statistical outlier that can then be scrutinized using multivariate data visualization and/or additional data from samples of known sex.
Figure 2:
Figure 2:
Exemplars of (A-B) mammal: XY (chimpanzee, Pan troglodytes) and XX (Red fox, Vulpes vulpes) individuals; (C-D) avian reptile: ZW (Golden parakeet, Guaruba guarouba) and ZZ (Nicobar pigeon, Caloenas nicobarica) individuals; (E-F) lacertid lizard: ZW (Skyros wall lizard, Podarcis gaigeae) and ZZ (Cretan wall lizard, Podarcis cretensis) individuals. Each panel consists of SCINKD “.results” output ~ sequence length (Li et al., 2009) visualized using ggplot2 (Wickham, 2016) including only autosomes (exemplifying the predicted genome correlation), with an embedded panel demonstrating the full disparity between sex chromosomes and autosomes. Each panel also contains the corresponding minimap2 alignment (Li, 2018) of putative sex chromosome haplotypes visualized using SVbyEye (Porubsky et al., 2024).
Figure 3:
Figure 3:
Total evidence plot for the Cape cliff lizard, Hemicordylus capensis, under the SCINKD framework. The left panel consists of SCINKD “results” output ~ sequence length (Li et al., 2009) visualized with ggplot2 (Wickham, 2016). The right panel corresponds to a minimap2 alignment (Li, 2018) of putative sex chromosome haplotypes visualized using SVbyEye (Porubsky et al., 2024) overlaid with hap-mer densities in 1Mb windows across the chromosome. A single pair of haplotypes deviates from the autosomal background. The signal comes from nearly the entirety of LG13, a homologous pair that also aligns with relatively low sequence identity across its length. There is no evidence that the PAR region is present in this assembly. The convergence of evidence on a single region corroborates previous work showing this is the XY linkage group in this scincomorph lizard species (Leitão et al., 2023).
Figure 4:
Figure 4:
Total evidence plot for the Christmas Island skink, Cryptoblepharus egeriae, under the SCINKD framework. The left panel consists of SCINKD “results” output ~ sequence length (Li et al., 2009) visualized with ggplot2 (Wickham, 2016). The right panel corresponds to a minimap2 alignment (Li, 2018) of putative sex chromosome haplotypes visualized using SVbyEye (Porubsky et al., 2024) overlaid with hap-mer densities in 1Mb windows across the chromosome. A single pair of haplotypes deviate from the autosomal background. The signal itself originates from a single region at the center of two homologous contigs, a region that aligns poorly between haplotypes and possesses an excess of unique kmers. The convergence of evidence on a single region corroborates previous work in skinks and supports this region as the XY linkage group in this scincomorph lizard species (Kostmann et al., 2021) and was validated via alignment to chrX of the Three-lined skink, Acritoscincus duperreyi, assembly (GCA_041722995.2).
Figure 5:
Figure 5:
Total evidence plot for crested gecko, Correlophus ciliatus, under the SCINKD framework. The left panel consists of SCINKD “results” output ~ sequence length (Li et al., 2009) visualized with ggplot2 (Wickham, 2016). The right panel corresponds to a minimap2 alignment (Li, 2018) of putative sex chromosome haplotypes visualized using SVbyEye (Porubsky et al., 2024) overlaid with hap-mer densities in 1Mb windows across the chromosome. A single pair of haplotypes deviates from the autosomal background. The signal itself originates from LG19 across most of their length, a chromosomal pair that possesses generally low sequence identity across its length with the exception of a small region at the distal tip, consistent with a pseudoautosomal region (PAR). This evidence complements and is confirmed by previous work showing that LG19 is the ZW linkage group in the crested gecko and annotated the Z and W chromosomes using sex-specific RADtags (Gamble et al., 2015; Keating, 2022).
Figure 6:
Figure 6:
Total evidence plot for the lesser electric ray, Narcine bancroftii, under the SCINKD framework. The left panel consists of SCINKD “results” output ~ sequence length (Li et al., 2009) visualized with ggplot2 (Wickham, 2016). The right panel corresponds to a minimap2 alignment (Li, 2018) of putative sex chromosome haplotypes visualized using SVbyEye (Porubsky et al., 2024) overlaid with hap-mer densities in 1Mb windows across the chromosome. A single pair of haplotypes deviates from the autosomal background. The signal itself originates from a single region at the center of LG12, a region that aligns poorly between haplotypes and possesses an excess of unique kmers. The convergence of evidence on this region corroborates previous work showing this is the conserved XY linkage group in many elasmobranch species (Lee et al., 2025). Here, the X and Y are annotated based on homology with previously annotated X and Y in related species.
Figure 7:
Figure 7:
Total evidence plot for the San Diegan legless lizard, Anniella stebbinsi, under the SCINKD framework. The left panel consists of SCINKD “results” output ~ sequence length (Li et al., 2009) visualized with ggplot2 (Wickham, 2016). The right panel corresponds to a minimap2 alignment (Li, 2018) of putative sex chromosome haplotypes visualized using SVbyEye (Porubsky et al., 2024) overlaid with hap-mer densities in 1Mb windows across the chromosome. A single pair of haplotypes deviates from the autosomal background. The signal itself originates from a single region at the distal end of LG7, a region that possesses reduced sequence identity relative to the rest of the pairwise alignment. The convergence of evidence on a single region provides strong support for a hypothesis of a ZZ/ZW system in this anguimorph lizard. Here, the Z and W were hypothesized due to sequence length and additionally supported by alignment to the corresponding linkage group (NC_086184.1) in the Southern alligator lizard, Elgaria multicarinata, assembly (GCF_023053635.1), where average sequence identity was slightly higher on the putative Z-specific region (81%) than on the W-specific region (80%), which would expected due to higher rates of sequence divergence on chrW.
Figure 8:
Figure 8:
Total evidence plot for the Christmas island gecko, Lepidodactylus listeri, under the SCINKD framework. The left panel consists of SCINKD “results” output ~ sequence length (Li et al., 2009) visualized with ggplot2 (Wickham, 2016). The right panel corresponds to a minimap2 alignment (Li, 2018) of putative sex chromosome haplotypes visualized using SVbyEye (Porubsky et al., 2024) overlaid with hap-mer densities in 1Mb windows across the chromosome. A single pair of haplotypes deviates from the autosomal background. The signal itself originates from two poorly aligned regions between the haplotype pairs. The convergence upon a linkage group of interest, but not focused on a specific region, provides moderate-to-low support for a hypothesis that LG18 is the XY linkage group in this gecko species and could warrant further investigation using gene annotations and/or data from additional individuals. Low confidence of support for this putative XY system preempts an attempt to accurately assign haplotypes as X and Y, labels here are arbitrary assuming the “Y” is the shorter of the two haplotypes.
Figure 9:
Figure 9:
Total evidence plot for the New Caledonia shrub, Amborella trichopoda, under the SCINKD framework. The left panel consists of SCINKD “results” output ~ sequence length (Li et al., 2009) visualized with ggplot2 (Wickham, 2016). The right panel corresponds to a minimap2 alignment (Li, 2018) of putative sex chromosome haplotypes visualized using SVbyEye (Porubsky et al., 2024) overlaid with hap-mer densities in 1Mb windows across the chromosome. A single pair of haplotypes deviates from the autosomal background. The signal itself originates from a single region at the distal end of LG7, a region that possesses reduced sequence identity relative to the rest of the pairwise alignment. The haplotype density and pairwise alignment in the previously identified sex-limited region is concordant with previous work showing these are the Z and W chromosomes in this species of shrub (Carey et al., 2024). However, no robust statistical support is observed under the SCINKD framework, suggesting plants do not conform to our vertebrate-centric predictions of haplotype divergence.
Figure 10:
Figure 10:
Total evidence plot for the Florida reef gecko, Sphaerodactylus notatus, under the SCINKD framework. The left panel consists of SCINKD “results” output ~ sequence length (Li et al., 2009) visualized with ggplot2 (Wickham, 2016). The right panel corresponds to a minimap2 alignment (Li, 2018) of putative sex chromosome haplotypes visualized using SVbyEye (Porubsky et al., 2024) overlaid with hap-mer densities in 1Mb windows across the chromosome. We see no explicit evidence of the XX/XY system in this species under the SCINKD framework. A lack of convergence upon a common slope suggests issues with the genome assembly. The sex chromosome linkage group itself, identified by previous work (Pinto et al., 2022), also shows no evidence of sex chromosome patterns in the sex-limited region suggesting an excess of noise, likely caused by low sequencing coverage (~20x). However, we were able to annotate the X and Y chromosomes using sex-specific RADtags (Pinto et al., 2022).

Similar articles

References

    1. Alonge M., Lebeigle L., Kirsche M., Jenike K., Ou S., Aganezov S., Wang X., Lippman Z. B., Schatz M. C., & Soyk S. (2022). Automated assembly scaffolding using RagTag elevates a new tomato system for high-throughput genome editing. Genome Biology, 23(1), 258. - PMC - PubMed
    1. Antipov D., Rautiainen M., Nurk S., Walenz B. P., Solar S. J., Phillippy A. M., & Koren S. (2024). Verkko2: Integrating proximity ligation data with long-read De Bruijn graphs for efficient telomere-to-telomere genome assembly, phasing, and scaffolding. In bioRxiv. 10.1101/2024.12.20.629807 - DOI - PMC - PubMed
    1. Behrens K. A., Koblmueller S., & Kocher T. D. (2024). Diversity of sex chromosomes in vertebrates: six novel sex chromosomes in basal haplochromines (Teleostei: Cichlidae). Genome Biology and Evolution, 16(7), evae152. - PMC - PubMed
    1. Bergero R., & Charlesworth D. (2009). The evolution of restricted recombination in sex chromosomes. Trends in Ecology & Evolution, 24(2), 94–102. - PubMed
    1. Card D. C., Jennings W. B., & Edwards S. V. (2023). Genome Evolution and the Future of Phylogenomics of Non-Avian Reptiles. Animals : An Open Access Journal from MDPI, 13(3). 10.3390/ani13030471 - DOI - PMC - PubMed

Publication types

LinkOut - more resources